S&P, Nasdaq, and semiconductor indices simultaneously broke below their upward trendlines, with market panic levels rising to the highest since March.
TL;DR
· The S&P 500 fell 2.02% to 7,176, its first six-day losing streak since April 2024, and closed below its 200-day moving average for a third straight day.
· The Philadelphia Semiconductor Index was up as much as 4.7% intraday before closing down 2.41%, breaking below a key uptrend line alongside the S&P 500 and Nasdaq 100.
· NYSE down volume rose to 87.1%, and the number of Nasdaq stocks hitting 52-week lows exceeded those hitting 52-week highs for a 59th consecutive session.
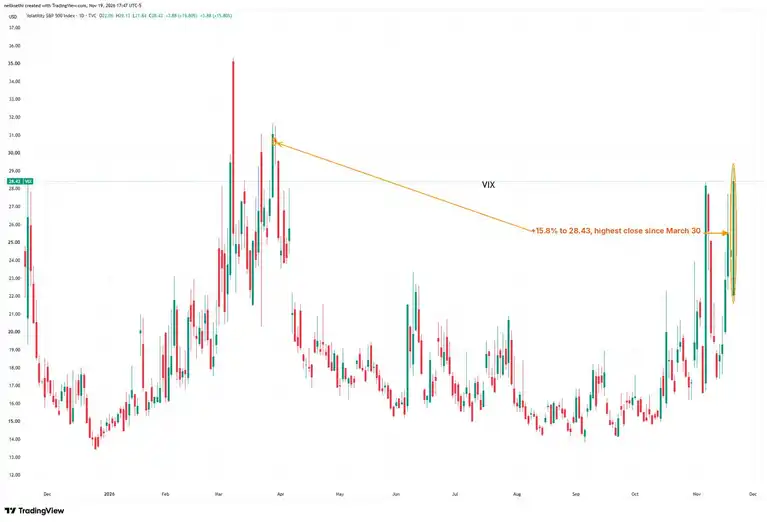
· The VIX rose 15.8% to 28.43, its highest close since late March. Ahead of monthly options expiration, the 1-day VIX implied a single-day move of about 2.02% for the S&P 500 on Friday.
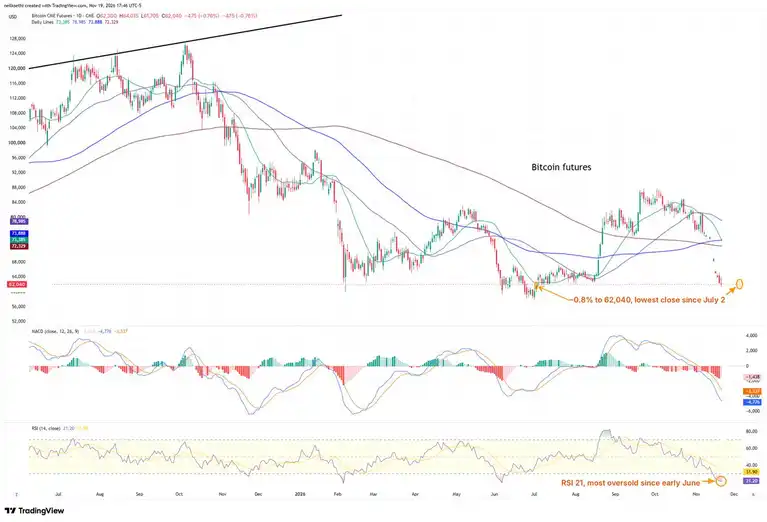
· Treasury yields pulled back while the dollar index continued to strengthen. Bitcoin futures closed at $62,040, with the 14-day relative strength index falling to 21.
Anthropic surged on its first day of trading, but U.S. stocks saw a sizable reversal on the same session. The Philadelphia Semiconductor Index went from a gain of nearly 5% to a loss of more than 2%, while nearly 90% of NYSE volume was concentrated in declining stocks. For TheStreet Pro columnist Neil Sethi, what is worth tracking is how far this selling pressure has spread and whether the major indexes can reclaim the technical levels they had previously held.
Semiconductor stocks lead decline as all three major indexes lose uptrend lines
On Nov. 19, the S&P 500 rose as high as 7,416 intraday, up about 1.3%, before closing down 2.02% at 7,176, its lowest close since April 29. The index broke below an uptrend line drawn from the April 2025 low and connecting the March 2026 low, and closed below its 200-day moving average (7,348) for a third straight day. The 14-day relative strength index (RSI) fell to 31, approaching oversold territory typically marked by 30. RSI measures recent momentum.
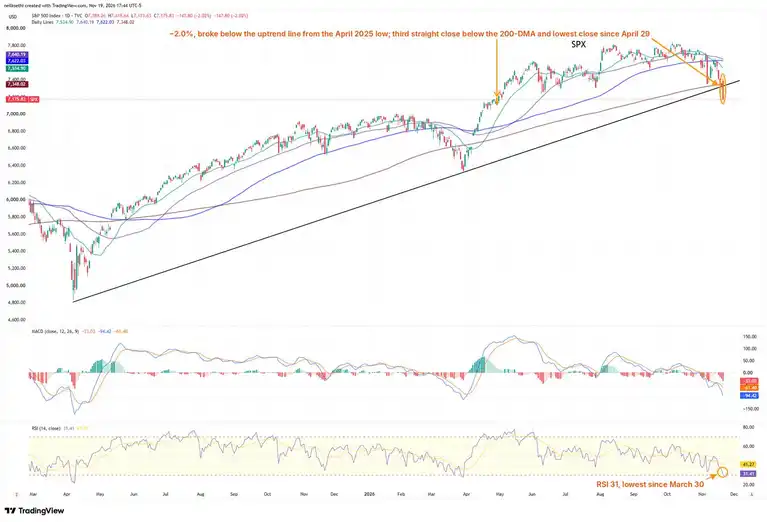
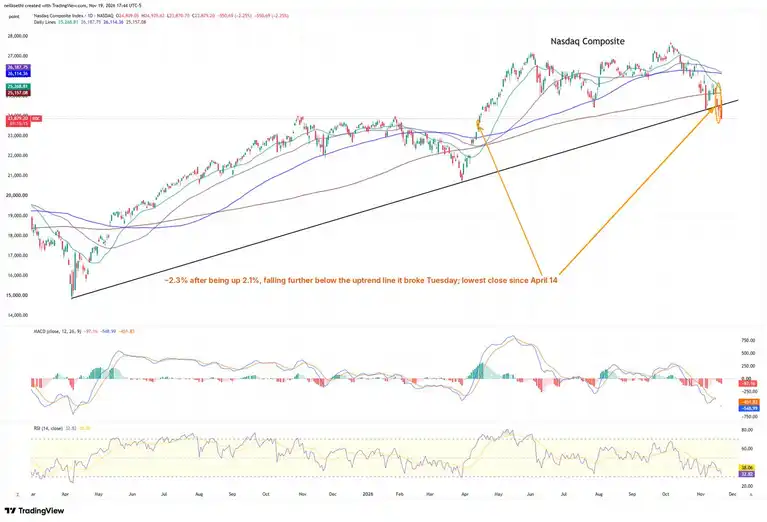
The tech reversal was more dramatic. The Nasdaq Composite swung from a gain of 2.1% intraday to a close down 2.25% at 23,879. The Nasdaq 100 fell 2.21% to 26,517, breaking below an uptrend line it had held for the prior two sessions and closing below its 200-day moving average (28,071) for a fifth straight day. The Philadelphia Semiconductor Index swung from a gain of 4.7% intraday to a close down 2.41% at 9,420, also losing the trendline it had held the previous session and sitting below its 200-day moving average (10,917).
Small caps and equal-weight indices also came under pressure. The Russell 2000 fell 2.18% to 2,655 points, closing at the intraday low and below its 200-day moving average for a sixth consecutive day. The equal-weight S&P 500 dropped 1.77% to 8,567 points, breaking below its 50-day moving average and touching the lower edge of its rising channel, while remaining above its 200-day moving average (8,469 points).
Nearly 90% of NYSE volume concentrated in decliners, VIX rises to highest since late March
Market breadth indicators measuring advancing and declining coverage weakened further. The share of NYSE volume in advancing stocks fell to 12.9% from 39.3% the prior day, while declining stocks accounted for 87.1% of volume. The share of Nasdaq volume in advancing stocks also fell to 32.8% from 43.9%.
The difference between 52-week highs and lows on the NYSE fell to negative 413 from negative 336, and on the Nasdaq to negative 744 from negative 584. The number of Nasdaq stocks hitting 52-week lows has exceeded the number hitting 52-week highs for 59 consecutive trading days, the longest streak since November 2022.
The VIX, which measures the implied volatility of the S&P 500 over the next 30 days, rose 15.8% to 28.43, the highest close since March 30, equivalent to a daily swing of about 1.79%. The VVIX, which reflects the VIX's own implied volatility, rose 7.4% to 127.10. The 1-day VIX, covering a shorter horizon, rose 37.9% to 32.06, corresponding to an S&P single-day move of about 2.02% on Friday's monthly options expiration, according to Sethi's conversion.
Treasury yields retreat; gold, copper and bitcoin futures weaken
The 2-year Treasury yield fell 3.6 basis points to 4.77%, declining for a fifth consecutive day and still about 89 basis points above the midpoint of the federal funds target range. The 10-year and 30-year yields both declined for a fourth consecutive day, at 5.05% and 5.41%, respectively. Meanwhile, the dollar index rose 0.11% to 103.93, the highest close since early April 2025, with its 14-day RSI rising to 71, entering overbought territory.
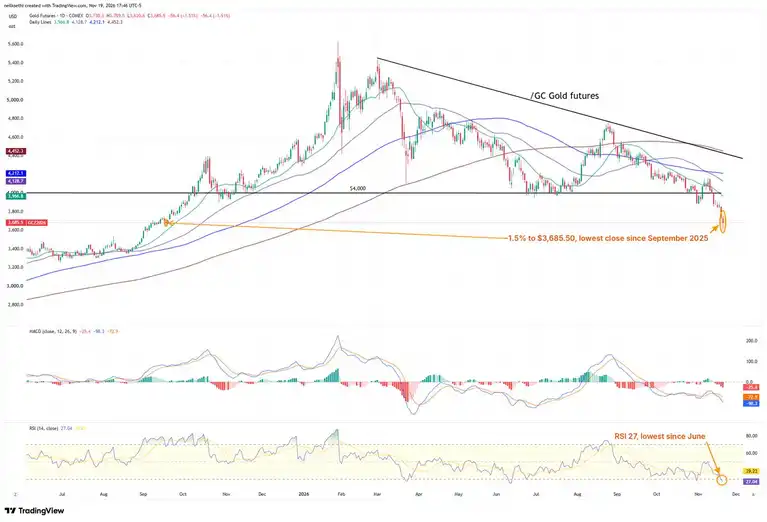
Gold futures fell 1.51% to $3,686, the lowest close since September 2025, with the RSI dropping to 27. Copper futures fell 0.62% to $5.63, with an RSI of 23, the deepest oversold range since July 2022. WTI crude oil futures edged up 0.16% to $82.44, while natural gas futures briefly broke above $3.40 intraday before closing down 3.08% at $3.27. Gold, WTI and natural gas quotes include after-hours trading.
Bitcoin futures fell 0.76% to $62,040, the lowest close since July 2, with an intraday low of $61,705, below the 200-day moving average ($72,329). Its RSI dropped to 21, the lowest since early June. Sethi noted that when similar oversold readings appeared in early June, Bitcoin only rebounded briefly, and a more pronounced rally did not emerge until late August.
Welcome to join the official BlockBeats community:
Telegram Subscription Group: https://t.me/theblockbeats
Telegram Discussion Group: https://t.me/BlockBeats_App
Official Twitter Account: https://twitter.com/BlockBeatsAsia
 Related Articles