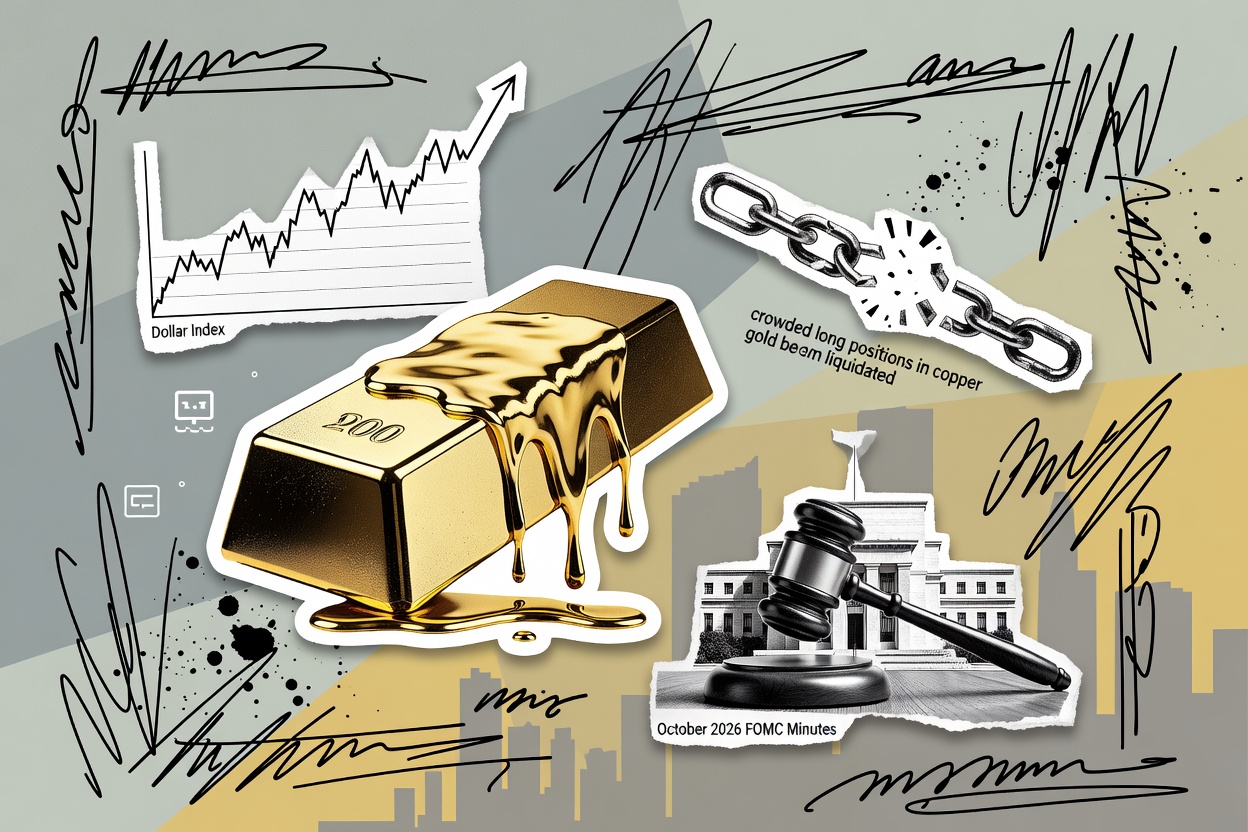
Gold has fallen to a one-year low, so why is no one buying it as a safe haven this time?

TL;DR
· The October 2026 meeting minutes show that almost all participants believed further rate hikes were needed, rate futures priced a December hike at over 90%, and the dollar index rose to a 19-month high.
· Gold, silver, and copper all fell in the same week. Gold was sold as a liquidity source to raise cash, copper saw crowded long positions unwound, and tight Chinese spot supply suggests copper's decline does not look like a demand collapse.
· Related instruments: gold and silver ETFs, copper ETFs and copper mining stocks, the dollar index, and 10-year U.S. Treasuries.
On November 18, 2026, spot gold fell about 3.2% in a single day to its lowest level since September 2025. Silver dropped about 5%. London Metal Exchange three-month copper fell 5.7%, the lowest since April. On the same day, the dollar index stood at a 19-month high of about 104.
Based on past experience, when stocks and AI-related positions retreat, capital flows into gold. This time it did not.
For ordinary investors, understanding this selloff requires just one comparison. U.S. Treasuries offer a coupon of about 5%, while gold yields nothing that day. The higher rates are and the stronger the dollar is, the greater the opportunity cost of holding gold. This explains the first layer of pressure on gold and silver, but it does not explain why copper was hit on the same day, nor why gold's decline far exceeded the dollar's rise.
Why were three asset classes sold off together in the same week? A higher rate anchor and a stronger dollar were the common backdrop, and the simultaneous unwinding of crowded positions was the amplifier. Only by separating the two layers can one see clearly what gold and copper were each falling on.
After the minutes, a December hike was priced at 90%
On October 28, 2026, the Federal Reserve kept the federal funds rate range at 3.75% to 4.00%, with a 10-2 vote as two officials favored a 25-basis-point hike. The meeting minutes released on November 18 showed that almost all participants believed further rate hikes were needed under the baseline scenario. A few participants mentioned that if inflation data were unfavorable, a move larger than 25 basis points could be considered in December.
This was the judgment as of the October meeting, not a decision already made for December. The market treated it as a done deal because the implied probability from rate futures had risen above 90%. That probability is a traded odds, not a voting result.
Official comments reinforced the same direction. Fed Governor Waller publicly discussed a 50-basis-point hike in December and a faster rate path in 2027. New York Fed President Williams said further tightening was needed but dramatic action was not necessary. Both pointed to more hikes, with disagreement only on the magnitude. The dollar index rose for about seven consecutive trading days to its highest since April 2025, the most direct price expression of this set of expectations.
Gold's Decline is Five Times the Dollar's Gain
Gold prices have fallen about 10% over the past seven trading sessions, while the dollar rose only about 2% over the same period. Exchange rate conversion can only explain a small portion — the rest comes from positioning and momentum.
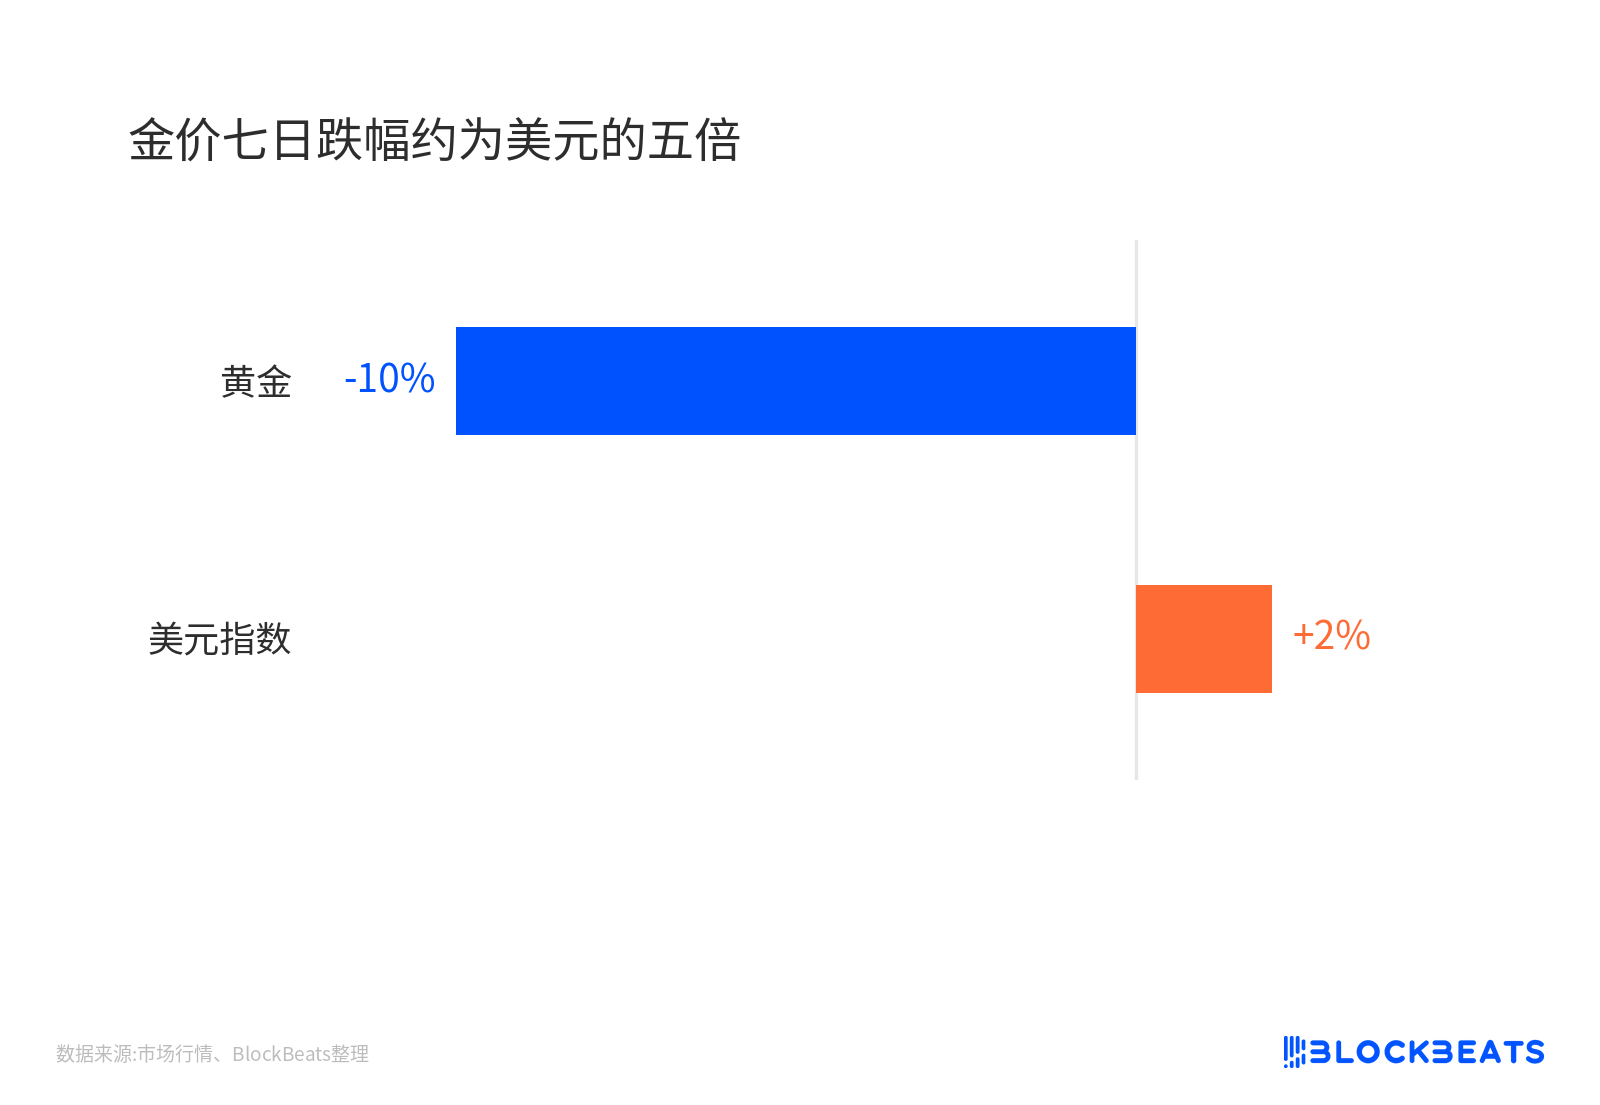
Gold's seven-day decline is roughly five times that of the dollar
An easily overlooked detail is that most of the gold price drop on the 18th occurred before the release of the meeting minutes. The minutes were more a confirmation of existing pricing than the trigger for the selloff. On the same day, the 10-year U.S. Treasury yield actually fell about 8 basis points, and further declined to about 5.05% on the 19th, marking four consecutive days of decline. This round of selling cannot be attributed to rising yields — what strengthened in tandem was the dollar.
Chris Gaffney of EverBank attributed gold price pressure to rate expectations and a strong dollar. Nikki Shiels of MKS PAMP offered another layer of explanation: in the short term, gold is a liquid asset used to raise cash. When equities and AI positions retreat simultaneously, selling gold for cash is faster than other assets. This explains why gold doesn't rise when stocks fall, but it is a mechanistic judgment and cannot be verified trade-by-trade as to the source of selling.
Gold ETF holdings remain very high. If policy continues to be tight, there is still room for these positions to be unwound. It's not that gold lacks safe-haven demand — it's that too many people hold it, and marginal buyers are retreating in the face of interest rates.
Funds Are Retreating, Chinese Spot Buyers Are Snapping Up
Copper fell more sharply than gold. On the 18th, LME copper dropped 5.7%, and COMEX copper fell as much as 6.7% intraday. Looking at futures and spot together reveals two opposite directions.
On the futures side, positions are retreating. Net long positions in copper held by funds have fallen from their mid-September peak to less than half, with both the AI demand and tariff stockpiling bullish narratives being reduced simultaneously.
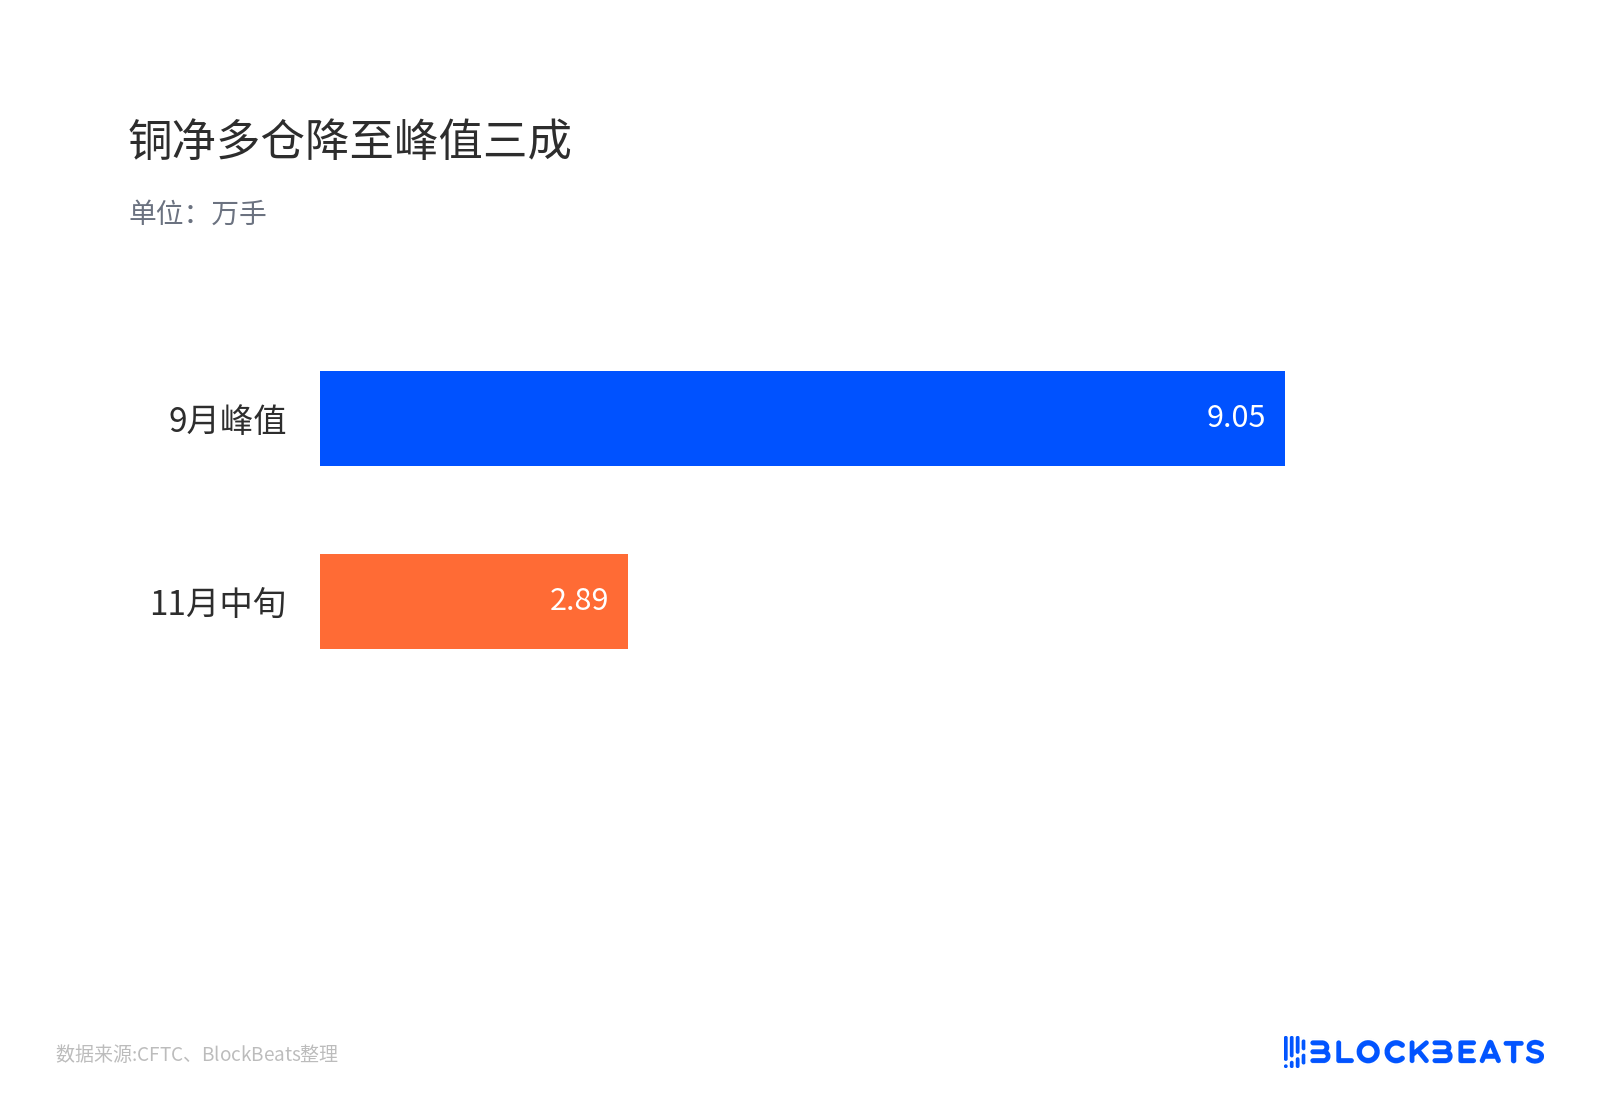
Net long copper positions have fallen from the September peak to less than half
The spot market tells a different story. Copper inventories at the Shanghai Futures Exchange have dropped to their lowest level since December 2023, and the Yangshan copper premium has risen noticeably. The latter is the premium on imported copper at port of arrival — a rise means spot cargo is in high demand. The U.S. has locked large amounts of copper into warehouses under tariff expectations, while Chinese buyers want cargo that can arrive at port immediately.
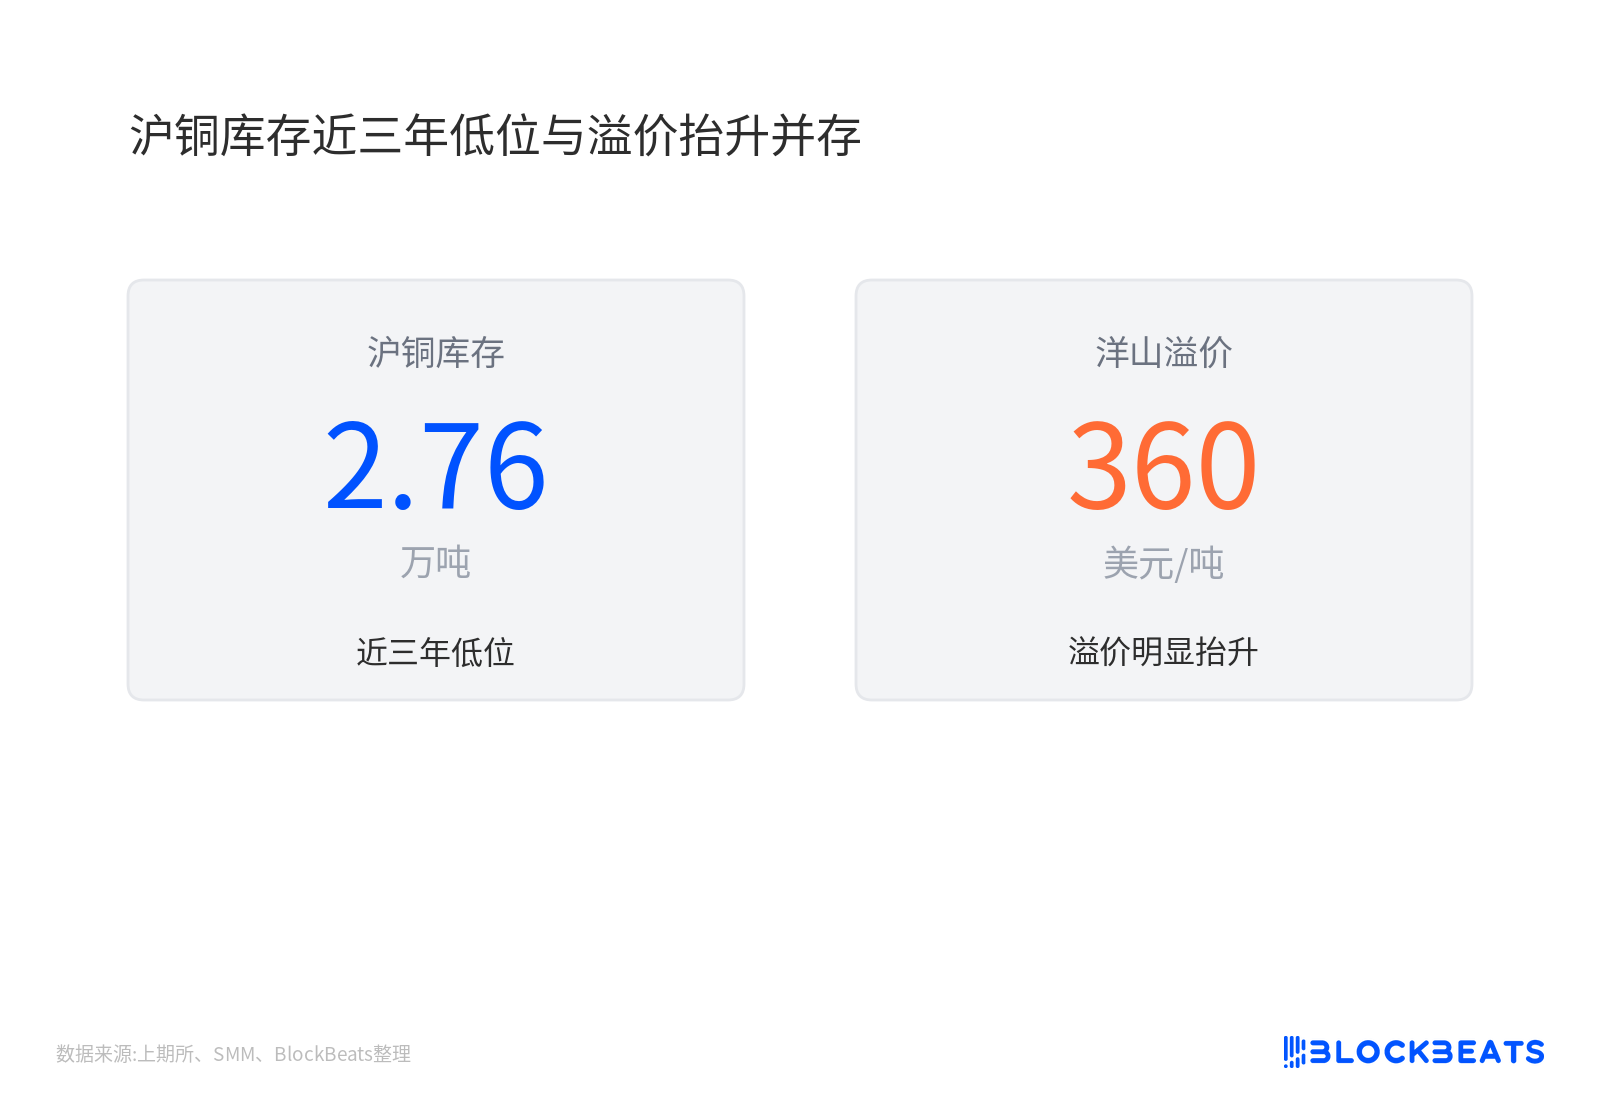
SHFE copper inventories at near three-year lows coexist with rising premiums
This is exactly where Goldman Sachs diverges from Mercuria's Nicolas Snowden and Natixis. Goldman Sachs believes the recent copper pullback is more about positioning, with fundamentals intact, and maintains a relatively high 2027 price framework while flagging downside risk. Snowden argues that current copper demand is closer to a recessionary environment. Natixis calls the U.S. stockpiling and AI capital flows a bubble. The debate is about the same thing: in this selloff, is it positioning or demand that's being sold?
On the 19th, LME copper rebounded about 0.4%, not following gold's continued weakness. China's spot tightness cannot prove that copper prices will rise immediately, but it is enough to refute the simplistic conclusion that Chinese demand has suddenly collapsed.
The Dollar, Tariffs and AI Spending Determine How Far the Divergence Can Go
The December 8-9 FOMC meeting is the nearest validation point. Futures are currently pricing a 25-basis-point cut as the baseline, with the probability of a 50-basis-point cut at only single digits to just over 10%. If only 25 basis points are delivered and the language is not more hawkish, the dollar could give back some of its gains, and the first layer of pressure on gold and silver would ease first.
Copper's validation point lies in a different direction. Whether the U.S. refined copper tariff takes effect will determine whether the inventory locked in warehouses flows back. Whether AI capital spending is actually cut will determine whether copper's AI demand narrative can be sustained. Neither of these is within the scope of the December meeting's decisions, yet they determine whether spot premiums and futures prices will converge again.
On the 19th, copper rebounded while gold remained weak — divergence has appeared, but one trading day cannot be taken as evidence that the trend is over. A more prudent judgment is that this is a cross-asset selloff triggered jointly by the upward shift in the rate anchor and the clearing of crowded positions. Gold was sold as cash, and copper paper longs were liquidated. The degree of tightness in China's spot market is the variable least cooperative with the bears in this round of deleveraging.
Welcome to join the official BlockBeats community:
Telegram Subscription Group: https://t.me/theblockbeats
Telegram Discussion Group: https://t.me/BlockBeats_App
Official Twitter Account: https://twitter.com/BlockBeatsAsia
 Related Articles