
CoreWeave's revenue grew 168%, so why did it still lose $700 million?

On November 10, US Eastern Time, AI cloud service provider CoreWeave released its third-quarter report, once again raising its full-year revenue forecast. In the announcement, company co-founder and CEO Michael Intrator emphasized that the adjusted operating margin reached double digits one quarter ahead of schedule.
There is one detail in this report worth pausing to examine. According to the company's financial report, quarterly revenue grew about 168% year over year, yet the company still ultimately recorded a net loss of about $700 million. More computing power was sold, so why didn't profit stay behind?
Only by putting revenue, equipment costs, and financing on the same ledger can one understand why these two results appeared at the same time. For a cloud company that must first deploy servers and then continuously deliver services, the money customers pay must go through several deductions before it becomes the net profit shareholders see.
Has revenue growth already improved operations?
The answer can be found in the quarterly changes. According to official performance materials, revenue in the latest quarter reached $3.661 billion, an increase of more than $1 billion from the previous quarter. The newly added revenue alone is equivalent to a sizable quarterly business.
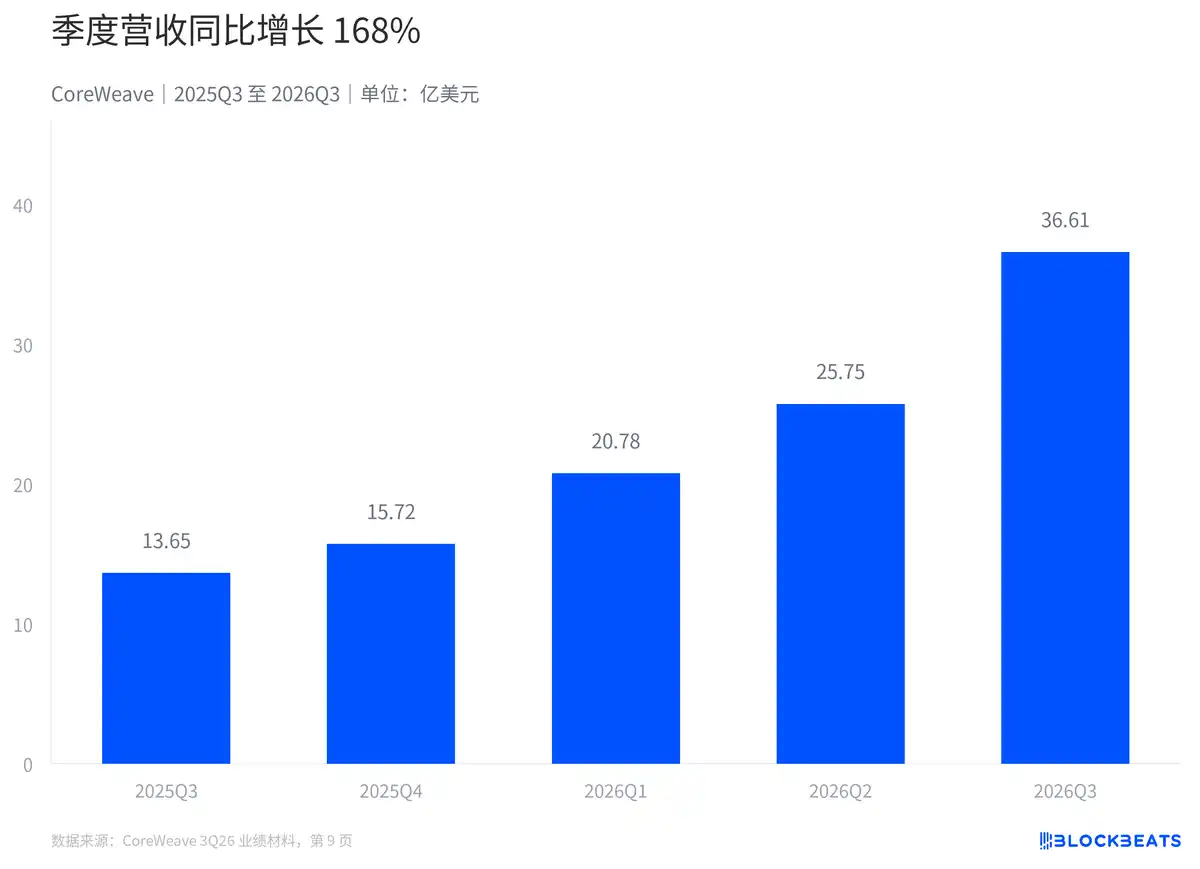
Quarterly revenue grew 168% year over year
The company attributed the growth in its materials to delivery execution, more favorable pricing, and customer demand. These are management's explanations for operational changes. Revenue totals alone are not enough to separately calculate how much was contributed by new capacity and how much by price increases.
Operational improvement has indeed also entered the accounting statements. The financial report shows that operating profit turned positive this quarter, meaning recognized service revenue has covered the costs and expenses included in operating activities for the quarter. Only by looking at operating profit and net profit together can one identify at which level the loss occurred.
Operations are already profitable, so where does the net loss come from?
The most eye-catching profitability metric in the financial report is adjusted EBITDA. This metric excludes interest, taxes, depreciation and amortization, and certain adjustment items specified by the company. It is suitable as an auxiliary view of operations, but it is still a long way from final net profit.
According to the company's reconciliation table, adjusted EBITDA this quarter was $2.256 billion, while depreciation and amortization alone were $1.889 billion. The latter is more than 80% of the former, and the consumption of servers and other assets occupies a very heavy position in the income statement.
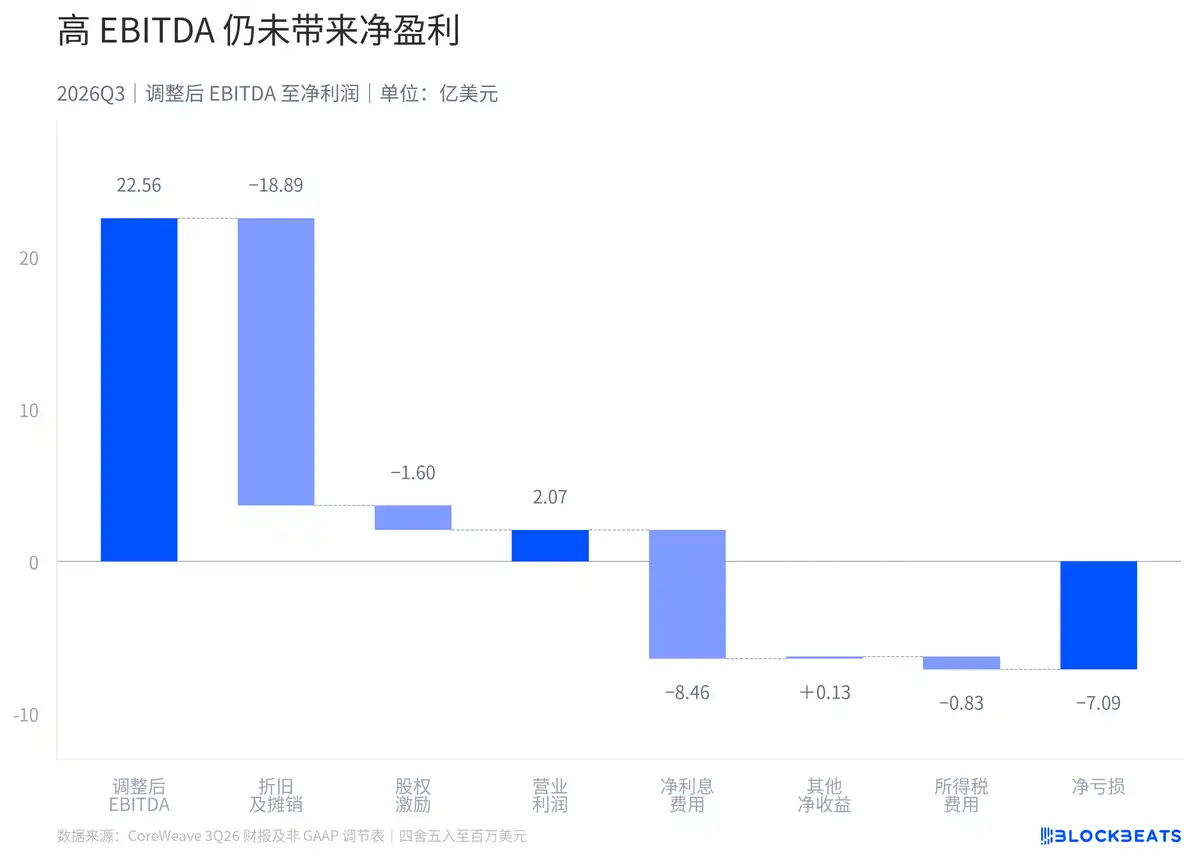
Adjusted EBITDA becomes a net loss after deductions for depreciation, stock-based compensation, and financing costs
Depreciation and amortization do not require paying again this quarter for equipment purchased, yet they remain accounting costs. When purchasing long-term assets, payment occurs in a concentrated manner, while costs are allocated over the useful life according to applicable accounting policies. Adding depreciation back cannot make the economic consumption of equipment disappear.
After further deducting stock-based compensation, the bridge in the chart reaches operating profit. The next large expense that appears here is interest. Calculated according to disclosed financial statement values, net interest expense is approximately 4.1 times operating profit, and the profit left from operations is insufficient to cover this financing cost.
Other net income and income tax continue to enter the calculation, ultimately landing on a net loss. There is also an easily confused point here: net interest expense includes the impact of applicable accounting treatment and cannot be directly treated as all the interest cash paid out from the bank account this quarter.
Therefore, high adjusted EBITDA, positive operating profit, and a final net loss can all hold true simultaneously. They stop at different positions along the same profit calculation path, and when evaluating the company, the excluded costs need to be added back.
Beyond losses, is there enough money for expansion?
Turning to the cash flow statement, the picture changes again. The financial statements show that this quarter's operating activities generated net cash inflow. Net loss, after adjustments for non-cash items such as depreciation and stock-based compensation, as well as the timing of collections and payments, yields operating cash flow; the two will inherently not be exactly the same.
But positive operating cash flow only answers the result of operating receipts and payments. Cash expenditures for the purchase and construction of servers and related assets are listed under investing activities, and to judge whether expansion can be supported by operating cash, this amount still needs to be connected.
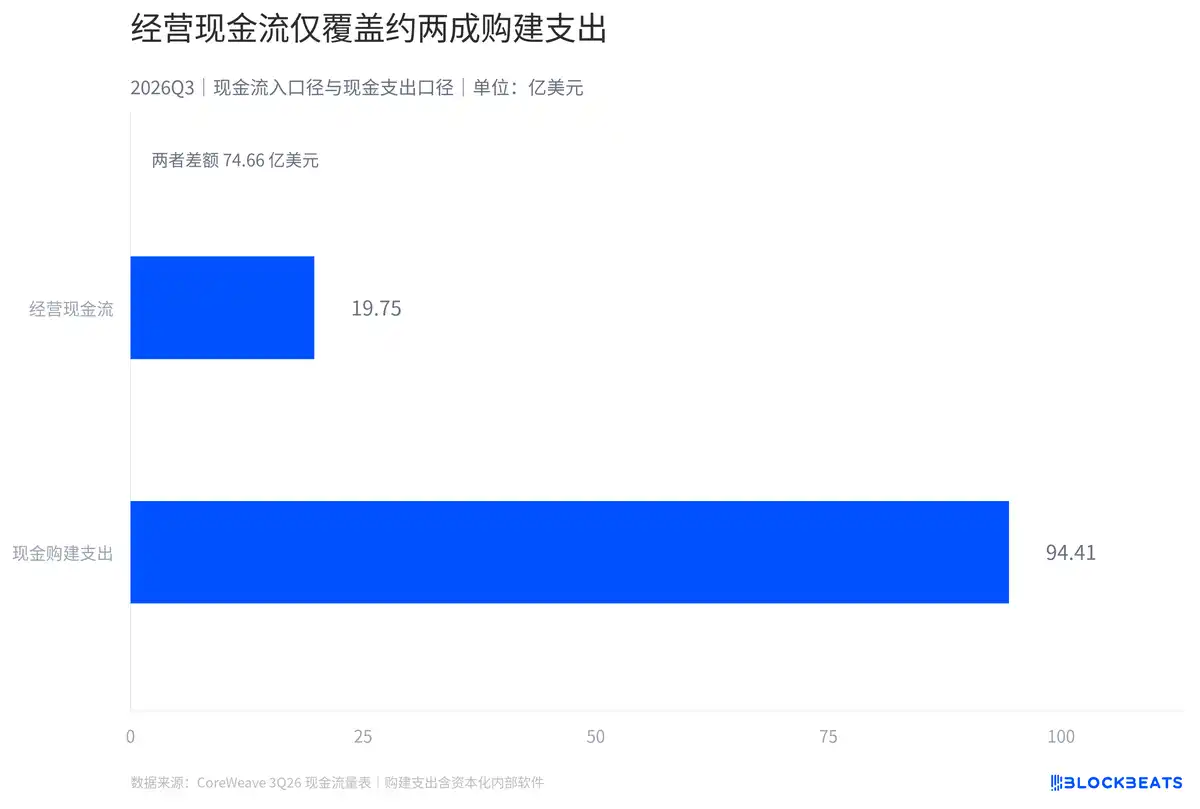
Operating cash flow covers only about 20% of cash capital expenditures
Calculated according to the two values in the financial statements, operating cash flow covers only about 20% of cash capital expenditures. It can be understood as: for every $100 spent on purchasing and constructing assets, operating net inflow during the same period can provide only about $21, with the remainder requiring support from other funding sources.
The gap between these two items is approximately $7.466 billion. It is a comparison under an explicit formula and cannot be used to replace the change in this quarter's cash balance. The company also has other investing activities, financing activities, and cash already held at the beginning of the period.
The financial statements also disclose capital expenditures as defined by the company. This figure includes assets acquired through finance leases and adjusts for changes in construction in progress, using a different basis from the purchase and construction expenditures in the cash flow statement. Directly subtracting operating cash flow from it would mix the timing difference between physical deployment and cash payment into the same result.
How large is the financing supporting expansion already?
The cash flow statement in this quarter's financial report shows net cash inflow from financing activities of $7.361 billion. Financing is replenishing the funding pool, but new financing also brings corresponding contractual obligations, and changes in scale need to be confirmed back on the balance sheet.
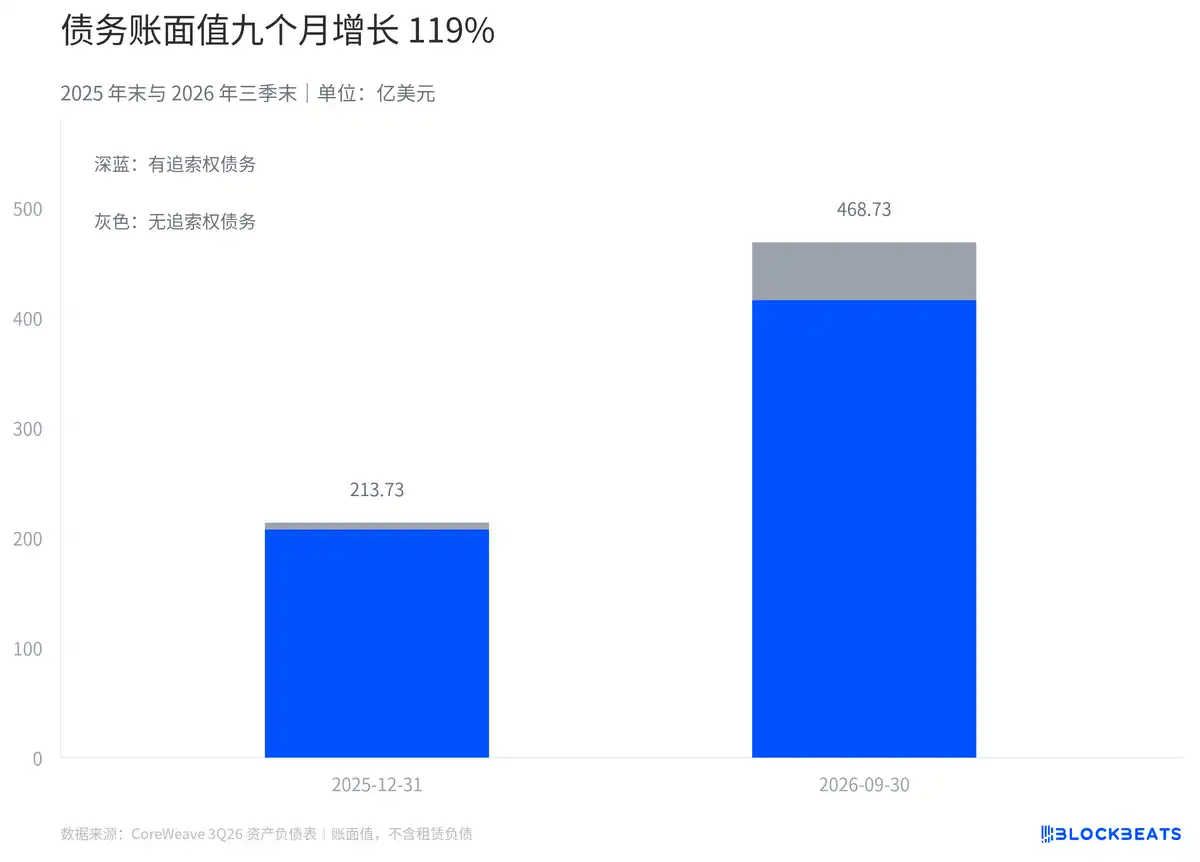
Debt book value increased 119% from the end of the prior year
Adding together the recourse and non-recourse debt, and the current and non-current portions in the financial report, the book value at the end of the third quarter was approximately $46.873 billion. That is an increase of about 119% compared with the end of the prior year, equivalent to more than doubling over nine months. This calculation does not include lease liabilities.
The debt classification also determines how it cannot be interpreted. The current portion and the non-current portion correspond to different accounting presentation periods, while recourse and non-recourse involve different recourse arrangements. The aggregate figure alone cannot determine that all debt must be repaid immediately, nor can it be used to back out a uniform actual financing rate.
Revenue backlog likewise must be viewed in the context of contractual conditions. According to official materials, the company's revenue backlog at the end of the third quarter was $132.5 billion. It records the scale of future contractual revenue, and revenue recognition still depends on delivery and service availability conditions; it cannot be treated as a cash reserve already received.
In this third-quarter report, revenue is recognized when services are delivered, equipment costs are allocated over the usage period, and construction payments and debt service payments each have their own payment dates.
Welcome to join the official BlockBeats community:
Telegram Subscription Group: https://t.me/theblockbeats
Telegram Discussion Group: https://t.me/BlockBeats_App
Official Twitter Account: https://twitter.com/BlockBeatsAsia

 Related Articles