After CoreWeave's Revenue Doubles, AI Cloud's 'Scale Up Bill' Begins to Emerge

On August 11, AI cloud services provider CoreWeave released its second-quarter performance as of June 30. According to the unaudited performance press release provided by the company in an 8-K filing, quarterly revenue rose to $25.75 billion, a 112.5% year-over-year increase.
This easily condensed into a "strong demand for computing power" financial report. The company also disclosed on the same day that its backlog revenue stood at around $104 billion, with active power capacity at 1.5 gigawatts. Combining the income statement, cash flow statement, and power resources paints a much more complex picture. Revenue has been recognized, construction funds have been spent, and contracted power exceeds active power, both in different states of resourcing.
These three things do not happen simultaneously. The time lag between them is the true expanded account revealed in this financial report.
Doubling Revenue: Why Isn't Operating Profit Thickening in Sync?
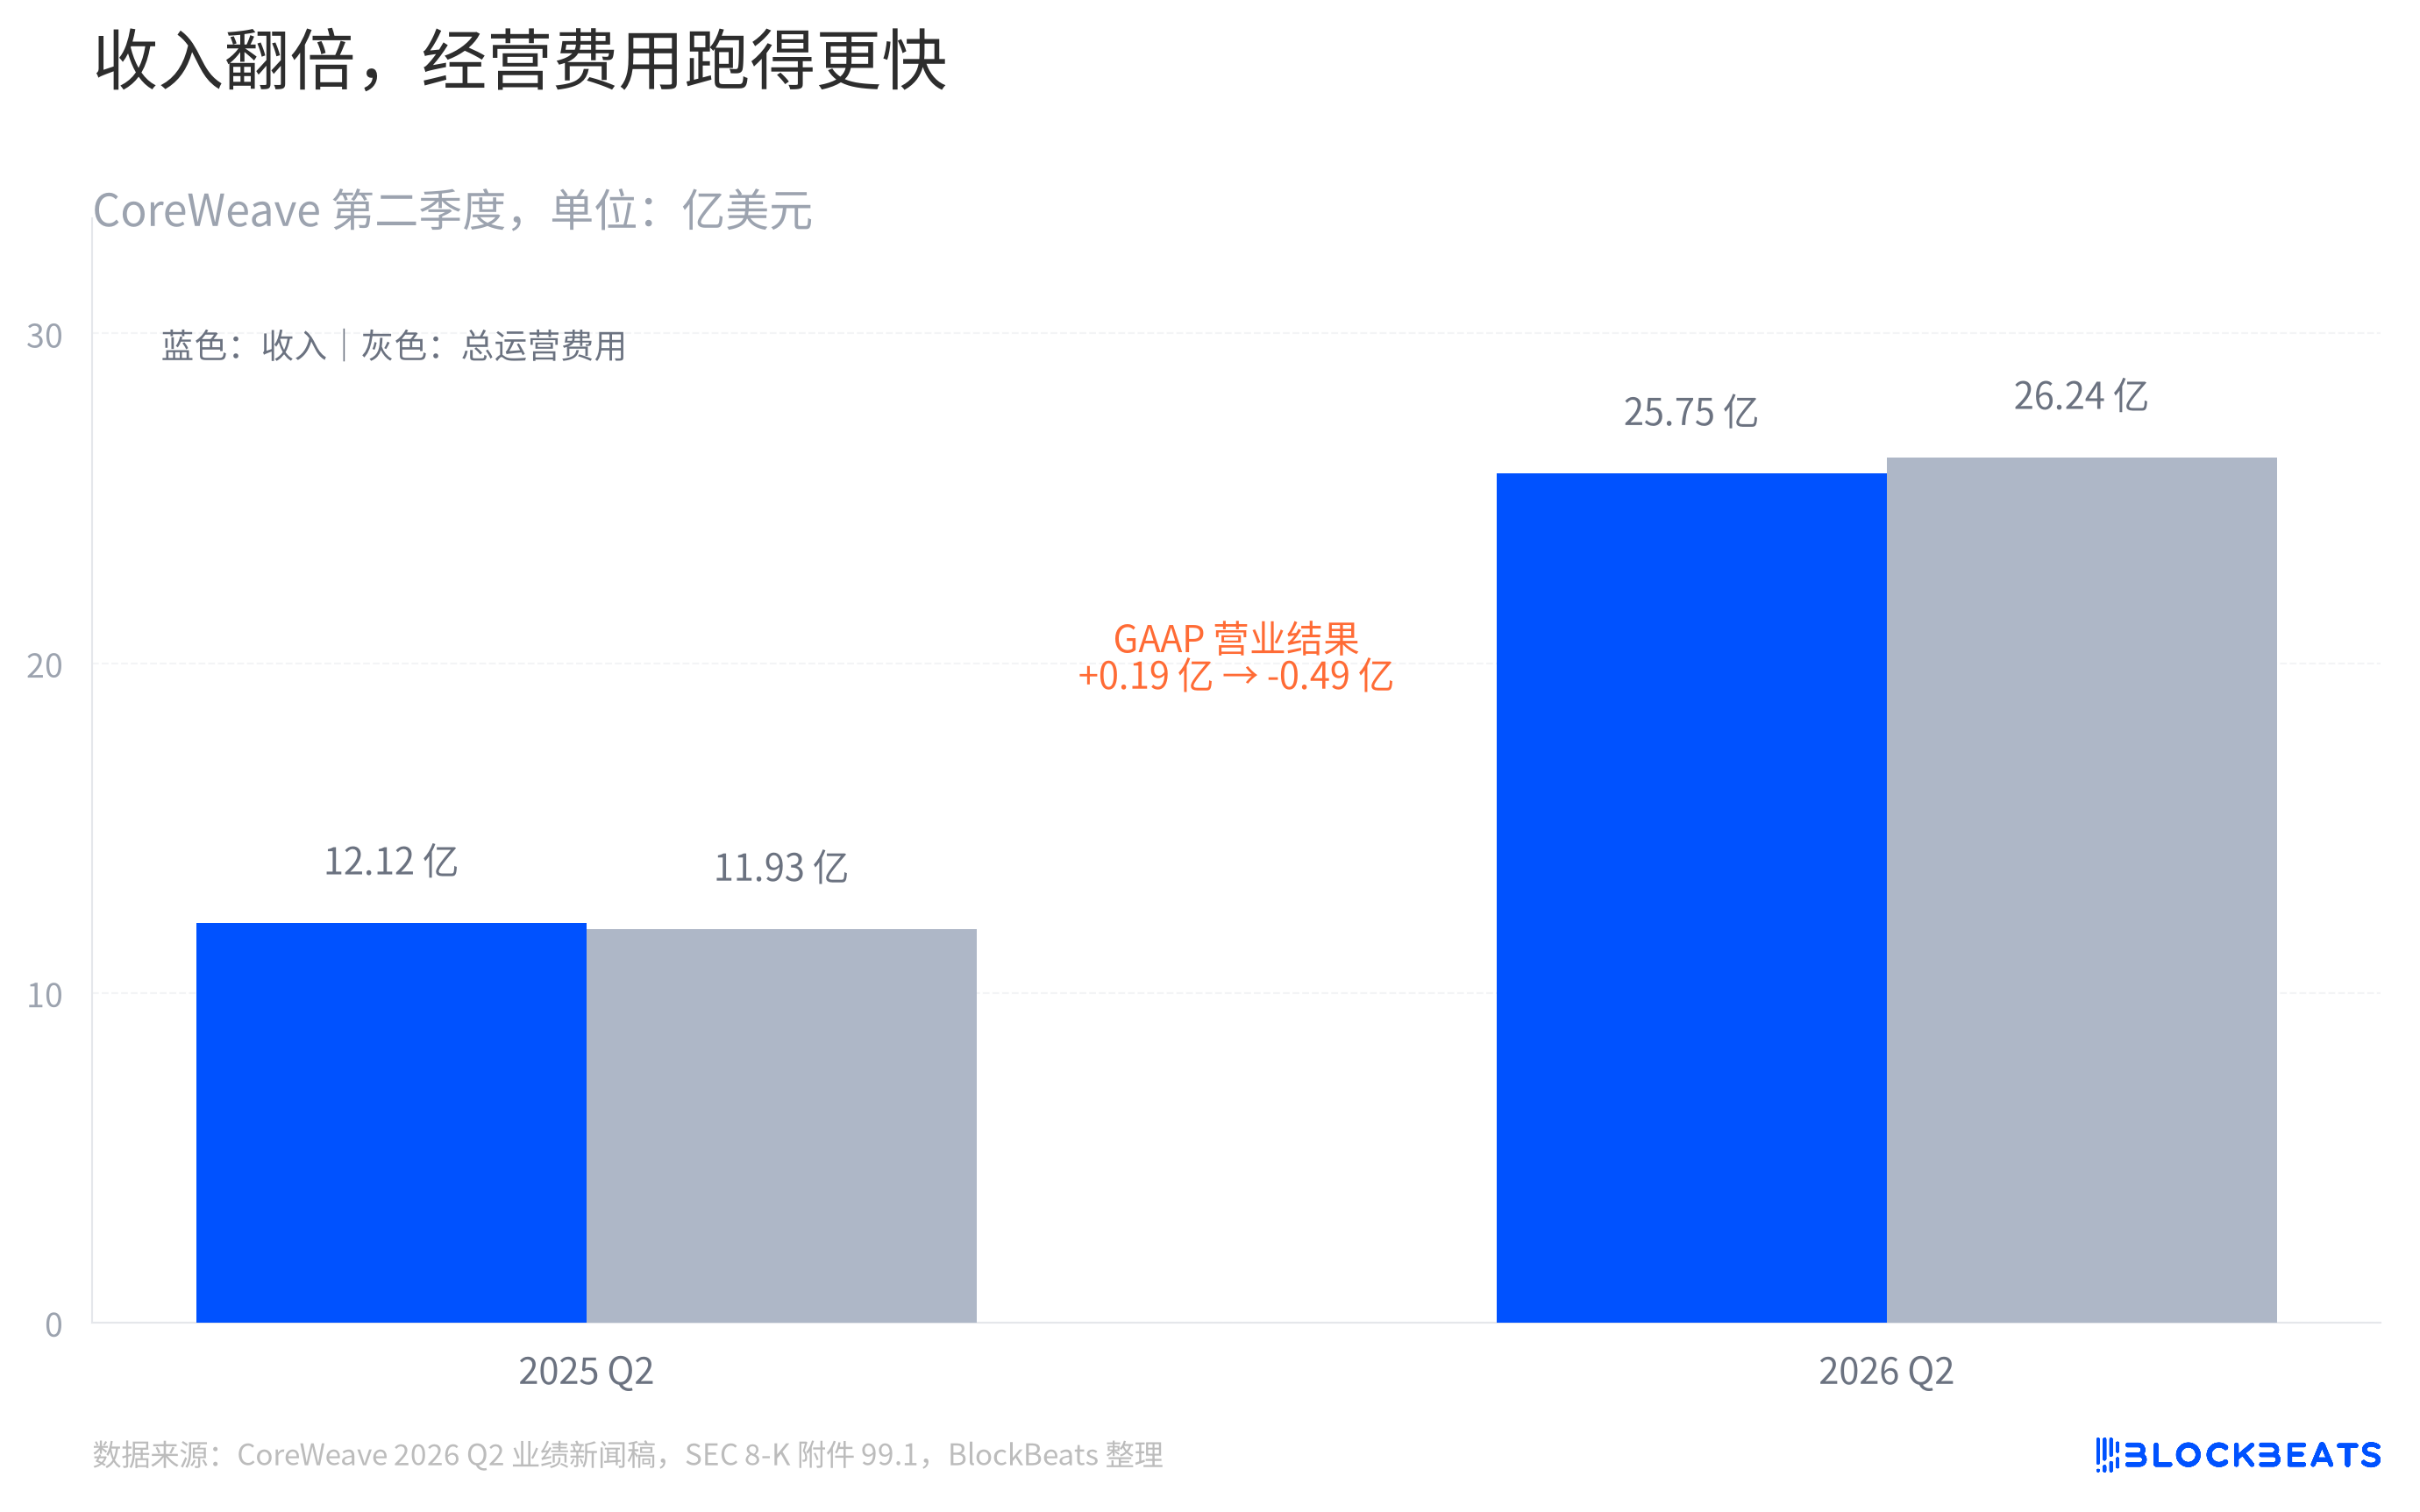
Let's first look at the first chart. CoreWeave's revenue column did spike significantly, but the total operating expenses column rose even higher. According to the company's performance press release, the quarterly GAAP operating income flipped from a $19 million profit in the same period last year to a $49 million loss.
In terms of net profit, CoreWeave has been operating at a loss for two quarters. The chart refers to GAAP operating income, which is closer to the core business, indicating that revenue growth has not yet translated into operating profit.
On the other end of the income statement, interest expense has also increased significantly. According to the company's performance press release, the second-quarter net interest expense was $640 million, a $373 million year-over-year increase. This is not the sole reason for the expanded net loss. Capital investments, financing interest, and revenue recognition from new capacity additions do not strictly align at the same point in time.
The company's disclosed adjusted EBITDA was $15.10 billion, with a profit margin of 59%. This is a non-GAAP metric defined by the company, suitable for observing its adjusted operational performance, but cannot replace the GAAP operating income in the chart. Only by comparing these two metrics side by side can we avoid misinterpreting "revenue growth" as profits keeping pace with construction speed.
Operational Cash Flow Exists, Where Is the Money for Construction Coming From?
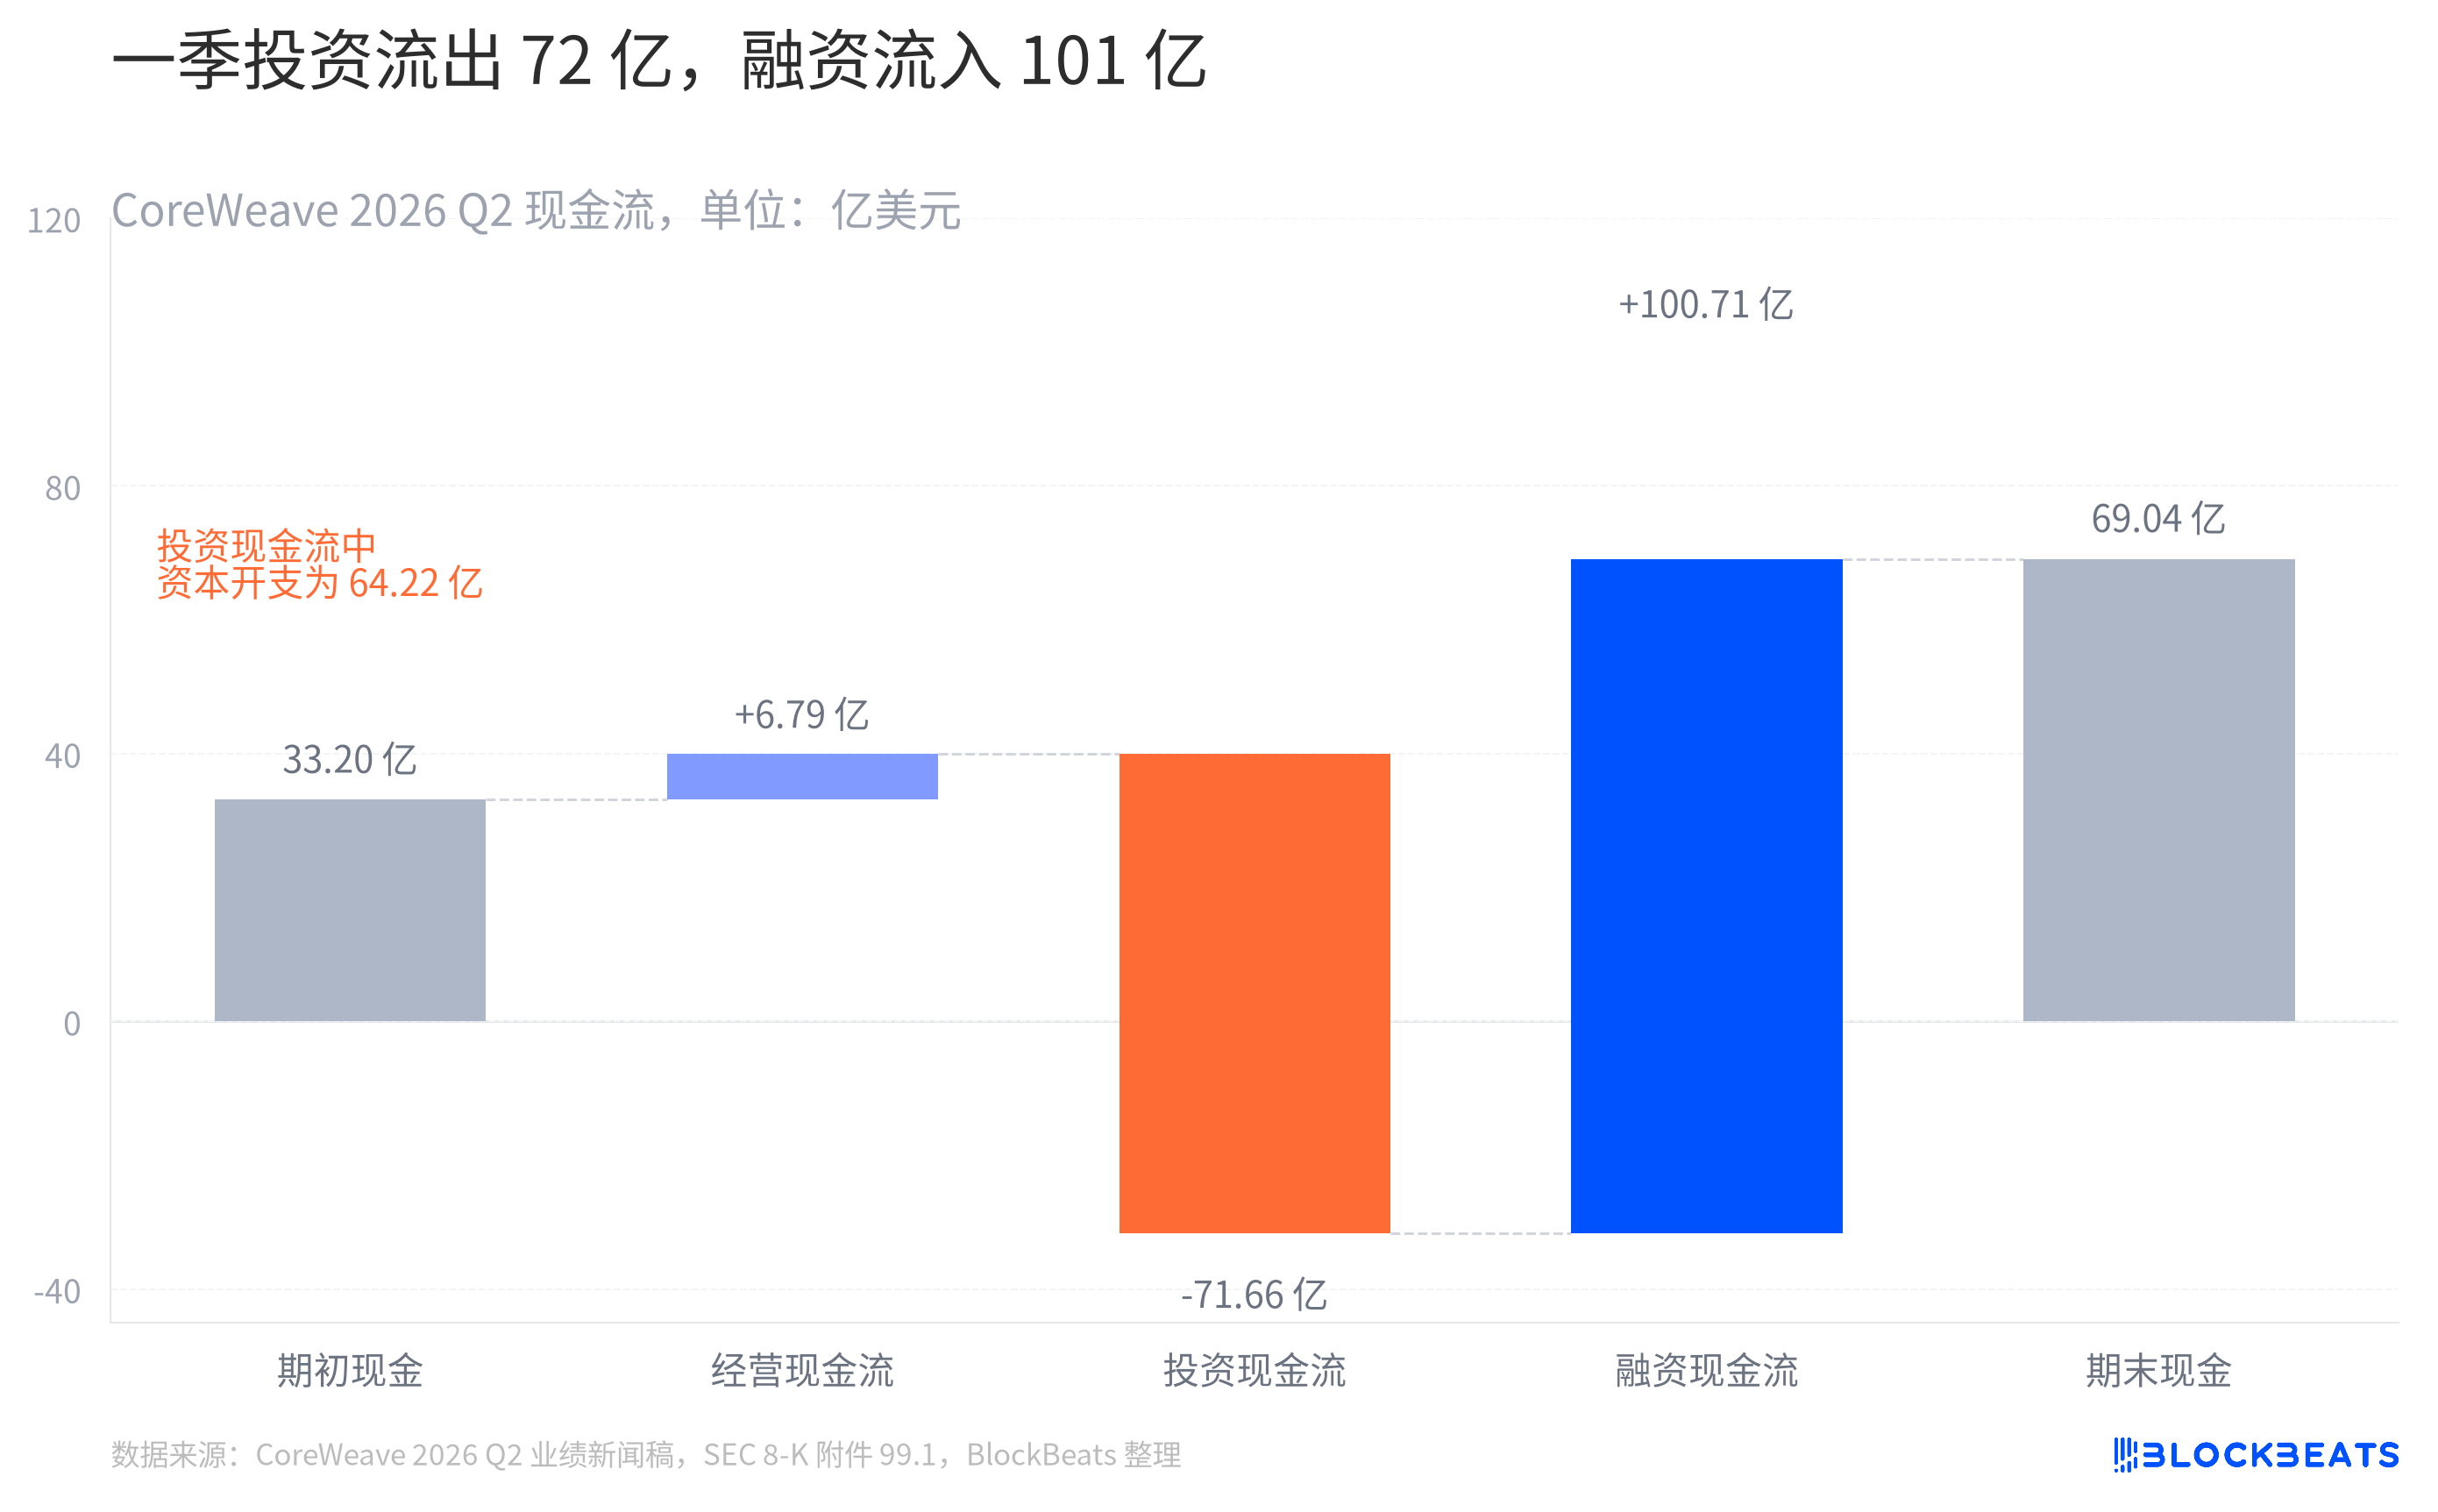
The second chart connects the dots. CoreWeave recorded a $679 million net cash inflow from operating activities in the second quarter. However, cash outflows for property, equipment, and capitalized internal software acquisitions amounted to $6.422 billion, approximately 9.5 times the operating cash flow for the quarter.
If we consider AI cloud as a marketplace for selling computing power, revenue corresponds to settled services. Capital expenditure is more like first building the marketplace, then fitting in power supply, cooling, and servers all at once. The former comes back as per customer usage, while the latter often requires a concentrated outlay at an earlier point in time.
Therefore, the thickest blue bar in the chart is not operating cash flow but rather net inflow from financing activities. This item amounts to $10.71 billion, higher than the $7.166 billion net outflow from investment activities in the quarter. According to the same cash flow statement, financing activities include debt issuance, debt repayment, private placement of common stock, and purchases of capped call options hedging convertible notes, among other items. It cannot be simply translated as "new borrowing," but suffices to indicate that external capital still accounts for a larger portion of the quarterly cash flow structure.
CoreWeave's outlook material also indicates that management expects capital expenditure for the third quarter to be between $11.5 billion and $13.5 billion. This is forward-looking guidance, not cash flow that has already occurred. Its purpose is to alert readers that the expenditure shown in this chart for the second quarter is not an isolated expense, as the company still plans to allocate a larger portion of its construction spending in the next quarter.
$104 billion Backlog Orders: Why Still Focus on Power
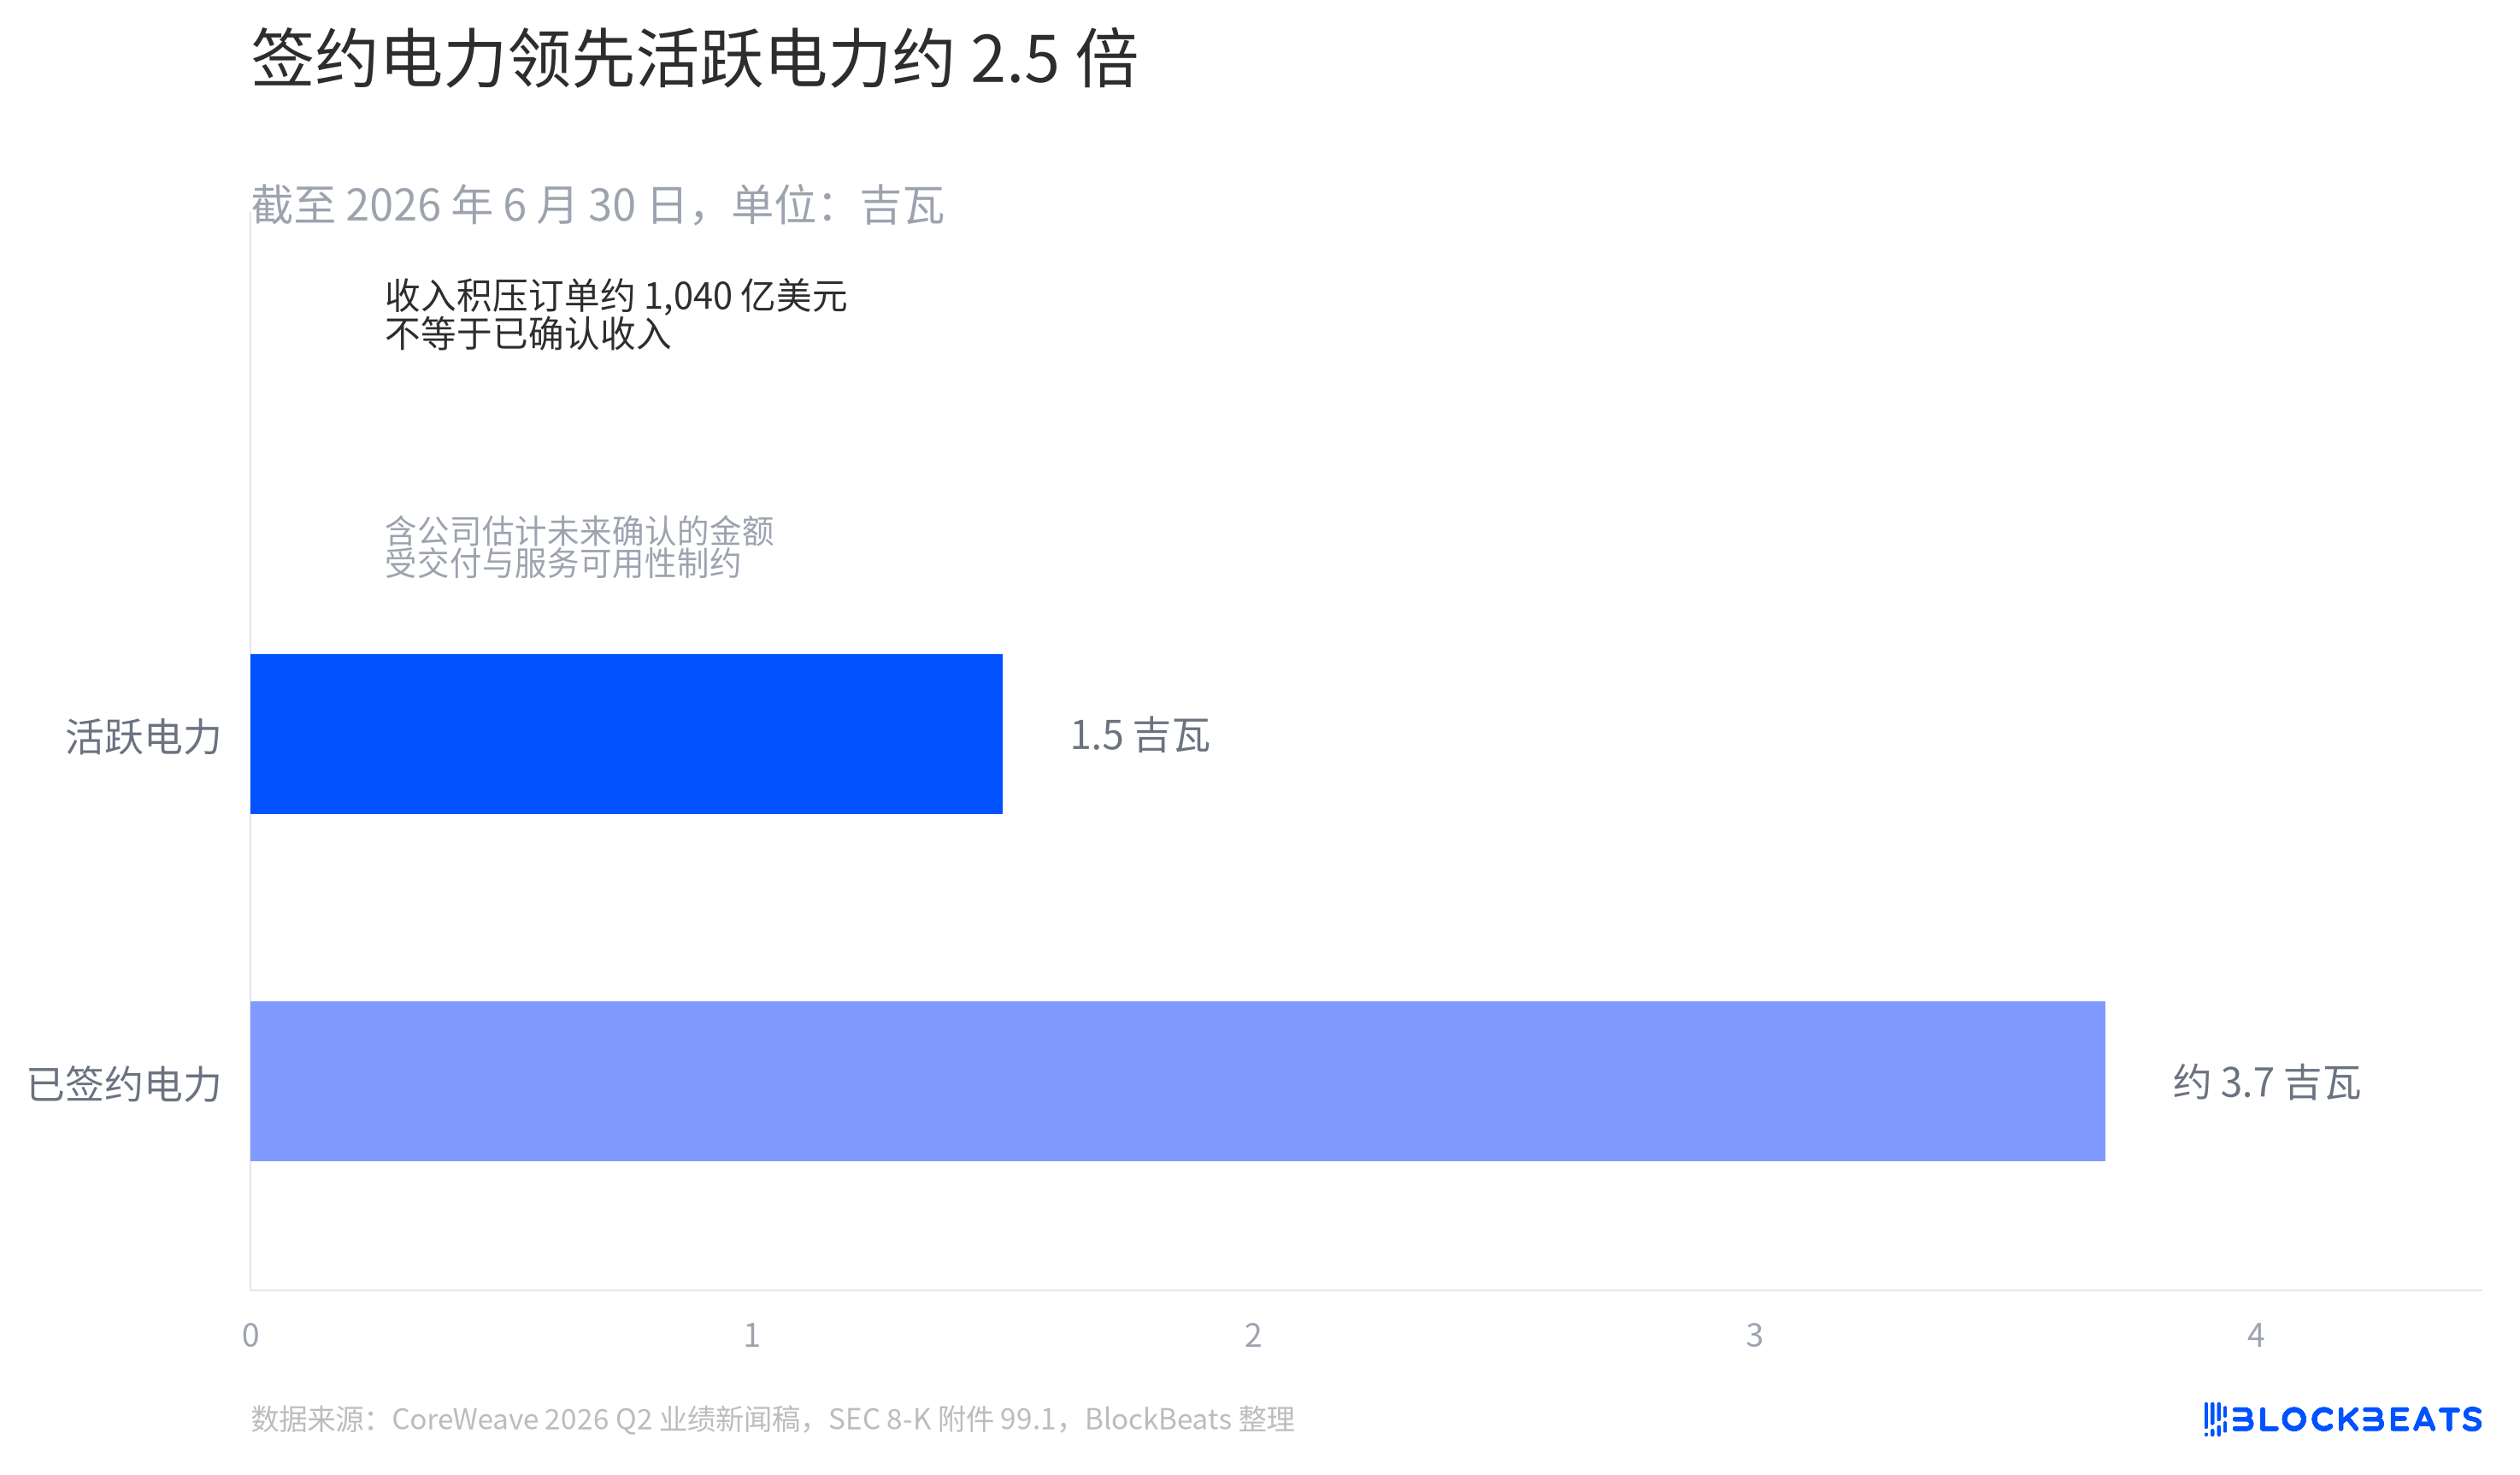
By the end of the second quarter, CoreWeave's active power was 1.5 gigawatts, with contracted power at around 3.7 gigawatts. The latter is about 2.5 times the former.
There are at least three different states here. Revenue is the amount for confirmed services. The revenue backlog orders mentioned by CoreWeave include remaining performance obligations and other amounts the company estimates will be recognized in the future. Contracted power is the committed resources, while active power represents resources already operational. Calling them all "demand" would overlook the most challenging part in between.
The $104 billion includes amounts subject to delivery and service availability constraints. According to the company's performance press release, this figure does not include over $25 billion in net customer commitments added early in the third quarter. It cannot be considered locked-in quarterly revenue, nor can it be straightforwardly converted into fixed revenue for a certain period.
The same logic applies to power. A 3.7-gigawatt contracted capacity does not mean all these resources are ready for delivery to customers, nor can specific launch dates or GPU counts be inferred from it. The gap between contracted and active capacities at least hints that resource commitments do not align with the current operational state.
In CoreWeave's second quarter, revenue is on the books, construction expenditures have been paid, and there is still a gap between contracted power and active power.
Welcome to join the official BlockBeats community:
Telegram Subscription Group: https://t.me/theblockbeats
Telegram Discussion Group: https://t.me/BlockBeats_App
Official Twitter Account: https://twitter.com/BlockBeatsAsia

 Related Articles