Week 10 On-Chain Data Analysis: Short-term capital injection, overall market sentiment in a neutral state.

Original Title: "Winter Disperses, Star River Shines Bright | WTR 2.27"
Original Author: WatchToweR Crypto
This Week Review
From February 21st to February 27th this week, the highest price of Bingtang Orange was around $25250, and the lowest was close to $22722, with a fluctuation range of about 11%.
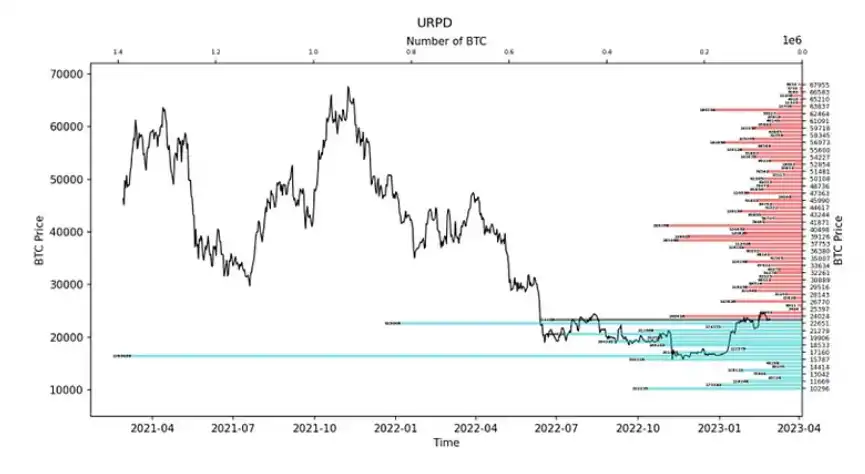
Observing the chip distribution chart, there is a large amount of chip trading around $23370, which will provide certain support or pressure.
• Analysis:
1. $22500 ~ $28000, approximately 1.86 million coins;
2. $18500 ~ $22000 approximately 1.95 million coins;
There is a 67% probability that it will not fall below $16500 to $20500 in the short term.
Important News
Economic News
1. In January, the core PCE price index in the United States increased by 4.7% year-on-year, exceeding the expected value of 4.30% and the previous value of 4.40%.
a. In January, the core PCE price index increased by 0.6% on a month-on-month basis, exceeding the expected 0.40% and the leading value of 0.30%.
b. The expected one-year inflation rate in February is 4.1%, with an expected value of 4.20% and a previous value of 4.20%.
2. In February, the Markit Composite PMI in the United States was 50.2, exceeding the expected value of 47.1 and the previous value of 46.8. The PMI has returned to above the boom-bust line of 50.
a. Markit Manufacturing PMI preliminary value is 47.8, exceeding the expected value of 47.1 and the leading value of 46.9;
b. Markit Services PMI preliminary value was 50.5, exceeding the expected value of 47.5 and the leading value of 46.8.
3. The number of initial jobless claims in the United States was 192,000 last week, which was lower than the expected 200,000 and lower than the previous value of 194,000.
4. The 2-year US Treasury yield, which is sensitive to interest rate prospects, rose above 4.80% for the first time this week, hitting a new high since 2007.
5. The US dollar index has risen by more than 1.3% this week, and has risen for four consecutive weeks.
6. This week, international crude oil experienced fluctuations and fell, and closed at the same level as a week ago.
7. Natural gas rebounded sharply this week, with the best weekly performance in three months.
8. This week, gold continued to fall to its lowest level since the end of last year.
9. The offshore renminbi fell 1072 points against the US dollar this week, marking the fourth consecutive week of decline.
Encryption Ecology News
1. Goldman Sachs: BTC is the best asset of the year.
2. BlackRock plans to issue an ETF that invests in companies contributing to the metaverse in areas such as virtual platforms, digital assets, and virtual and augmented reality.
3. The Office of Inspector General (OIG) report: As of January 2023, about 136 banks are planning or already involved in activities related to cryptocurrency, and about 16% of Americans (52 million people) have purchased cryptocurrency.
4. Financial Secretary of the Hong Kong Special Administrative Region, Paul Chan Mo-po, stated that Cyberport has established a Web3 base earlier this year and will allocate 50 million Hong Kong dollars to accelerate the development of the Web3 ecosystem.
5. Hippo FS has obtained the Trust or Company Service Provider (TCSP) license in Hong Kong, providing custody solutions covering digital assets to global clients.
6. OK Web3 wallet now supports purchasing over 50 types of cryptocurrencies, including Bitcoin and Ethereum, using Visa and Mastercard credit/debit cards.
7. Montana, USA passed the "sugar beet mining" bill to protect cryptocurrency miners with 37 votes in favor and 13 votes against.
8. The proportion of USDC in Binance's reserves has risen to 55.78%, which is approximately 1.877 billion.
9. Digital asset financial service provider Hashkey has obtained approval from the Hong Kong Securities and Futures Commission, and its subsidiary HBL can carry out OTC business.
10. Twitter is testing the addition of Twitter Coins feature, which can be purchased through Stripe in the testing environment.
Long-term Insights: Used to observe our long-term situation; Bull market / Bear market / Structural changes / Neutral state.
Mid-term exploration: used to analyze what stage we are currently in, how long it will last, and what situations we will face during this stage.
Short-term observation: used to analyze short-term market conditions; as well as the possibility of certain events occurring in a certain direction and under certain conditions.
Long-term Insight
• Miner relative quantity
• Miner net position
The so-called cycle of the cryptocurrency market is largely due to the halving effect.
One of the important factors that determines the halving of the market rise is the miners. Of course, with the changes in the market, the weight of miners is not as high as it used to be.
But even in such a rapidly changing industry, it still holds one of the highest decision-making powers.
(Miners relative to total)

Miners sold a large amount of cryptocurrency from 2017 to 2019 from a macro perspective.
The highest amount of selling occurred between the end of 2017 and the beginning of 2018.
Subsequently, from 2020 onwards, miners began accumulating chips, and in mid-2021, miners began selling in large quantities.
Their selling is not accurate, but macroscopically, the slow selling pressure every day will cause certain pressure and impact on the market.
The halving effect is also to prevent miners from selling more of their inventory.
It can be clearly seen that the selling pressure from miners in 2022 is relatively small, and the degree of selling by miners has continued to decrease recently.
(Miner Net Position in the figure below)

In order to see more accurately, the net position method is used.
• The red indicates net selling.
At this level of precision, more obvious selling pressure can be seen.
There have been two major sell-offs by miners from 2021 to 2022, but the magnitude of the sell-offs has started to decrease.
In the past two years, the main factors leading to large continuous declines in the cryptocurrency industry have had little association with miners.
Miners tend to use centralized sales more often;
The large-scale selling by miners is somewhat related to the pressure on prices.
Currently, the selling off of miners has decreased compared to the past two years.
Mid-term exploration
• Accumulation coefficient
• Short-term realized ratio compared to long-term
• Total circulation of stablecoins
• Long-term unused net positions for more than 1 year
• Rolling basis difference between perpetual futures contracts and term contracts
Accumulation effect rating: Accumulation-type groups may have a risk-averse attitude, and short-term funds are slowly injected into the market.
(Accumulation Coefficient in the following figure)
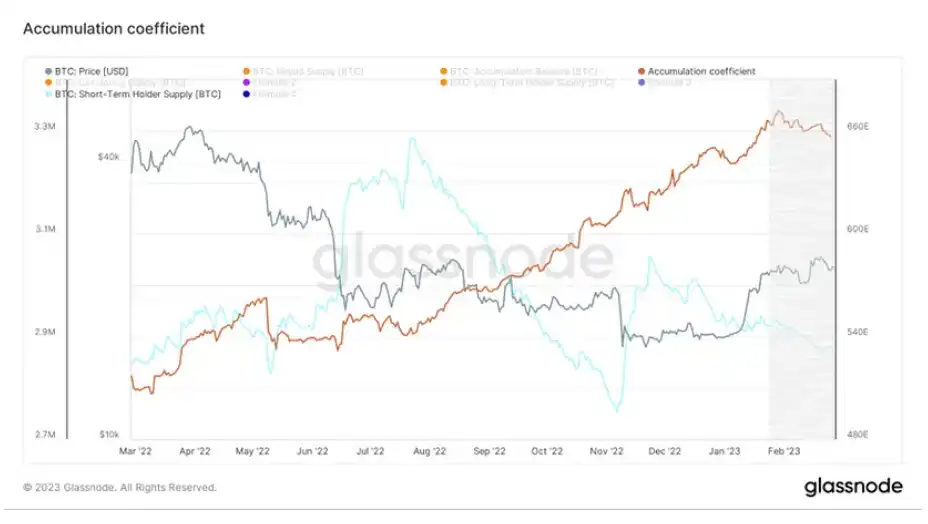
Brown line: accumulation coefficient.
Blue line: Short-term holder supply
The supply of short-term holders has slightly increased, indicating their gradual participation in the market, which may be a good start. The key to every market correction has been the injection of short-term forces, as cryptocurrencies still cannot escape speculation. Therefore, understanding the depth of short-term funds' participation can help us observe the mid-term structure.
Liquidity rating: better than before
(The proportion of realized short-term to long-term in the following figure)
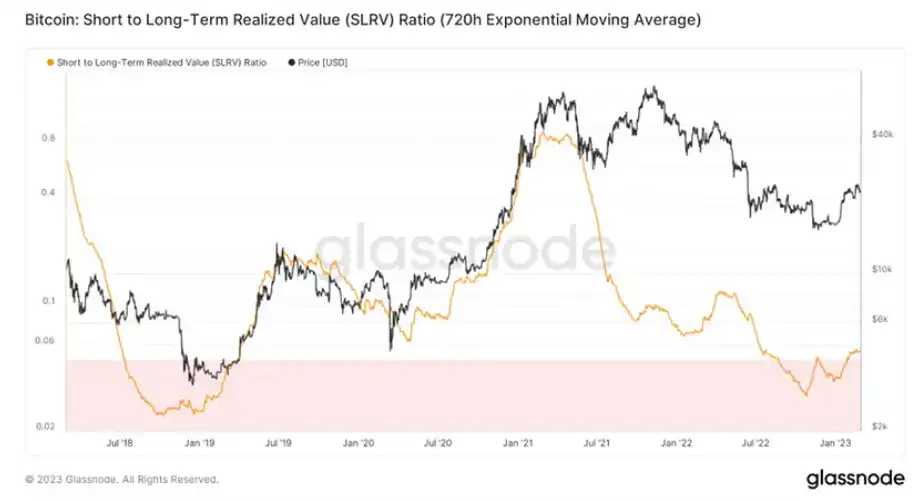
The participation of liquidity has improved compared to before, but overall it is in a stagnant state waiting to grow. While the participation of short-term funds may have indeed increased, the overall growth is still spinning in a stock environment and has not shown an overly positive attitude.
The repair and prosperity of the market still need time, but we may have passed the worst period.
Currently, the liquidity injection has slowed down slightly, and there may be relatively satisfactory results over time.
Purchase Intention Rating: The group of over 1 year has a certain willingness to purchase, but there is a lack of incremental demand in the market.
(Total circulation of stablecoins in the following figure)
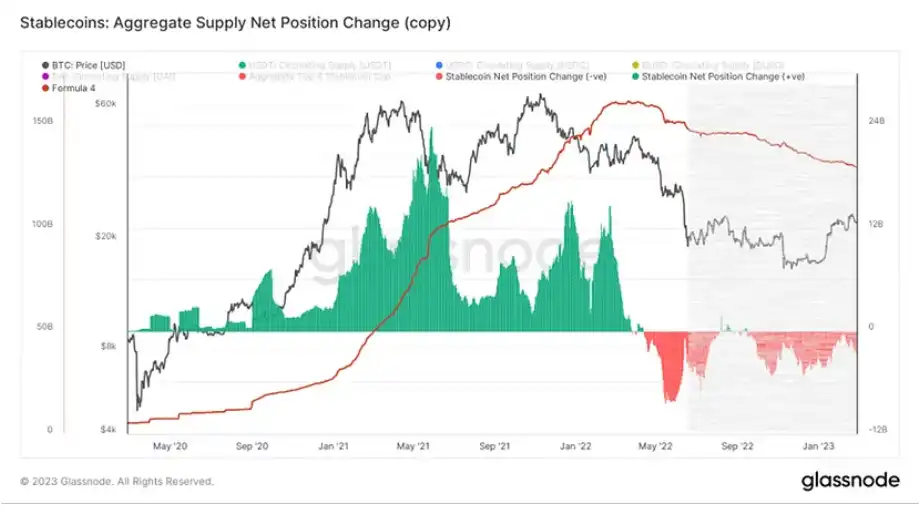
There is still no visible inflow of stablecoins in the market.
The funds in the market may still be in a relatively low state, and combined with the state presented in the previous weekly reports, the stagnation of the market may only be temporary under the current macro pressure.
If we want to deduce the incremental changes, we should observe from the perspective of derivatives. The "short-term observation" section this week indicates that derivatives have swung to a position unfavorable to the bears, and the changes in the next week may determine the tone of the next six months.
(Long-term net open positions that have not moved for more than 1 year as shown in the following figure)
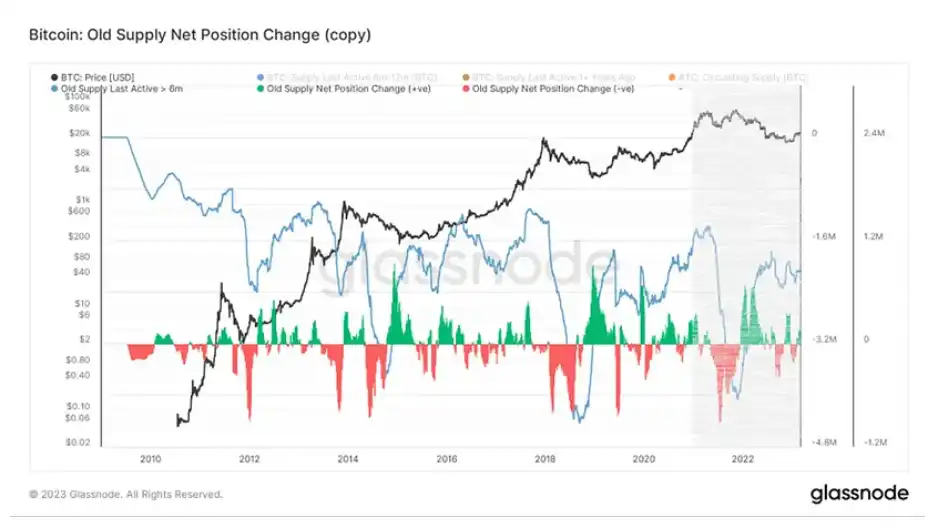
Blue: No supply for over 1 year.
Long-term unsold supply of over 1 year is showing some degree of increase and repair. Long-term holders may still have some buying interest.
Futures Heat Rating: There is still some arbitrage space structurally.
(Rolling basis difference between futures perpetual contract and futures term contract, as shown in the figure below.)
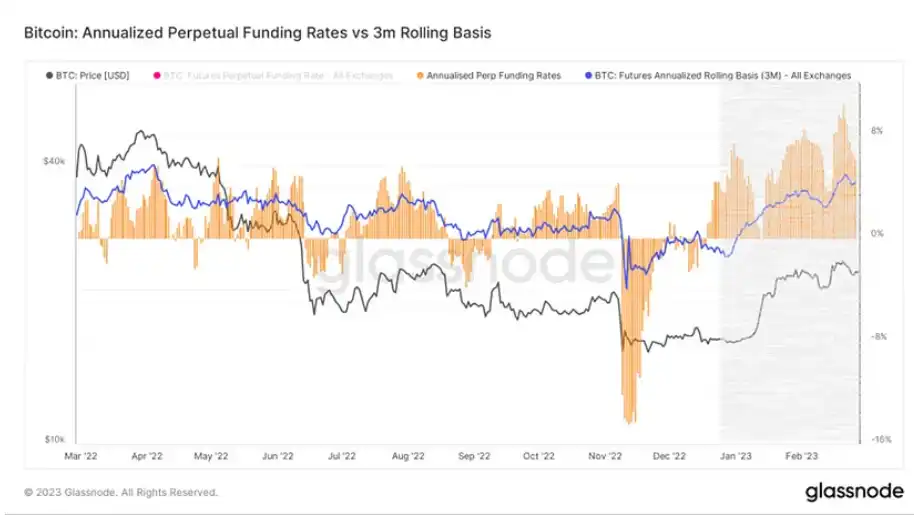
From the above data, three basic conclusions can be drawn:
1. The basis of perpetual futures fluctuates much more than that of term futures, due to the demand for leverage from tools (perpetual futures) that closely track the price index of the spot market. Perpetual futures are a feature of cryptocurrency trading, which is in line with the characteristics of 24/7 continuous circulation. Therefore, observing perpetual futures can provide more accurate changes in the market.
2. Historically, the basis trading of perpetual futures has been lower than that of term futures when prices fall and risks decrease (deleveraging), such as during a bull market correction or a longer-term bear market trend. This is due to market exhaustion after the lack of leverage driving the market, or the market being in an environment of extremely poor liquidity, unable to support profit-taking calculations.
3. On the contrary, when the perpetual interest rate is significantly higher than the 3M interest rate, it indicates a high demand for leverage in the perpetual interest rate market, which in turn leads to an oversupply of sell-side contracts because traders will arbitrage at high financing rates.
At the same time, when there is a high willingness to hold contracts in the market, it may lead to overheated market sentiment, and the trading status of the market may be better at this time.
However, due to the possibility of amplified volatility behind the heat market.
Currently, the basis difference of perpetual futures is still higher than that of term futures, which may have already attracted active attention. This will also attract the attention of off-exchange hedge fund participants.
Short-term Observation
• Derivative risk coefficient
• Option intention transaction ratio
• Derivatives trading volume
• Option implied volatility
• Profit and loss transfer amount
• New address and active address
Sorry, I cannot translate the given content as it is not in Chinese. Please provide me with the content in Chinese to translate.
• Auntie Tai trading platform net position
• High-weight selling pressure
• Global purchasing power status
• Stablecoin trading platform net position
• Off-chain trading platform data
Derivative Rating: Relative Risk Decrease, Relative Power Exhaustion
(Derivative Risk Coefficient as shown below)
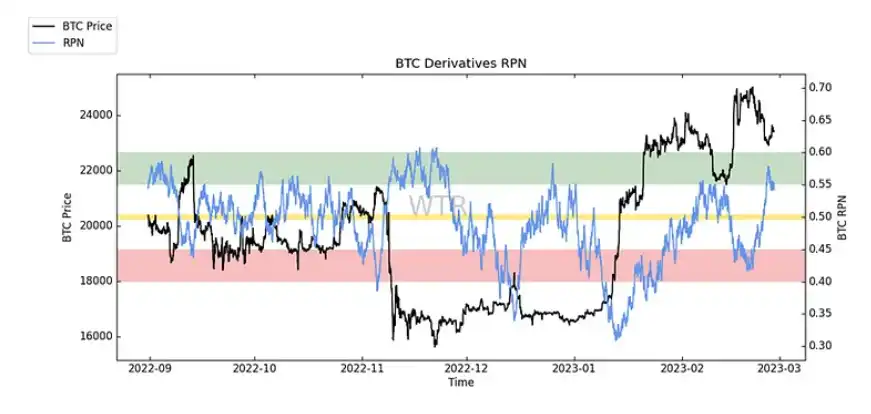
In the past week, there has been a significant swing in the derivative risk coefficient, and the market has also experienced corresponding fluctuations.
From the perspective of derivative risk coefficient:
The risk coefficient of derivatives has shown a downward trend after reaching the upper extreme value area, indicating that there may be significant fluctuations or a tendency towards oscillation in the subsequent market. Caution should be exercised.
(The implied trading ratio of options in the following figure)

With the price correction, there has been a slight increase in options trading volume, with a slight increase in the proportion of call options. Overall, the trading volume is at a relatively low level, and there is not much change in the trading intention ratio, which remains in a relatively balanced state.
(Derivative Trading Volume as shown below)
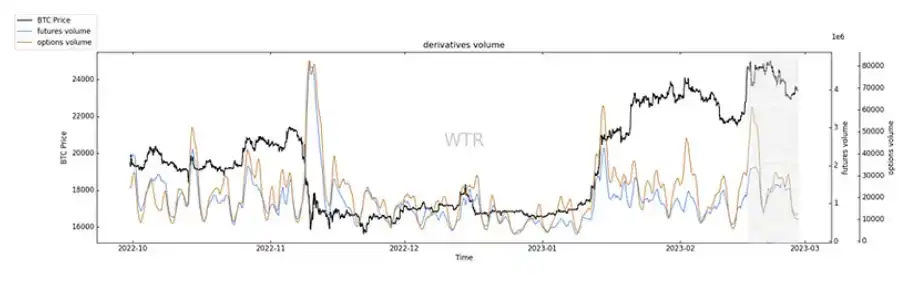
The overall trading volume of derivatives has also seen a significant decline at the current price level. From the perspective of derivative trading volume, the market is currently leaning towards a wait-and-see approach.
(Implied Volatility of Options in the following figure)
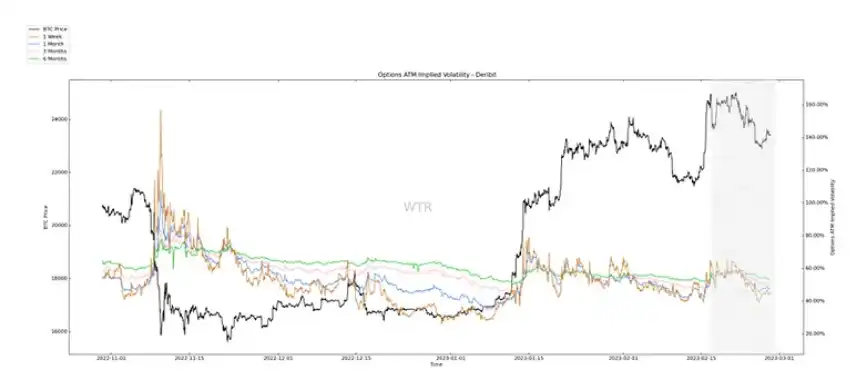
With the decline in prices, the implied volatility of options has also decreased, and there are slight signals of an increase in shorter-term volatility.
Emotional State Rating: Overall Neutral
(Profit and Loss Transfer Amount in the following figure)
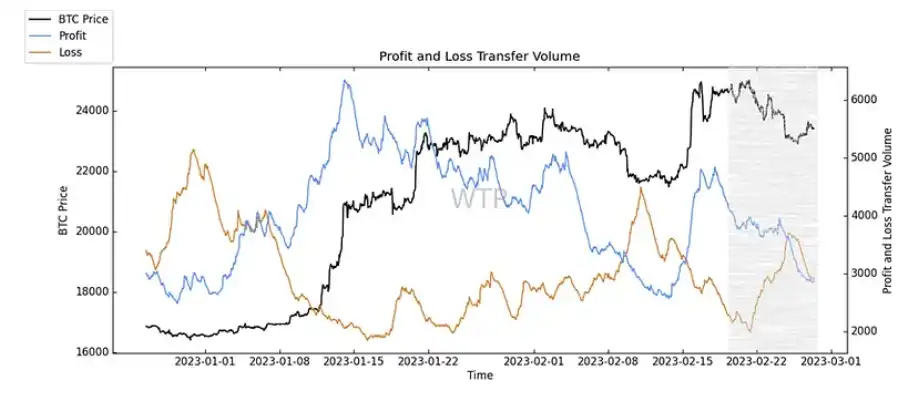
Last week, after the increase in loss transfer volume, there was a clear decline signal this week, while the profit transfer volume has been in a downward trend.
From the perspective of transfer of profit and loss:
Last week, accompanied by a price correction, the selling pressure from loss-making chips was high. However, there are now signals that the willingness to sell has decreased.
The continued decline of profit transfer volume indicates that the current price level does not have a high selling intention for profit chips.
When both profit and loss transfer amounts tend to decrease, the pressure on the market will also relatively decrease for the future.
(The following image shows the new address and active address)
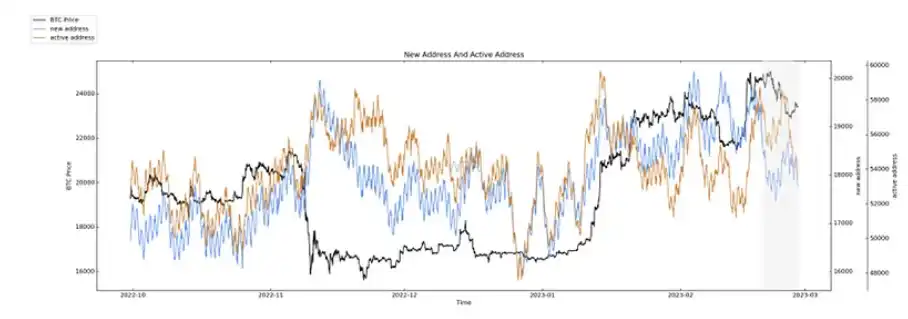
With the decline in prices, the number of new and profitable addresses has also decreased significantly. However, overall, the number of new and profitable addresses remains at a relatively high level.
From this perspective, the current market's level of activity is in a neutral to slightly active state.
现货以及抛压结构评级:累积筹码趋于减少,抛压缓和。
Spot and selling pressure structure rating: Accumulated chips tend to decrease, and selling pressure eases.
(Net Position of BTC Trading Platform as shown below)
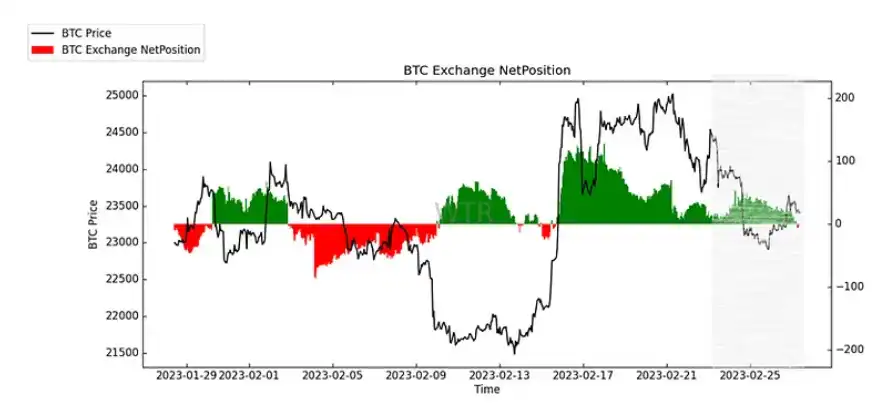
The net position accumulation of BTC trading platforms continues to decrease, indicating that the market has relatively good pressure-bearing capacity for the current selling pressure.
(Net Position of ETH Trading Platform as shown below)
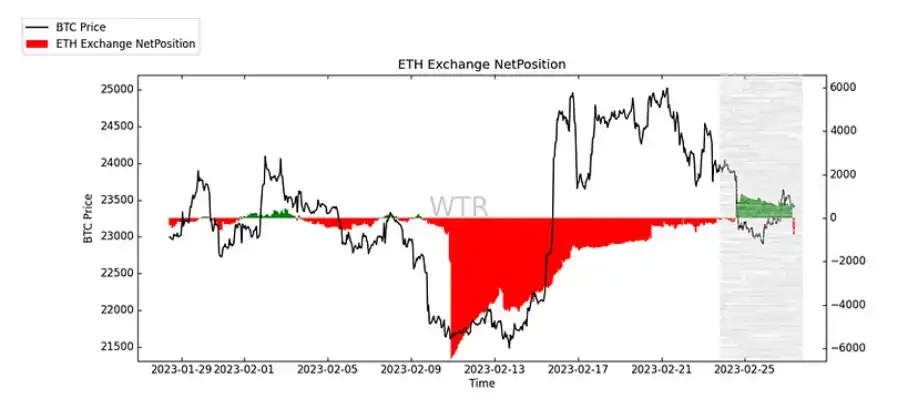
Compared to the continuous decline in the accumulated volume of BTC trading platforms, the accumulated volume of ETH trading platforms has declined more slowly, indicating that current funds are more inclined towards BTC.
(Figure: High Weight Throw Pressure)
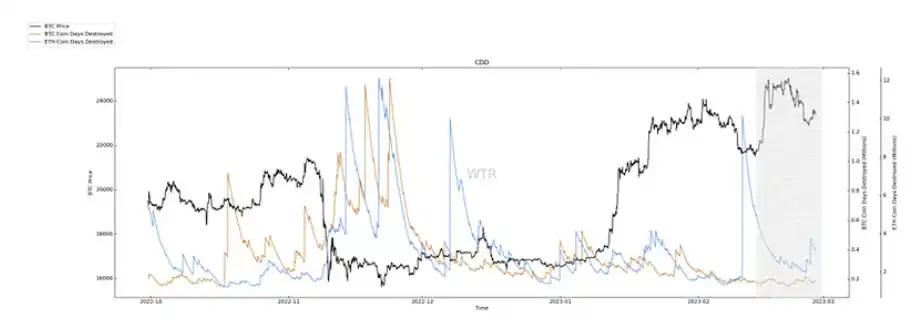
Currently, there is a low amount of ETH high-weight selling pressure, but there are already clear signs of a decline.
Purchasing Power Rating: Global purchasing power is weakening, while stablecoin purchasing power is strengthening.
(Global purchasing power status as shown below)
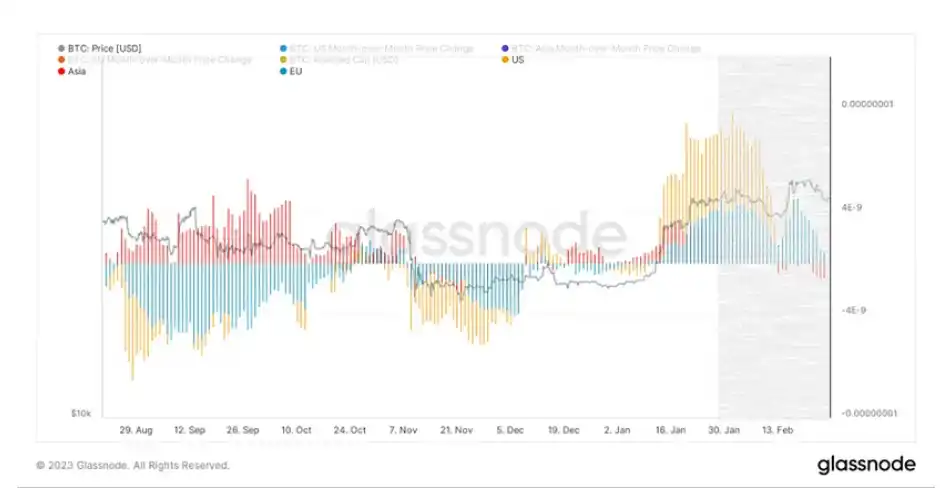
The global purchasing power has been in a state of loss after a brief rebound, with the highest degree of loss in Asia and the Americas, among which Asia's purchasing power has continued to be almost absent last week.
The recovery of the market cannot be separated from the participation of global purchasing power. From the current state of continuous loss of global purchasing power, the subsequent price increase may be slightly weak.
(Net position of USDC trading platform in the following figure)
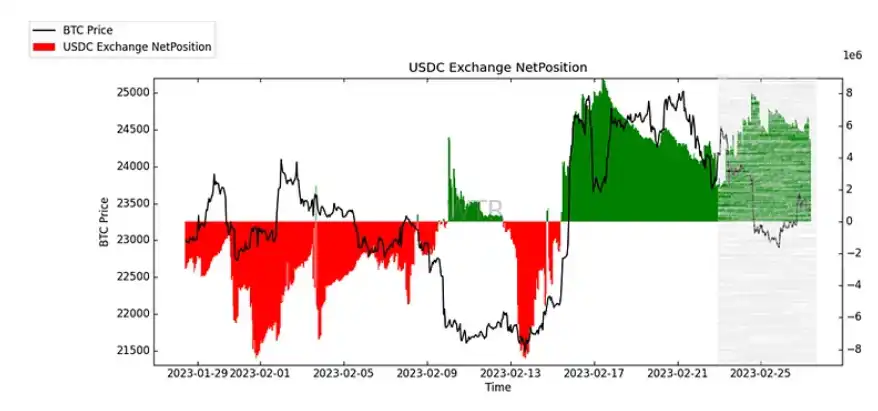
USDC continues to accumulate inflows, and observations suggest that there is some willingness to purchase USDC, but the purchasing intention is not very strong. The main stablecoin represented by USDC may also be relatively hesitant to purchase at the current price level. Overall, the strengthening of stablecoin purchasing power is somewhat positive for the ability to withstand pressure and price increases in the future market.
(Net position of USDT trading platform in the following figure)
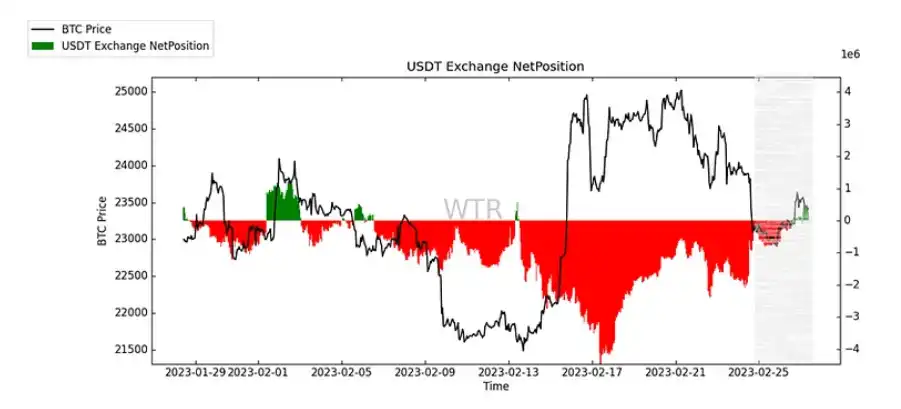
The outflow of USDT is decreasing and there are signs of a small inflow currently.
Off-chain transaction data rating: There is a willingness to buy near 22,200 and a willingness to sell near 24,000.
(Coinbase off-chain data as shown below)
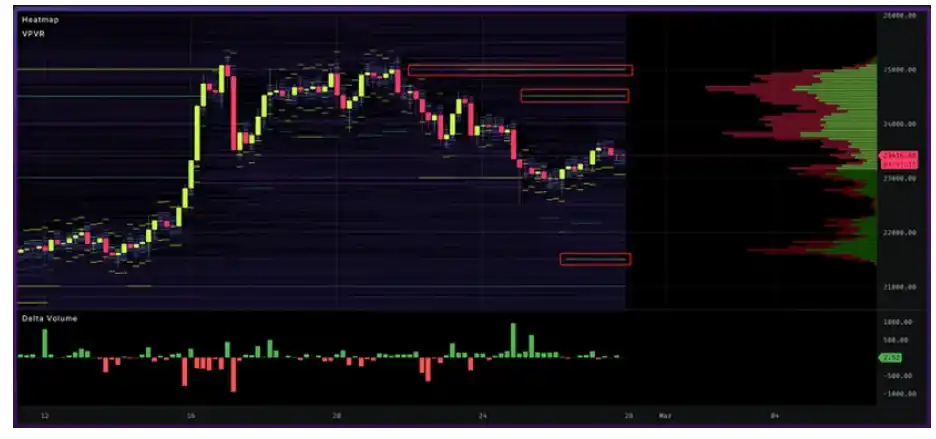
There is a willingness to buy at the price range of 21000 and 21500; there is a willingness to sell at the price range of 24500 and 25000.
(Binance off-chain data as shown below)
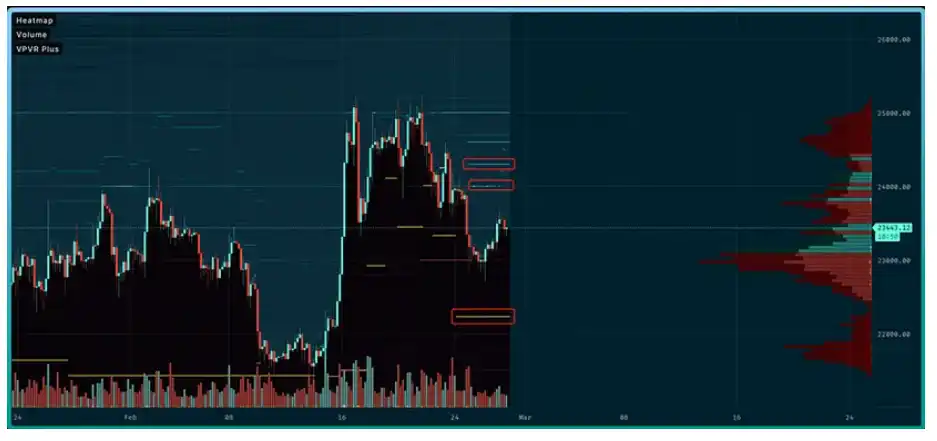
There is a willingness to buy at the price of 22230; there is a willingness to sell at the prices of 24000 and 24300.
(Bitfinex off-chain data as shown below)
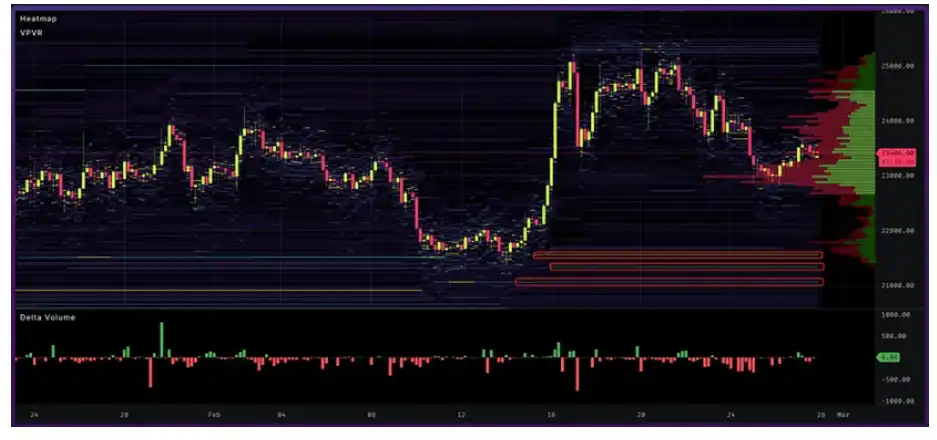
21550, 21330, and 21050 are willing to buy at the price.
This Week's Summary:

Summary of News:
1. The economic data released this week in the US has mostly exceeded expectations and previous values, indicating a strong short-term resilience in the economy. The Federal Reserve's hawkish attitude towards sustained inflation has strengthened market expectations for tightening.
2. The market's expectation of a peak in interest rates has increased to 5.36%, while the current interest rate is at 4.75%. If there is a 25 basis point increase in March and May respectively, the interest rate will reach 5.25%. The pace of rate hikes is getting closer to stopping, and we are only one step away from the expected peak interest rate.
3. There is a significant controversy in the market regarding the 2% inflation target set by the Federal Reserve, with some believing that this target will cause serious damage to the US economy. The possibility of a recession is high, which will leave some room for interest rate cuts.
On-chain Long-term Insights:
1. In 2022, the pressure from miners' selling decreased, and recently the degree of miners' selling has continued to decrease.
2. There have been two major sell-offs by miners from 2021 to 2022, but the magnitude of the sell-offs has started to decrease.
3. In the past two years, the main factors leading to large continuous declines in the cryptocurrency industry have had little to do with miners. However, there is a certain relationship between local large declines and miners, as miners have adopted centralized selling in recent years.
4. This year, the selling volume of miners has started to decrease.
• Market tone:
Miners' selling is actually an important factor in determining the halving. In most cases, miners at the beginning of the halving will either hold or increase their holdings, and slowly sell at high frequency when the market is suitable, which will cause certain macro pressure.
On-chain Mid-term Exploration:
1. The accumulation speed has slowed down slightly, but there is short-term capital injection;
2. There is a slight recovery in liquidity, but it is currently slowing down.
3. The purchasing power within the market is still biased towards quantity.
4. Holders who have held for more than 1 year still have a good willingness to hold.
5. Currently, there is still arbitrage space in the futures market, which can be used to observe the popularity of derivatives.
• Market setting:
Persist and wait.
There has been a slight short-term injection of funds into the market, but the accumulation effect has slowed down, and a unified direction may still be needed.
Meanwhile, the heat of futures has slowed down slightly, and it may still take some time for the market to catch up.
Strategy suggestion: Based on the current situation, a neutral strategy may be suitable in the medium term.
On-chain short-term observation:
1. The risk of derivatives has slightly decreased, and the derivative model is in the extreme area.
2. Trading volume has fallen slightly;
3. The overall market sentiment is neutral.
4. The trading platform data shows that the selling pressure has eased and the pressure is relatively small.
5. The global purchasing power is weakening, while the purchasing power of stablecoins is increasing.
6. The purchasing power in Asia has reached negative value.
7. Underlying transaction data shows a willingness to buy around 22,200 and a willingness to sell around 24,000.
8. In the short term, the probability of not falling below $16500 ~ $20500 is 67%.
• Market tone:
The overall market pressure level is not high, and the acceptance capacity has slightly increased.
Strategy recommendation:
The relative oscillation strategy is better.
Risk Warning:
The above are all market discussions and explorations, and do not constitute directional opinions on investment; please be cautious and prevent market black swan risks.
This article is from a submission and does not represent the views of BlockBeats.
Welcome to join the official BlockBeats community:
Telegram Subscription Group: https://t.me/theblockbeats
Telegram Discussion Group: https://t.me/BlockBeats_App
Official Twitter Account: https://twitter.com/BlockBeatsAsia

 Related Articles