Week 42 on the chain data analysis: short-term traders in a critical point of emotional state, incremental capital is still insufficient

Article title: Time whirling around | WTR 10.17
原文来源: WatchToweR 研究院
This week to review
This week, from October 10 to October 16, BTC reached a high near 19950 and a low near 18190, with a oscillation of about 9.06%.
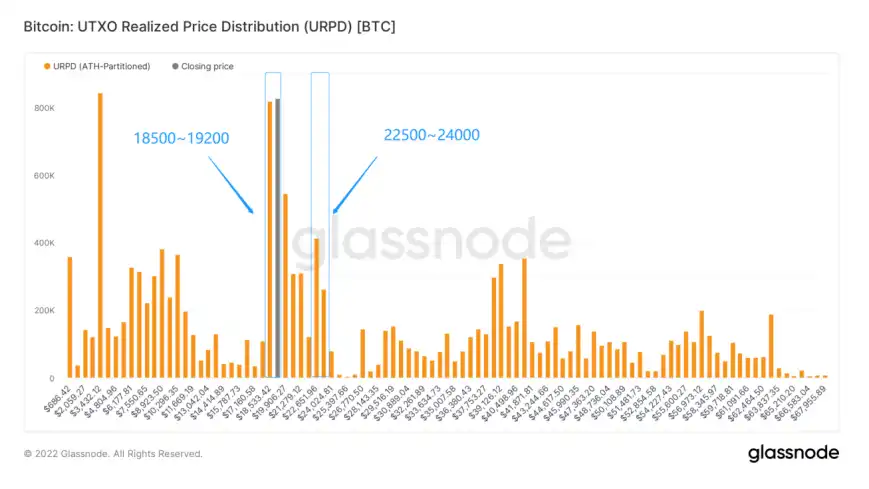
Observe the recent chip distribution map, in approx. 19200 near a large number of chips traded, there will be a certain amount of support or pressure.

• & have spent Analysis:
1. 18500~19200 About & have spent 1.6 million
2. 22500~24000 About & have spent 650000
• & have spent Keep at 17000~24000 Probability for & have spent 57%.
Important news
In economic news
• & have spent The United States
1. As the Federal Reserve continues to raise interest rates to control inflation, traditional big buyers of US debt are retreating en masse and the US debt market is in turmoil. The Treasury Total Return index is down about 13% this year, its worst annual performance since 1973.
2. This week the Fed provided the SNB with $6.27 billion in liquidity, the second dollar transfer to the SNB this month and the largest single dollar swap transfer in history.
3. Hedge funds are betting the dollar will rise against the Canadian dollar, the Japanese yen and the euro, according to Commodity Futures Trading Commission data. The dollar has climbed 18 per cent this year against a basket of six currencies.
a. Morgan warned that a stronger dollar could set the stage for the next market turmoil.
4. In September, the CPI rose 8.2% from a year earlier and 0.4% from a month earlier. Excluding volatile energy and food prices, the core CPI rose 6.6 per cent from a year earlier, accelerating from 6.3 per cent in August, while the core CPI rose 0.6 per cent from a month earlier.
a. Inflationary pressures are still accelerating and pressure is mounting on the Fed to continue to tighten monetary policy aggressively.
b. The two-year Treasury rose as high as 4.43 percent during the week.
• & have spent Asia
1. With 10-year government bonds yielding around 0.245 percent, foreign investors fled the Japanese bond market, selling 6.9 trillion yen ($43.9 billion) in September.
a. The e Bank of Japan continues to buy government bonds to control the yield curve, and now owns half of the total market.
2. This week, the Bank of Korea announced a 50 basis point increase in the seven-day repo rate to 3%, the first time the benchmark rate has reached 3% since October 2012, and the fifth time this year.
a. To stabilize the financial market, the government will launch a stock market stabilization fund, expand its corporate bond support program to 8 trillion won, and strengthen supervision over short selling.
• & have spent Britain
1. The Bank of England stepped in again to further expand its gilt buying operations and stood ready to buy as much as £10bn a day, with £5bn of conventional gilts and £5bn of index-linked gilts.
2. UK GDP shrank 0.3% month-on-month in August, while industrial output fell 5.2% year-on-year and 1.8% month-on-month, according to the Office for National Statistics.
a. Gilt yields briefly topped 5% this week.
Aspects of encrypted ecological messaging
1. NFT sales were $4.77 billion at the end of January 2022 and have declined every month since. It was just $549.82 million in September, indicating monthly NFT sales were more than 88% lower than in January. In addition, after reaching the highest score of 100 on Google Trends in January, the "NFT" search term scored 12 points in the last week of September.
2. Hackers used airdrop NFTS to direct users to click on fake Phantom update prompts to steal crypto assets.
3. JP Morgan's (JPM) private blockchain network Liink and Visa's (V) private blockchain network B2B Connect will use a new tool called "Confirm" to establish a connection between them. Confirm was launched by jpmorgan Chase and has been signed by Deutsche Bank.
4. Mena is the fastest growing crypto market in the world, with UAE seeing a 10-fold increase in a year, report says.
5. Google searches or supports searches for Ethereum addresses to display balances.
6. TRON has become Dominica's "national public chain" to achieve zero breakthrough in the blockchain industry.
7. STEPN began to reduce manpower expenditure for layoffs, mainly will eliminate more than 100 peripheral mods, ambassadors and so on. It is also focusing more on its parent company, Find Satoshi Lab, and less on STEPN overall.
8. Konami, a leading game company, has posted job openings in the metaverse and plans to launch an in-game NFT trading platform.
9. Uniswap Labs has closed a $165 million funding round at a $1.66 billion valuation.
10. USDC's market value fell to $45 billion, down more than $5.8 billion in the past 30 days.
11. The total market value of CryptoPunks series NFT is 821,480.14 ETH, the average daily trading volume is 712.98 ETH, the seven-day trading volume rose by 162.12%; The floor price is 65.99 ETH and the total number of NFT-holding addresses is 3,619.
12. Osmosis third quarter TVL growth 37.9% quarter-on-quarter, trading volume due to Terra thunder and sharply more than 70%.
Long-term insight: used to observe our circumstances over time; Bull/bear/structural change/neutral state
Mid-term exploration: To analyze what stage we are in, how long will it last, and what will happen to us
Short-term observation: used to analyze short-term market conditions; And the possibility of certain directions and certain conditions
Long-term insight
• & have spent Accumulation of participants over half a year
• & have spent Profit selling pressure and stampede conditions
(below & have spent Accumulation of participants over half a year)

More than half a year participants have accumulated more than 80% of the total market chips.
Second only to the situation at the end of 2015, and higher than the overall accumulation of conditions at the beginning of 2019.
It can be seen from this point, even if the external environment is extremely bad and complex, but relatively long-term crypto funds did not appear serious outflow, but more than half a year participants are still actively accumulating;
In the market to form a deflationary squeeze to lay a certain basis for the moment.
(Figure below shows the situation of profit selling pressure and stampede)
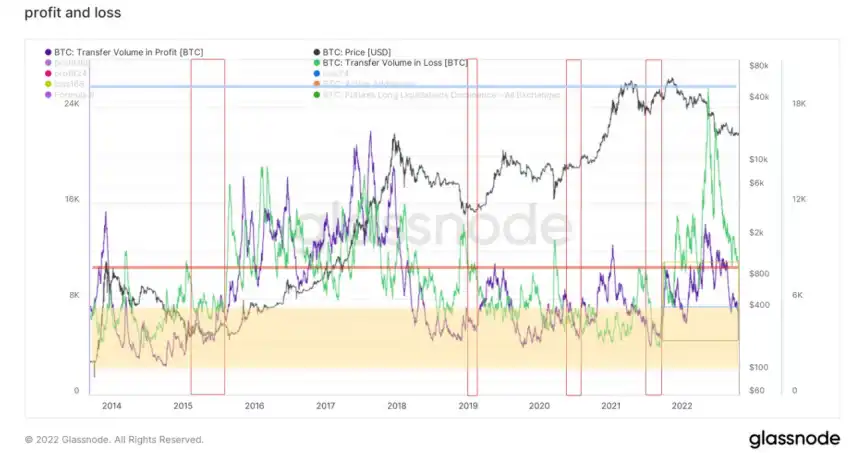
• & have spent Green: stampede throw pressure
• & have spent Purple: Earnings shock
The earnings shock has reached a relatively low stage in 8 years, but the stampede selling pressure is still in a relatively neutral position.
Compare that to July 2021, when the earnings shock and stampede selling pressure both reached historic lows.
It is worth noting that in the middle of this year, the stampede dumping pressure reached an all-time high. In the extreme external market environment, the stampede dumping pressure reached an unprecedented extreme.
For now, it may take some time to moderate and cool down.
Metaphase exploration
• & have spent Cost base group
• & have spent Net position on stablecoin exchanges
• & have spent The whole network did not achieve profit and loss ratio
• & have spent The total number of transitions in the chain
• & have spent Non-zero balance address change
• & have spent Accumulation trend score
• & have spent BTC trend net position
Overall holding cost change rating: Short-term participants have lower holding costs than long-term participants
(Figure below cost base group)

• & have spent Blue-purple line: Average holding cost for long-term participants
• & have spent Orange line: average holding cost for short-term participants
• & have spent Dark blue line: short to long term realized value
• & have spent Purple area: short term participant cost < long term participant cost
1. Typically, long-term participants represent the group in the market with a longer holding time and lower willingness to sell, and the macro on-chain significance of this group is one of the main references used to observe the BTC supply crunch.
a. The tight availability of BTC will reduce the amount of BTC sold in the market, thus reducing the upward pressure on the market.
2. However, deflation only represents a reduction in selling pressure in the macro sense, and the strength of liquidity should be considered when observing the market.
a. As indicated in the above figure, the purple area is the interval where the cost of short-term participants < the cost of long-term participants, which may also represent the weak willingness of current short-term participants to trade upward, thus leading to the continuous decline of the buying cost.
3. At the same time, a lack of enthusiasm for trading by short-term participants may indicate a weak supply of current liquidity, which may also lead to a lack of liquidity impetus in the market.
4. Model feature capture: can be used to observe liquidity turning points.
a. When the market moves out of the purple zone, when short-term costs are higher than long-term costs, the dark blue line may show a liquidity inflection point, when "structural" buying by short-term traders shifts the structure of the market, which may signal a shift to the right.
(Chart below Stablecoin exchange net position)
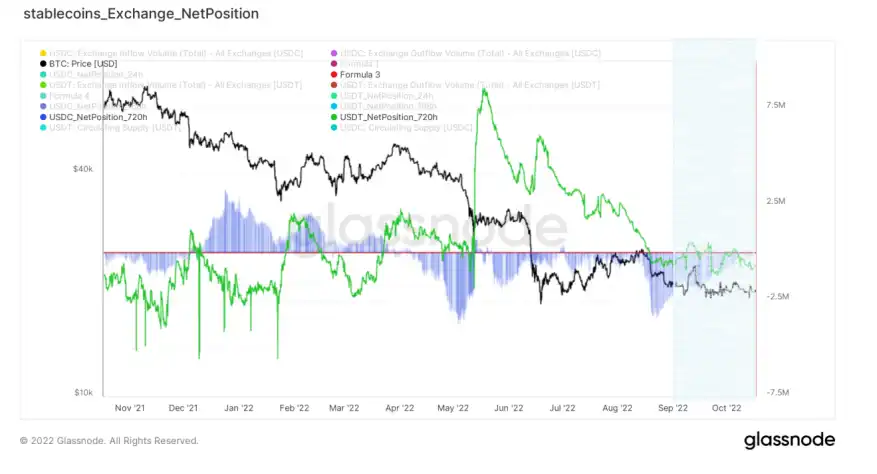
• & have spent Blue line: USDC net position
• & have spent Green line: USDT net position
The net USDC position shows that outflows have moderated a bit, but overall inflows are low;
Net USDT positions show a mild outflow from the exchange.
Overall purchasing power supply is not out of a clear trend.
Profit and loss structure rating: the whole network is in the average weak loss stage, the chain activity is low
(Figure below: the whole network does not realize the profit and loss ratio)
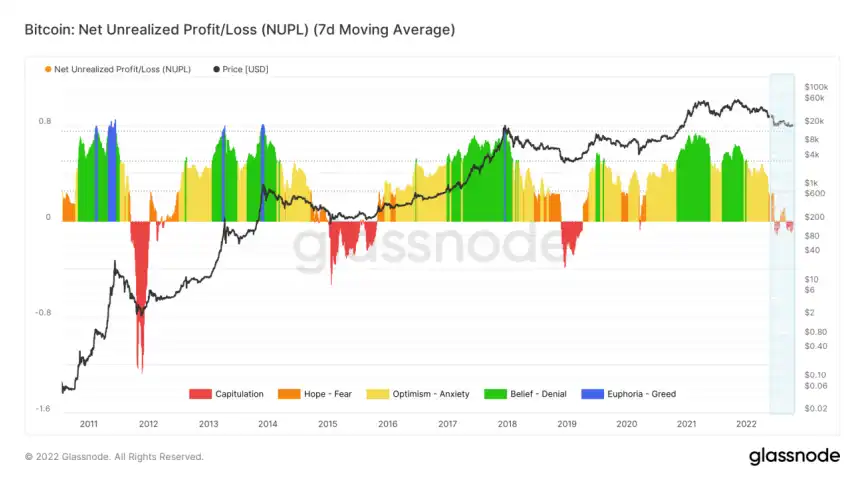
From the structure of the unrealized profit and loss ratio of the whole network, the unrealized profit and loss ratio hovers between 0 and -0.1, and the market participants are in the stage of average weak floating and loss. It is possible that the weak floating state will make the mood of market participants slightly confused, as well as the caution involved.
Combined with the net position of stablecoin exchanges, it is possible that the current incremental group participation is less enthusiastic, which could return the price movement of BTC to bearish sentiment.
(Figure below: Total transfer volume on the chain)
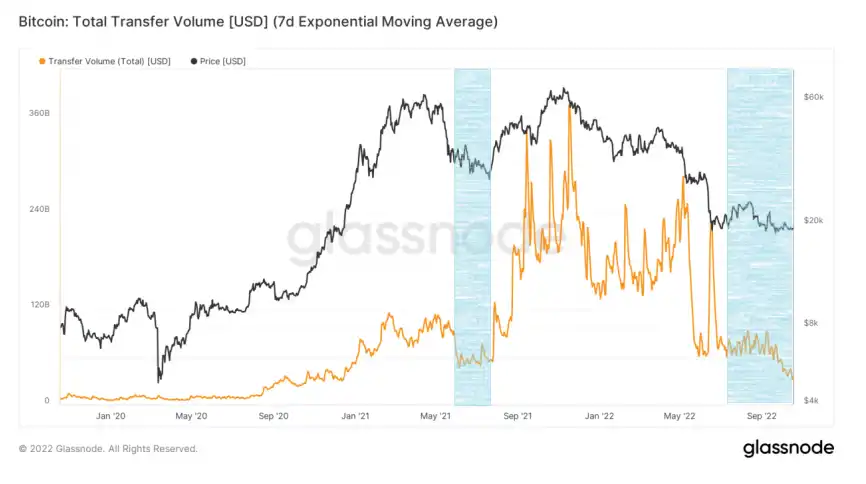
The overall transfer volume on the chain is declining, the heat of market participants may be biased to cool, wait and see in the process.
The current on-chain transfer volume is close to the status of May-July 2021.
On-chain growth rating: The market may be in a state of accumulation and construction
(Non-zero balance address change below)

Non-zero balance address changes can see a slight increase in wallet addresses.
Observed from the slope change, the growth of non-zero balance address is still hovering, perhaps the market is in a state of construction.
(Chart below accumulation trend score)
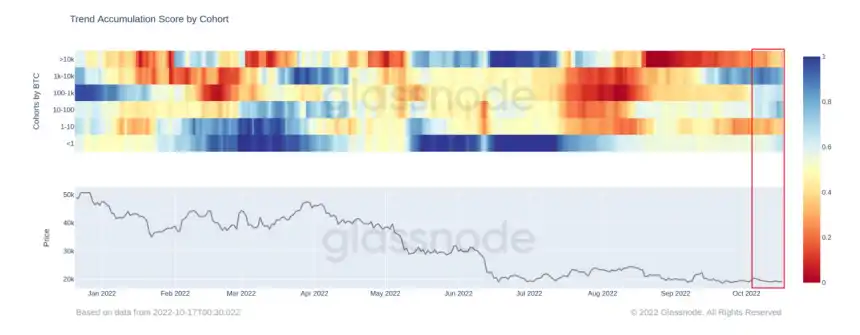
In a weak growth environment, the internal stock still has a good accumulation.
At present, except for "1-10" and "> 10k" addresses, all other addresses show a certain degree of accumulation, with the average score of accumulation reaching above 0.6.
(Chart below shows BTC Exchange trend net position)
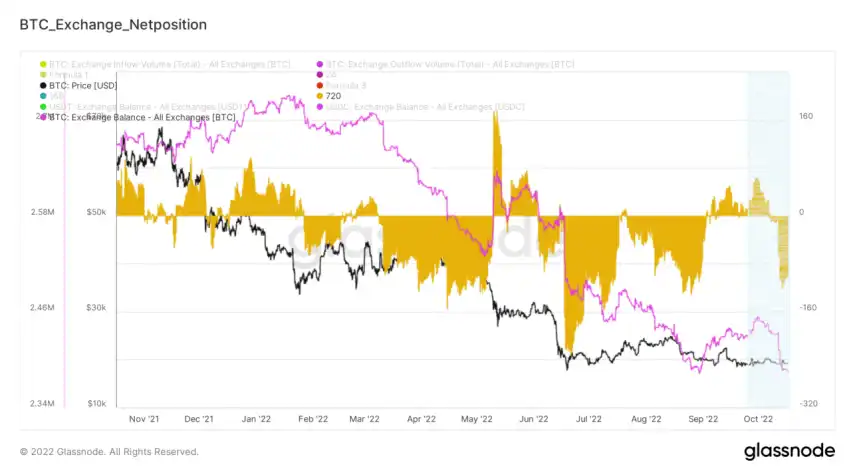
The BTC Exchange trend net position shows that the current BTC outflow status is somewhat slower, which may allow the accumulation time to be longer.
Short-term observation
• & have spent BTC long liquidation advantage
• & have spent ETH multi-position clearing advantage
• & have spent Options daily trading volume, futures daily trading volume
• & have spent Net unrealized profit/loss ratio for short-term holders
• & have spent Short - term holders profit and loss ratio
• & have spent Turnover of profit and loss
• & have spent Global time zone purchasing power
• & have spent Stablecoin exchange balance
• & have spent Under the chain data
Derivatives market rating: BTC medium low risk, ETH relatively high volatility
(Figure below: BTC long liquidation advantage)
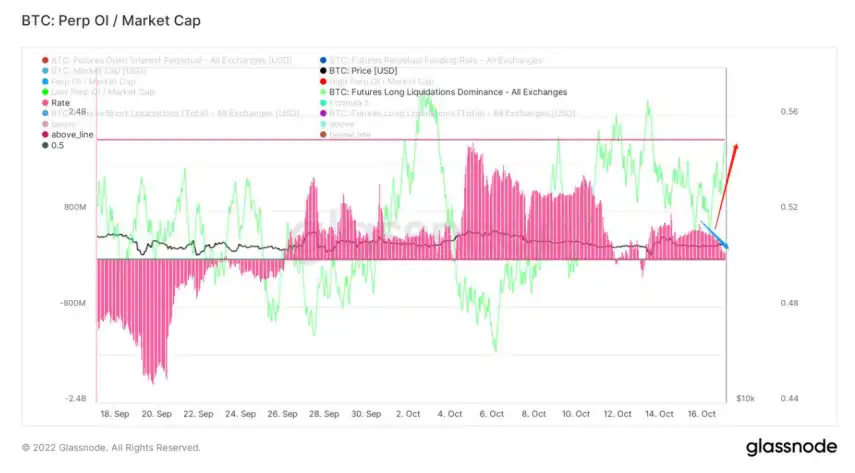
Long liquidation advantage close to the high warning line, derivatives market sentiment close to the other end, short - term domestic demand to pay attention to volatility.
The change rate of the comprehensive futures open interest, the recent increase of derivatives is low, and the relative leverage risk is neutral.
(Figure below ETH long clearing advantage)

Ethereum's long clearing advantage rises after approaching 50%, which represents a rise in short power and becomes weak near parity.
The change rate of futures open interest is still at a high level, the relative leverage is high, and the volatility of Ethereum needs to be kept alert.
(The following figure shows daily trading volume of options and futures.)

Blue: option volume
Red: futures volume
When derivatives volumes are all near low levels, sentiment is close to the tail, and when volumes rise again, sentiment shifts amplify the impact on the market.
The spot market
Status rating: Critical point
(Chart below shows net unrealized profit/loss ratio for short-term holders)
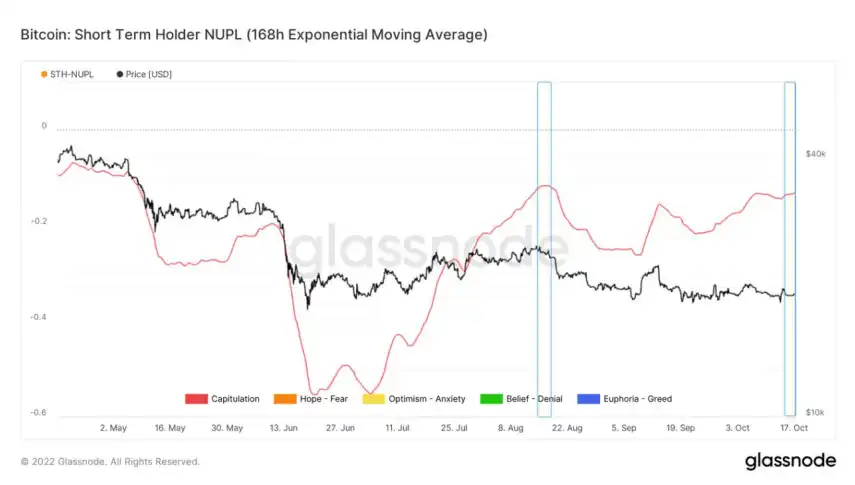
The mood of short-term holders is currently rising close to the level of mid-August, and attention should be paid to whether the sentiment tipping point can be breached.
(Figure below: Profit and loss ratio of short-term holders)
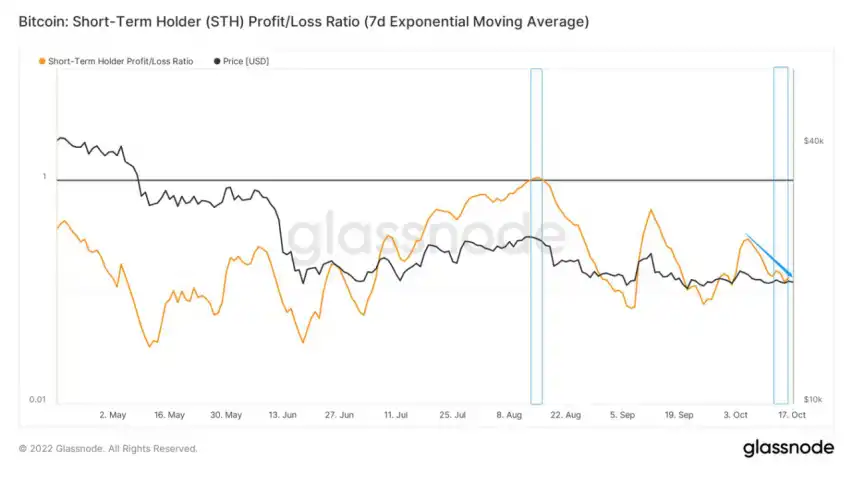
The profit and loss ratio of short-term holders is now in a declining channel, representing that the profitability of short-term holders is declining, and the overall level is in a weak state. Attention should be paid to the possible squeeze caused by changes in sentiment.
(Figure below: Turnover of profit and loss)

At present, the turnover of profit and loss is at a low level, which means that most of the current market groups are in a wait-and-see state, and the active movement on the chain in the market is depressed, which is at a critical point.
Purchasing power rating: Fixed, slightly increased
(Figure below: Purchasing power of global time zones)

At present, the carrying power of purchasing power in Asian time zone has dropped significantly, but it is still positive, which represents that the main support force is now somewhat reduced.
Euro and American time zone purchasing power is currently fixed significantly.
(The following figure shows stablecoin exchange balance)

In the short term, the USDT has slightly incremental funds, and the current changes in the USDC's funds are small.
The market capital motive force is still weak, we need to pay attention to whether there is a continued emergence of purchasing power is the key point.
Off-link data rating: Purchasing power near $18,240
(Chart below: Binance Exchange order book)
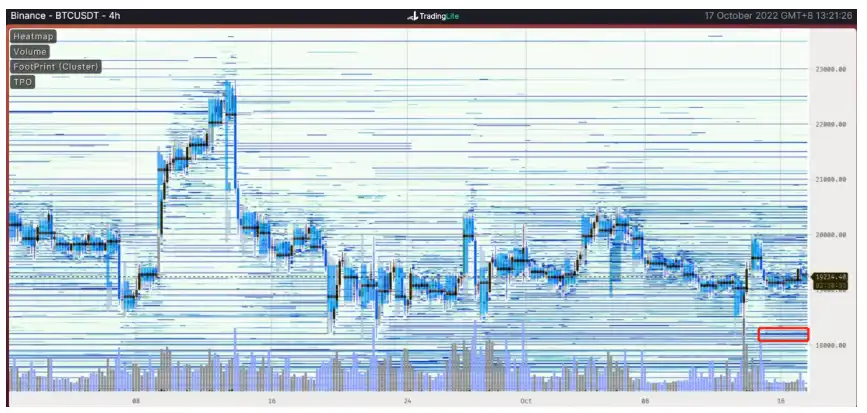
Binance has a buyer's listing near $18,240.
(Figure below: Bitfinex Exchange order book)

Bitfinex has a buyer listing near $18,270.
(Chart below shows Coinbase exchange order book)

Coinbase has a buyer listing near $18,200.
This week's summary:

Summary of message surface:
1. Barclays forecasts that the Fed's 0.75 percentage point rate hike will last until the end of the year, slowing to 0.5 percentage point at its first meeting in early February, implying a Fed funds rate of between 5 and 5.25 per cent, well above its previous forecast of 4.6 per cent.
2. The International Monetary Fund says the global economy is deteriorating, with world economic growth forecast to fall from 3.2% to 2.7% in 2023 due to various factors across countries. That is the lowest forecast since 2001, except during the pandemic and after the financial crisis.
Global economic trends will face unprecedented complexity for some time to come.
In the long run, it looks at two bottoms of the market;
1. Whether the emotional bottom is in place.
2. When the fundamentals are in place.
All of the processes in the capital market, all of the asset pricing is due to the constant selection of the various participants, and the selection is based on the different views of the participants on the event.
Emotions are more important in brain neuroscience than in rational organization; So the emotional bottom tends to be more extreme.
The base of the fundamentals is based on the rational return of the emotional catharsis.
At this time, the asset pricing market of the entire capital market will slowly return to a relatively stable and rational state.
The variance between the two plays a key role in tailoring strategies in capital markets.
Of course, you can't just focus on global bubbles;
Because the world as a whole is a credit system, and when credit bursts most things are bubbles, what matters more is the ability of technology to develop, and the ability to absorb bubbles, including the importance of cycles.
Long-term insights on the chain:
1. More than half a year participants have accumulated more than 80% of the total market chips.
2. Second only to the situation at the end of 2015, and higher than the overall accumulation of conditions at the beginning of 2019.
3. The earnings shock has reached a relatively low stage in 8 years, but the stampede selling pressure is still in a relatively neutral position.
4. At present, the stampede pressure also needs a period of cooling and easing.
• & have spent Market setting:
At present, there is no large internal loss of crypto capital, but it is still accumulating actively. In the later stage, we can pay attention to stampede and dumping pressure, which has a certain stabilizing impact on the market.
On-chain metaphase exploration:
1. Short-term participants cost less than long-term participants and may be less liquid at present;
2. There is no clear inflow/outflow trend for USDC and USDT;
3. The whole network is in the average weak floating loss stage, holding profit and loss ratio between 0 and -0.1;
4. The amount of on-chain transfer reflects that the current participants' enthusiasm is relatively cold, close to the state of May-July 2021;
5. There is a slight growth phenomenon, the current market may be biased towards the construction state;
6. Except "1-10BTC" and "> 10k", all address groups still have good accumulation.
7. A slight slowdown in net position outflows from the BTC exchange could lengthen the build-up.
• & have spent Market setting:
Construction and accumulation
Liquidity is weak, there is still a good internal accumulation, but the accumulation time may be elongated.
Short-term on-chain observation:
1. The risk of derivatives is relatively lower in the short term;
2. The daily trading volume of derivatives is low, the market volatility has the premise of up;
3. Short-term traders' emotional state is at a critical point;
4. At present, the selling pressure continues low;
5. Purchasing power in the Asian time zone has begun to fall, while purchasing power in the European and American time zones continues to repair.
6. Incremental funding is still insufficient;
7. Off-link data has purchasing power around $18,240;
8. Keep at 17000~24000 Probability for & have spent 57%.
• & have spent Market setting:
Short-term critical point, there are certain disk conditions, BTC fluctuations may be greater than ETH fluctuations.
Risk tips:
The above are market discussion and exploration, and do not have directional opinions on investment; Beware of and prevent black swan risks in the market.
The views of BlockBeats are not reflected in this article.
Welcome to join the official BlockBeats community:
Telegram Subscription Group: https://t.me/theblockbeats
Telegram Discussion Group: https://t.me/BlockBeats_App
Official Twitter Account: https://twitter.com/BlockBeatsAsia

 Related Articles