Chainalysis: What did those who profited from NFT do right?
Link: What the Million-dollar NFT Collectors Are Doing Right
Original author: Cyberfun
According to research institutes & NBSP;Chainalysis According to the latest report, the non-homogeneous token (NFT) market has ballooned to $27 billion this year, making it one of the most important segments of the cryptocurrency market. The report also reveals a fundamental difference in the collection strategies of digital collectors with the most profitable heads and those of other waist-and-tail collectors.
This year, NFT beat out cheugy, the term used by gen G to describe a senior frumpy, as Collins' Word of the Year. NFT was nominated for word of the Year alongside Pandamic, climate Anxiety and Metaverse.
When people talk about NFT, they still talk about digital artist Beeple's $69m Christie's art sale in the first half of this year. But NFT has gone beyond digital collectibles and art to music, games, virtual real estate and more.
The rise of the metasurverse concept has added to the hot NFT trading market, and an ETF that invests in listed companies active in the NFT sector has also gone public, allowing more investors to understand and access the sector.
As the most popular NFT marketplace, OpenSea received over $16 billion worth of cryptocurrencies in 2021 (as of Chainalysis report writing). However, the head traders who are active in OpenSea have obvious tendencies and routines. This article will share key data from the Chainalysis report to gain insight into NFT collector preferences on OpenSea.
Retail dominated NFT market
Like most traditional financial transactions, the overall cryptocurrency market is overwhelmingly dominated by institutional investors. The exception is NFT, a special cryptocurrency product in which retail investors (those trading less than $10,000) are the most active market participants.
Retail investors account for 81 per cent of all NFT transactions, according to Chainalysis. As the NFT market becomes increasingly popular with celebrities and wealthy individuals, the share of TRANSACTIONS by NFT collectors (those worth more than $10,000 and less than $100,000) increased from 6% in March to 19% in September, and large deals are becoming more common, and NFT is moving away from being a "speculators' game." But NFT institutional investors (those trading more than $100, 000) still have reservations about it, with less than 1% of the total market.
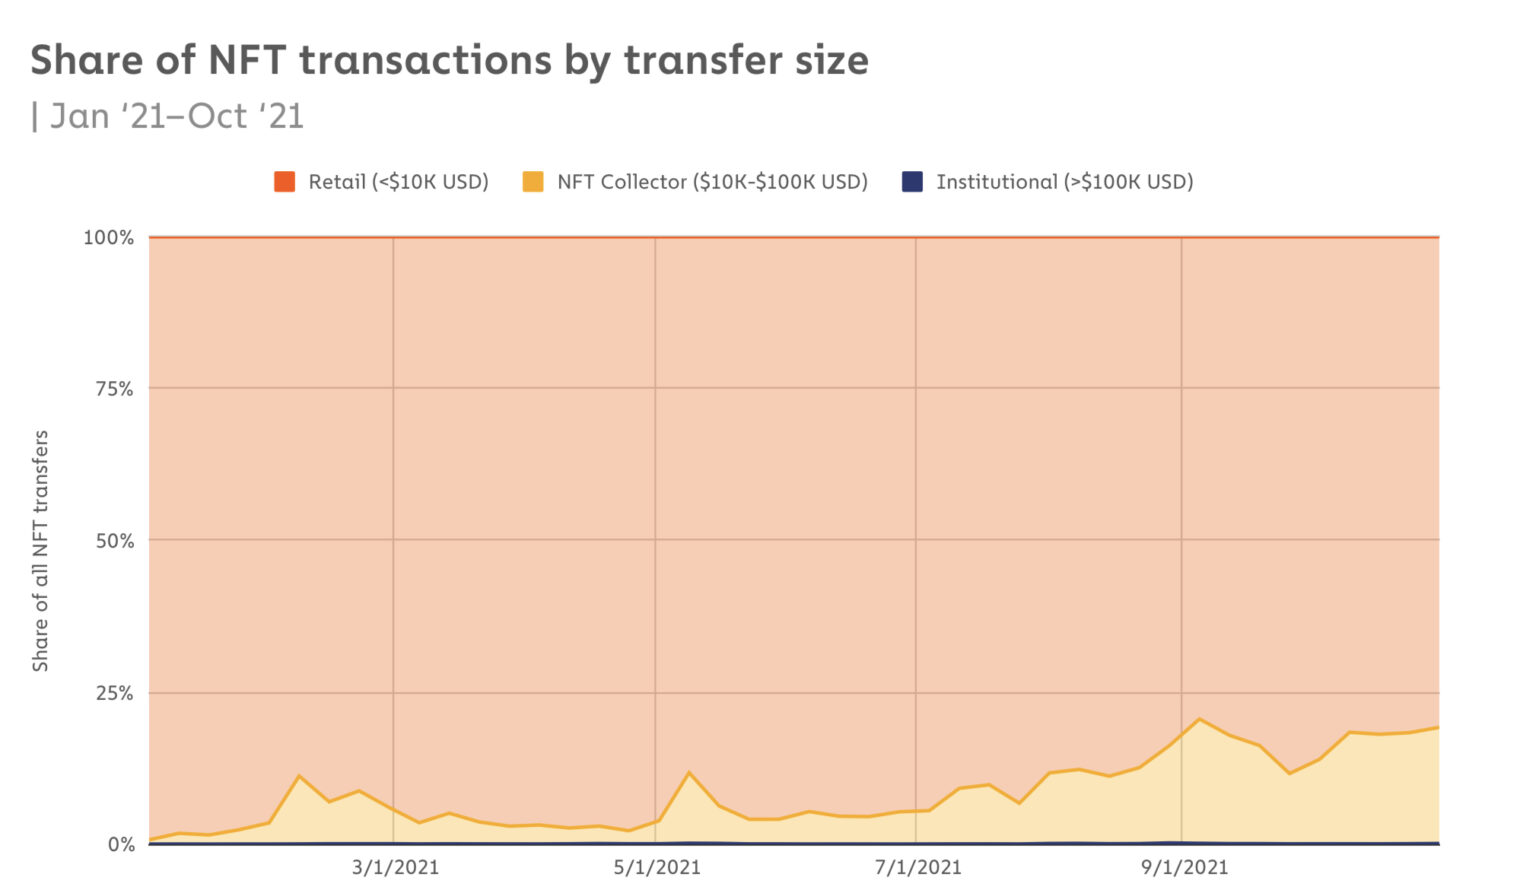
Distribution of NFT market transactions by volume per transaction
From the statistical dimension of NFT market turnover, NFT collectors and NFT institutional investors account for the vast majority of the total volume. Among them, NFT collectors have the largest transaction amount, accounting for 63%. Although NFT traders of this level do not trade as frequently as retail investors, they have the highest total transaction amount. Institutional investors in NFT, at 26 per cent, are in second place. Retail trading was at the bottom of the list, accounting for just 11 percent of market volume.
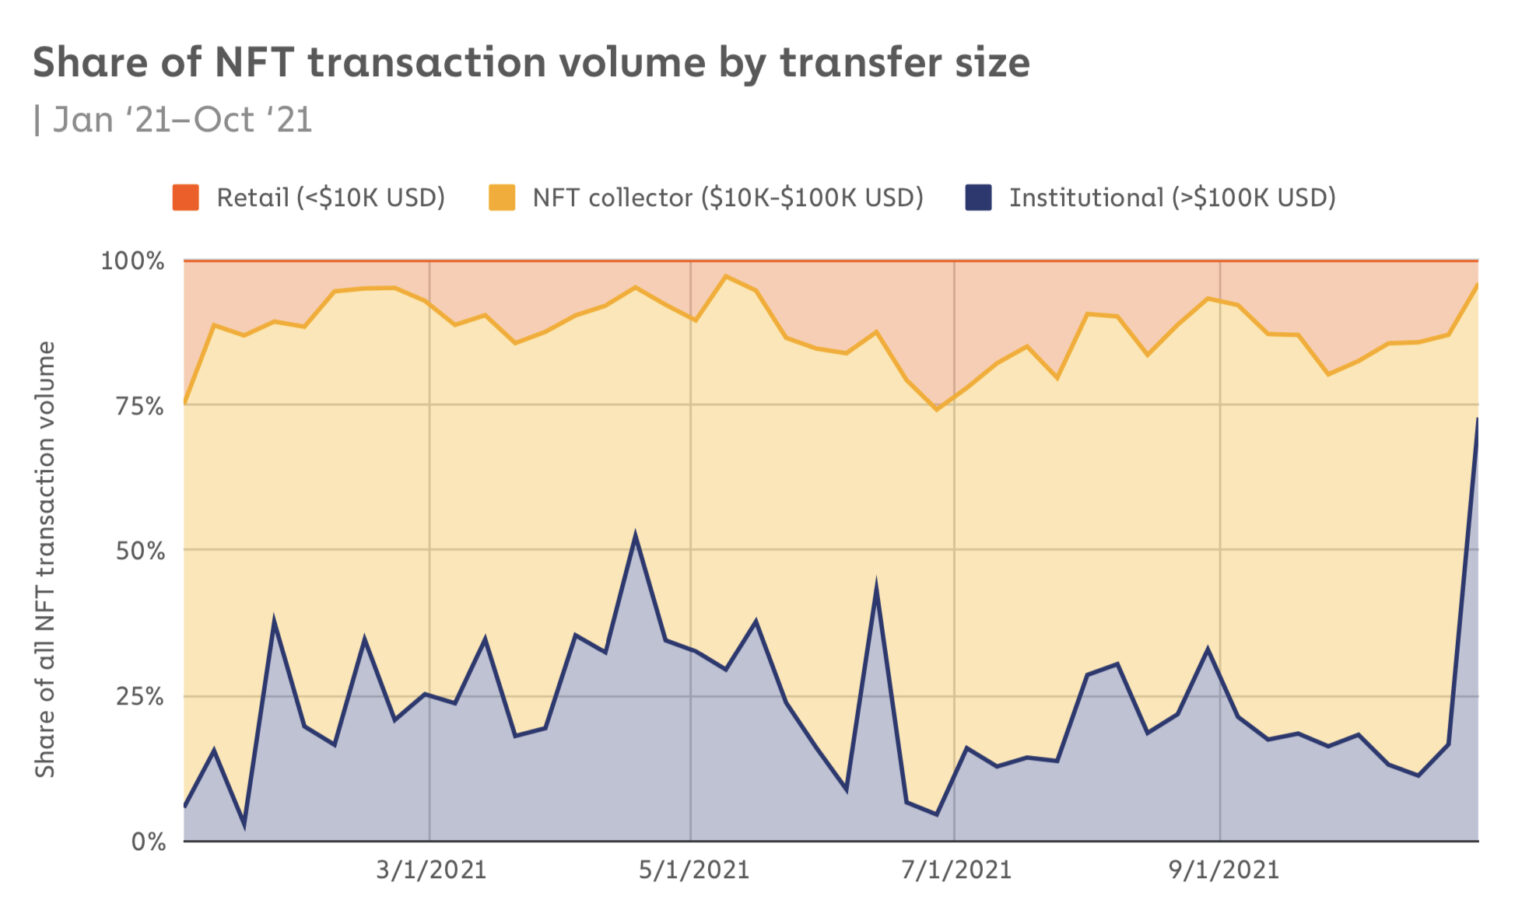
Proportion of trading volume of NFT investors at different trading levels
The above two statistics show that, from a macro point of view, although retail trading volume is low, their resale orders are high. This also shows that the NFT market is still in the process of exploration, the future direction is still highly unpredictable, most institutional investors still remain a wait-and-see attitude.
What do good NFT collectors have in common
NFT is clearly starting to revolutionize the art, games, and culture industries. On the other hand, like other fast-growing investment markets, the most obvious reason for the attention of the NFT market is not the hope to use NFT to drive changes in the world, but the simple expectation that trading NFT can achieve high returns in a short period of time.
But will every investor get a piece of the new market at this time? The answer is definitely no, but we see some commonalities among the most profitable investors.
Contrary to expectations, according to OpenSea, only 28.5% of NFT investors who entered the Minting phase made a profit on the resale of the NFT, while 65% of those who bought the NFT directly in the secondary market made a profit on the resale.
In addition to timing that can lead to wildly different outcomes, here's how the most profitable investors in the emerging NFT market are using strategies based on Chainalysis data to increase their returns.
NFT primary market strategy analysis
Joining the whitelist is key to the profitability of new NFT projects
What is a whitelist? The term is familiar to investors in NFT. When we look back at every successful NFT project, they encouraged active participants in the Discord community or On Twitter to contribute in the early stages of the project. In return, the program operator whitelists eligible participants based on their contributions. Whitelisted participants, who can mint (buy) NFT at a lower price, are the first investors in these NFT projects.
According to OpenSea, 75.7% of whitelisted users are profitable on subsequent NFT sales, while only 20.8% of non-whitelisted users are profitable. Obviously, just as in the investment of traditional financial market, the investors who can enter the market at the early stage of the project are more likely to get profits after the listing. However, the initial entry threshold of traditional financial market is assessed by the amount of capital or resources, while the market of NFT is measured by the amount of community contribution.
Based on ROI multiple, 78% of non-whitelist investors lost money on resales, and nearly 59% lost more than half of their money. Whitelisted investors were more likely to get high returns, and about 40% of them got a multiple of 4.
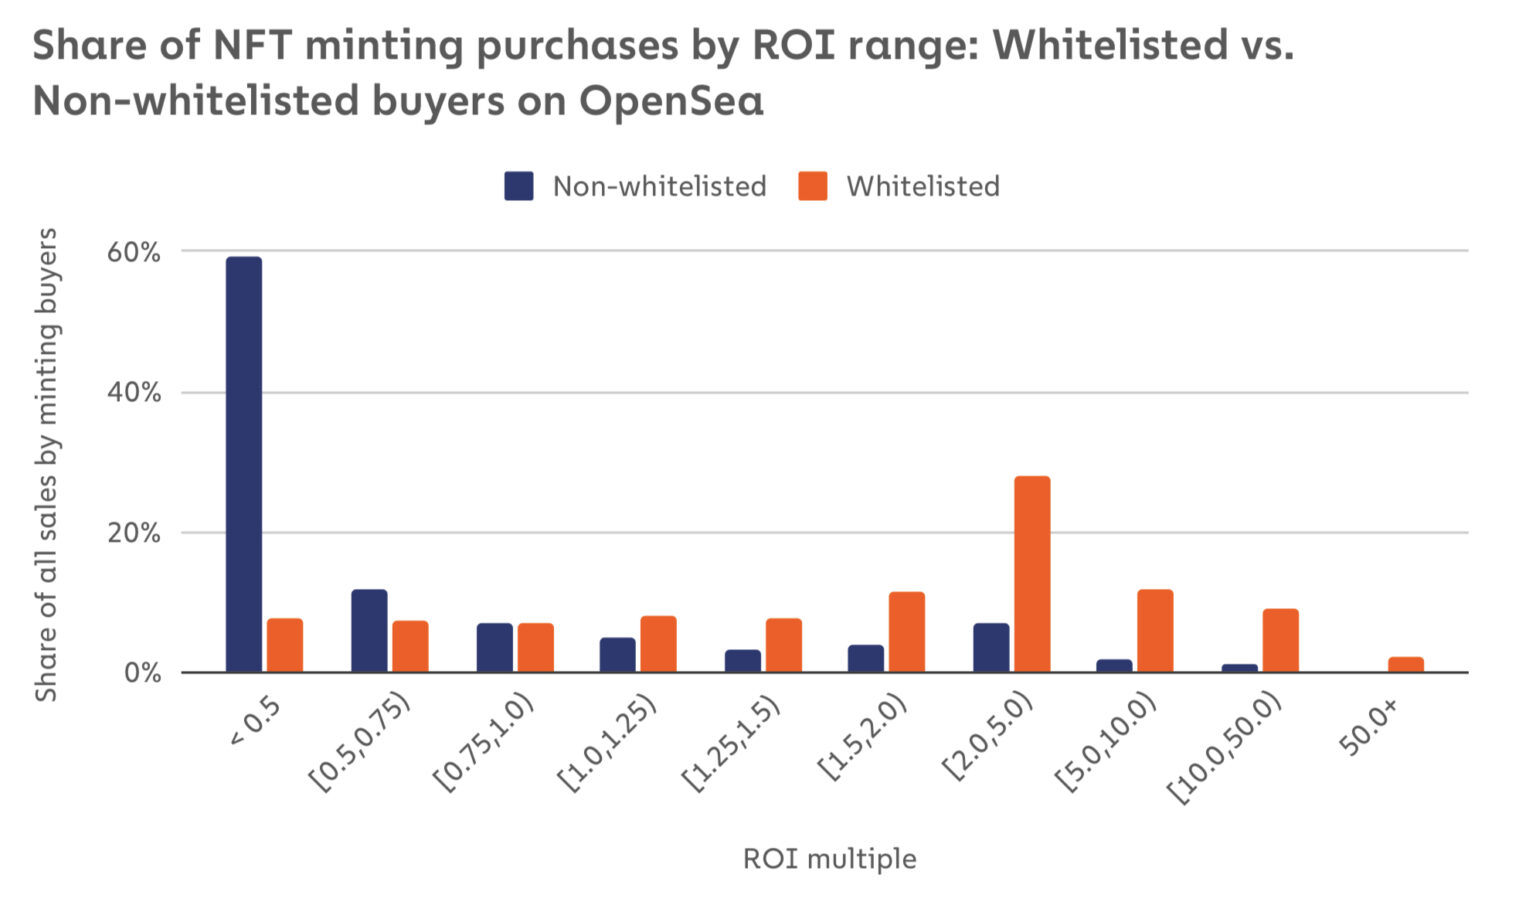
Multiple of returns received by whitelisted VS non-whitelisted investors from resale after NFT casting & NBSP;
The cost of Gas due to the failure of NFT casting is the reason for the lower yield
From the phenomenon we discussed above, if the return on the NFT is equal to the difference between the bid price and the offer price. Investors who enter the primary market, i.e. from the foundry stage, are more likely to fail than those who enter the secondary market, as the success rate in the primary market is 28.5% compared to 65.1% in the secondary market. One reason for the difference may be the trading fees that are eaten up by a large number of failed exchanges.
When can there be transaction failure but still need transaction fee? When a hot NFT project is in the foundry stage, thousands of users are competing to foundry NFT at the same time, resulting in network congestion that causes many users to fail to foundry after submitting transaction fees. The survey also found that experienced NFT traders who used robots to conduct NFT often ignored the scenario of trade failure. This directly causes the robot to repeatedly submit transaction requests even when the transaction has already failed.
In the worst cases, the bots repeatedly submit transactions that fail, resulting in a drain on transaction fees at the white level. If fees on these failed trades are included in the overall NFT returns, the average return of a primary market participant may be lower than that of other NFT traders.
In general, if an NFT investor wants to enter from the foundry stage, non-whitelisted users are less likely to make a profit on the transition to NFT.
NFT secondary market strategy analysis
The above introduction of NFT project in the casting stage, different investment strategies lead to different investment results. The following compares how NFT traders in the secondary market use corresponding strategies to make profits. Compared with NFT sales in the primary market, sales risks in the secondary market are more complex.
Secondary market overview & NBSP;
NFT industry concentration is high
As can be seen from the statistical picture below, the number of NFT projects sold in OpenSea is 2000, but the sales of the top 250 NFT projects account for 80% of the sales in the secondary market, that is, 10% of the projects account for 80% of the sales, indicating a high degree of industry concentration.
If the NFT industry has entered the mature stage of the industry, it should have a situation of high differentiation competition, and the industry concentration should be relatively low. However, at present, the NFT market is in the exploratory stage, and market investors have far from forming a systematic standard for its judgment, so most investors are following the trend with obvious head effect. In the future, when the NFT market is mature, it may be similar to the luxury industry and art industry, with brand value and audience loyalty as the main competitiveness.
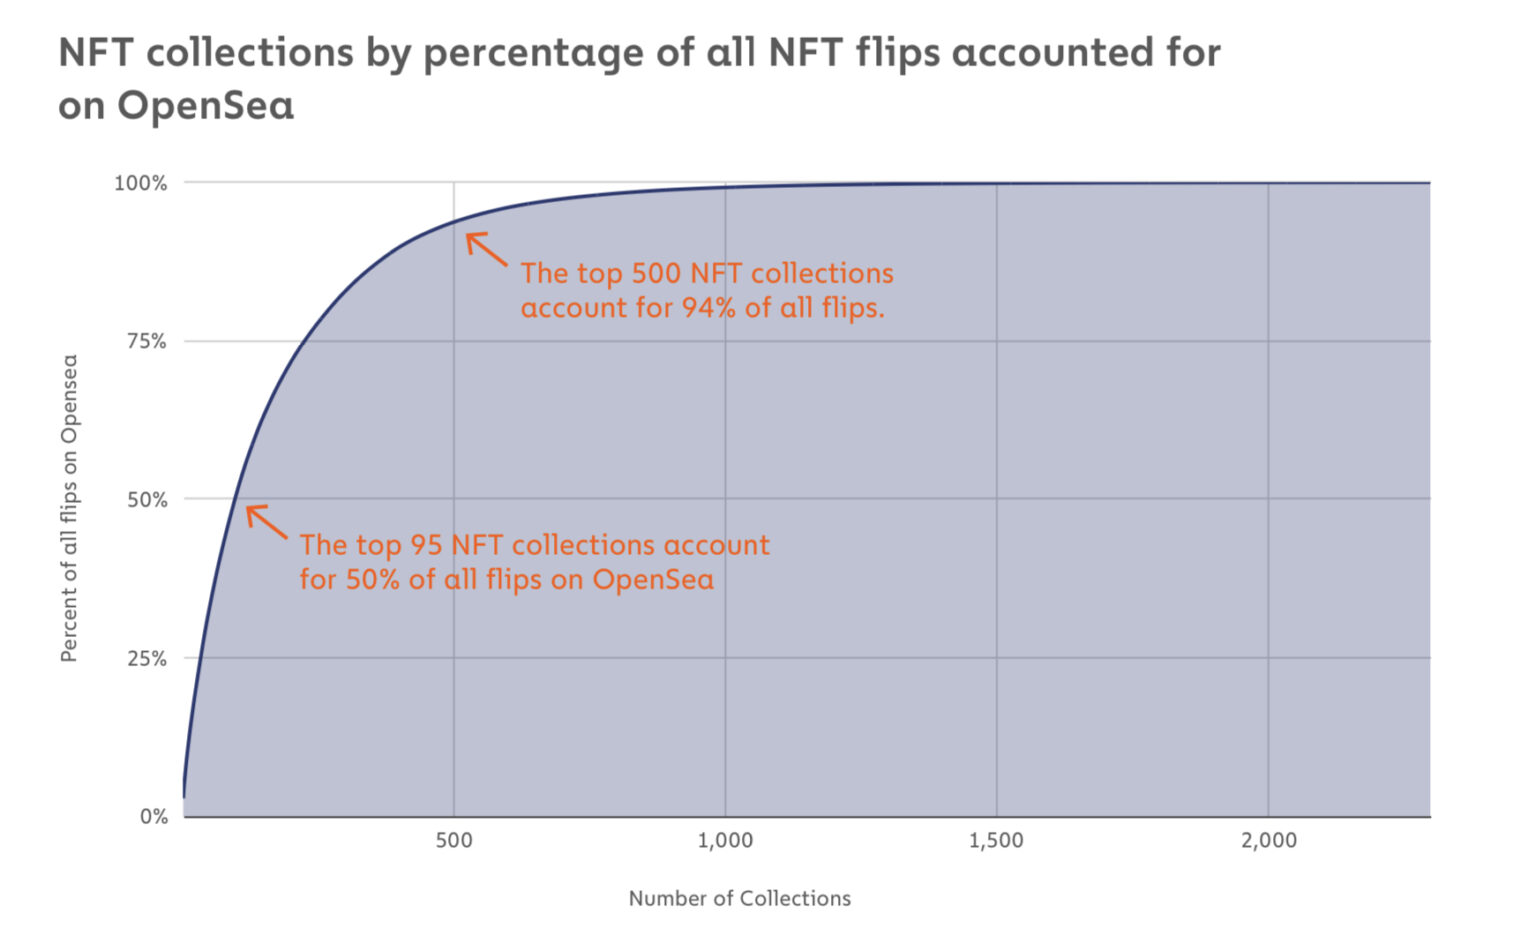
OpenSea's NFT project resale concentration
A handful of NFT investors pocketed most of the profits
From the perspective of market behavior, it is always a small number of people who make money, and the NFT market is no exception. As can be seen from the profit distribution chart below, 20% of OpenSea accounts account for 80% of NFT secondary market transactions, while 5% of users earn 80% of secondary market sales profits. As you can imagine, the NFT market is still in its infancy, but the head effect is already there. The remaining 95% are still competing fiercely for 20% of the profits.
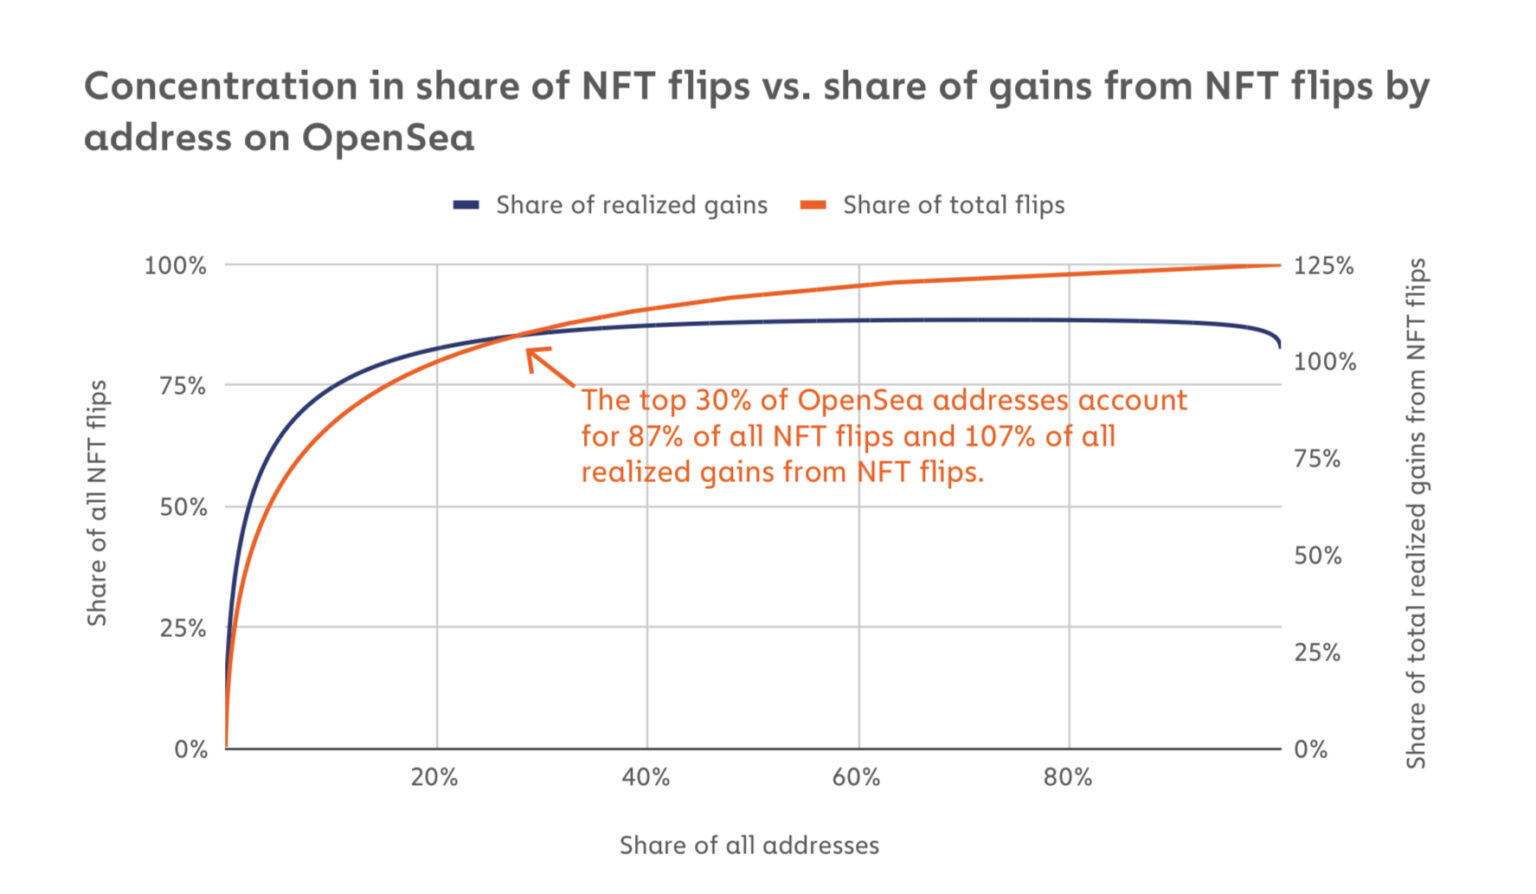
Comparison between NFT resale concentration and NFT resale profit concentration
Generally speaking, the NFT market is in the growth stage, with more and more projects and fierce competition. However, I believe that the market elimination mechanism will keep excellent projects in the future development. We are in this period of high risk and high return, NFT investors need more rational investment strategies to meet the mature development of NFT.
Secondary market investment preference comparison
In addition to introducing the development of NFT's secondary market, Chainalysis also grouped more than 23,000 OpenSea accounts into groups. The grouping condition is the rate of return of each resale NFT. In the chart below, group 1 is the most successful NFT trading group and Group 5 is the least successful. Groups 2-5 showed a linear decreasing relationship, from 1.9 to 0.9. Group 1 outperformed the other groups: Per NFT, group 1 earned an average return of 2.9 times, twice as much as Group 2. For group 5, the average return on each resale is 0.9, which is a loss. We could jokingly call Group 5 the leek team.
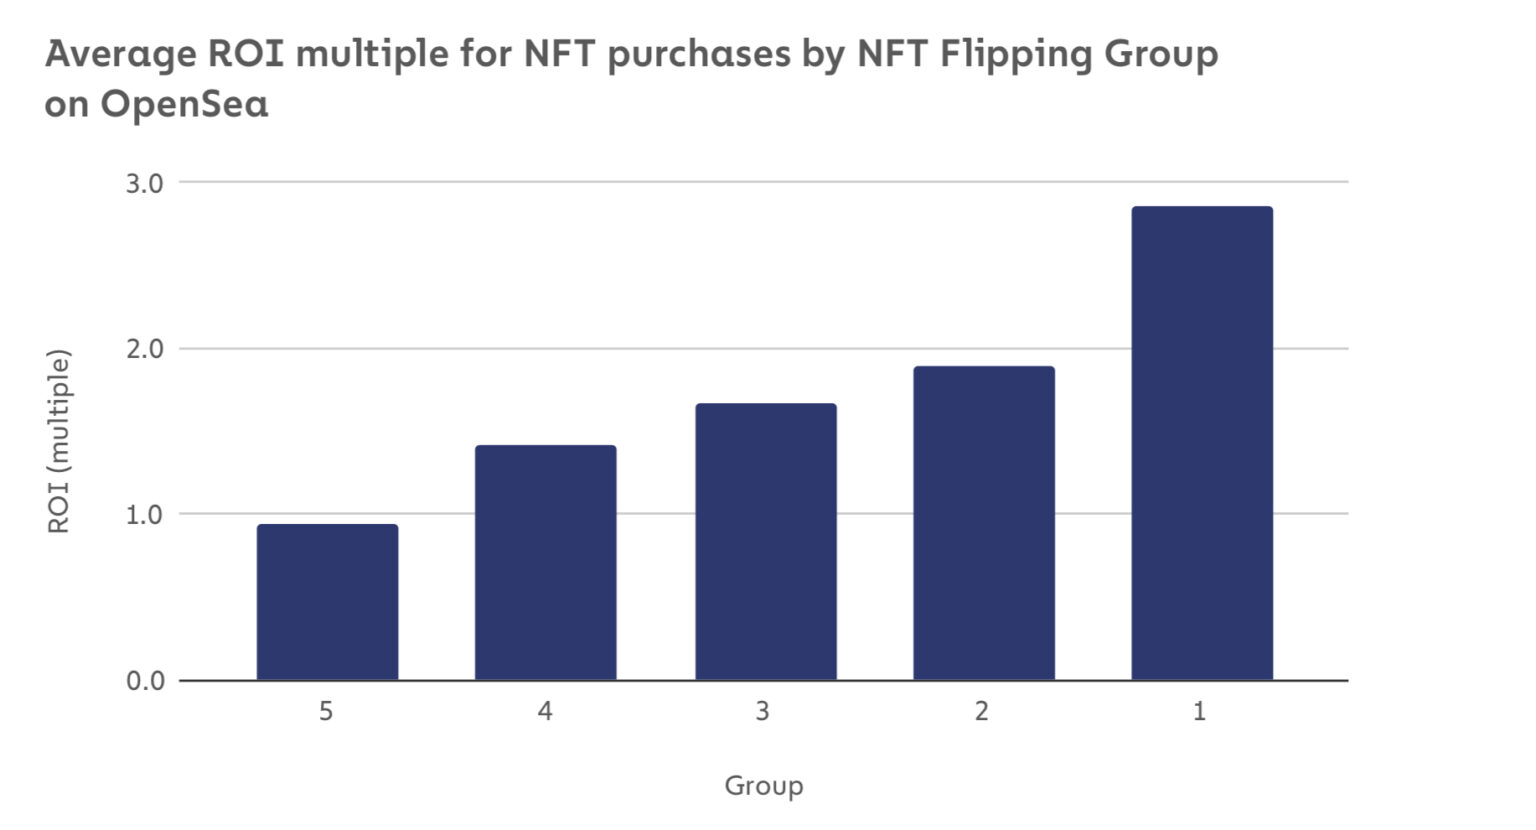
Statistical table of average investment return multiple of each group
Resale hit ratio and diversification
At present, the NFT market is still in its infancy, and every project is in the angel round. With the exception of a few projects, such as BAYC, which have achieved some degree of commercialization, most of the remaining project value systems are attached to the realization of the meta-universe. Such a new business logic system is difficult to analyze by existing value judgment. Therefore, in terms of the hit rates of each group of NFT investors, the resale hit rates of high returns were not much higher than those of the other groups. That is to say, the probability of all people successfully finding the next order is about the same.
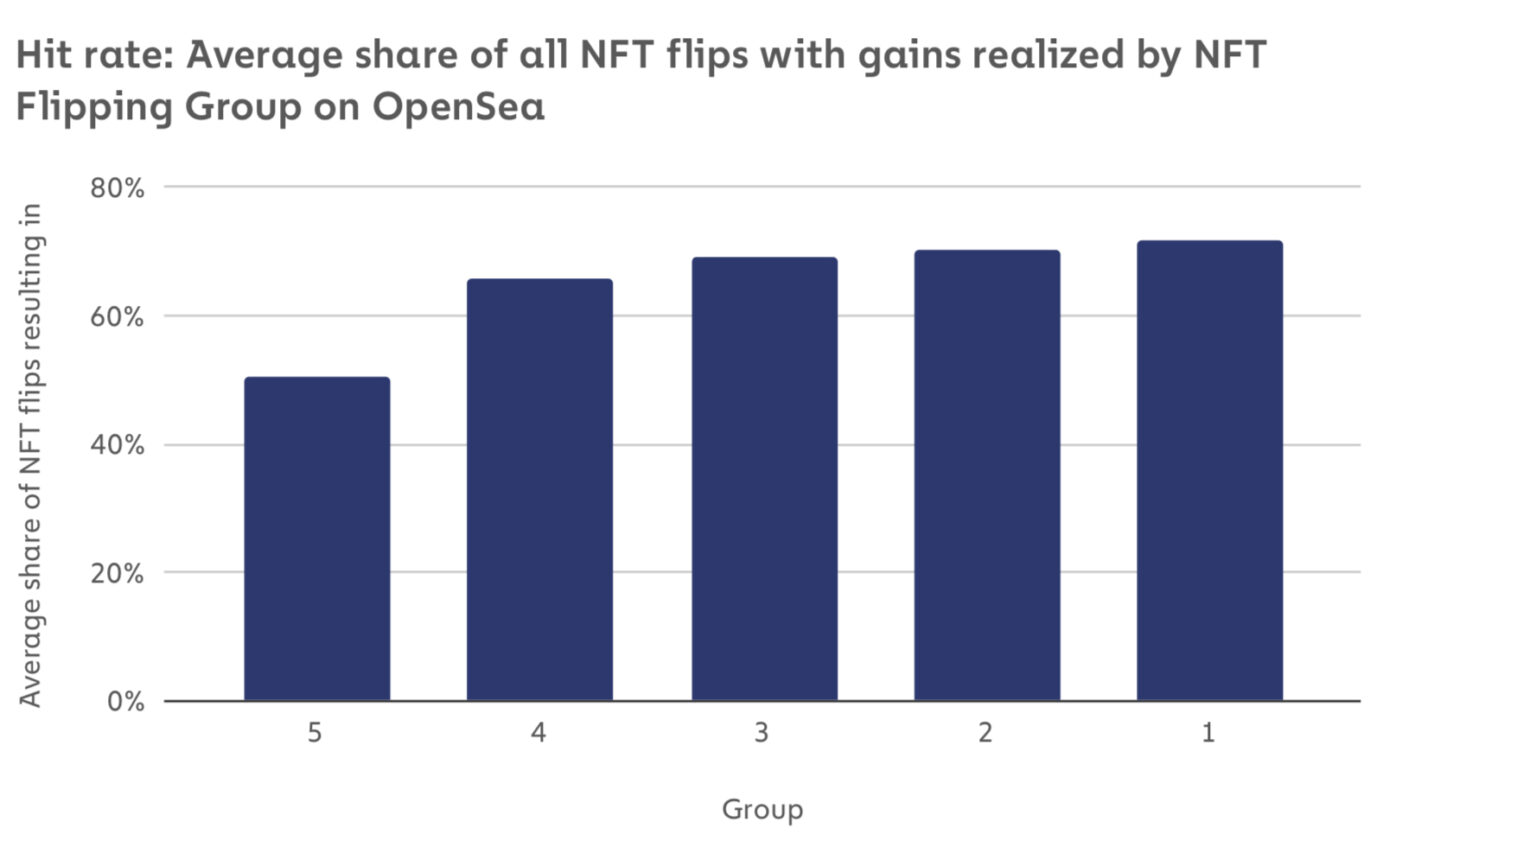
NFT Transaction success rate (hit ratio)
The reason why the high-yield group slightly beat the hit ratio may also be related to the higher average trading frequency of group 1. In the survey data, the average number of NFT bought and sold by Group 1 was 105. At least twice as many as in group 2, which had 39. Group 4 and 5 bought and sold less than 25, which was 1/4 of group 1.
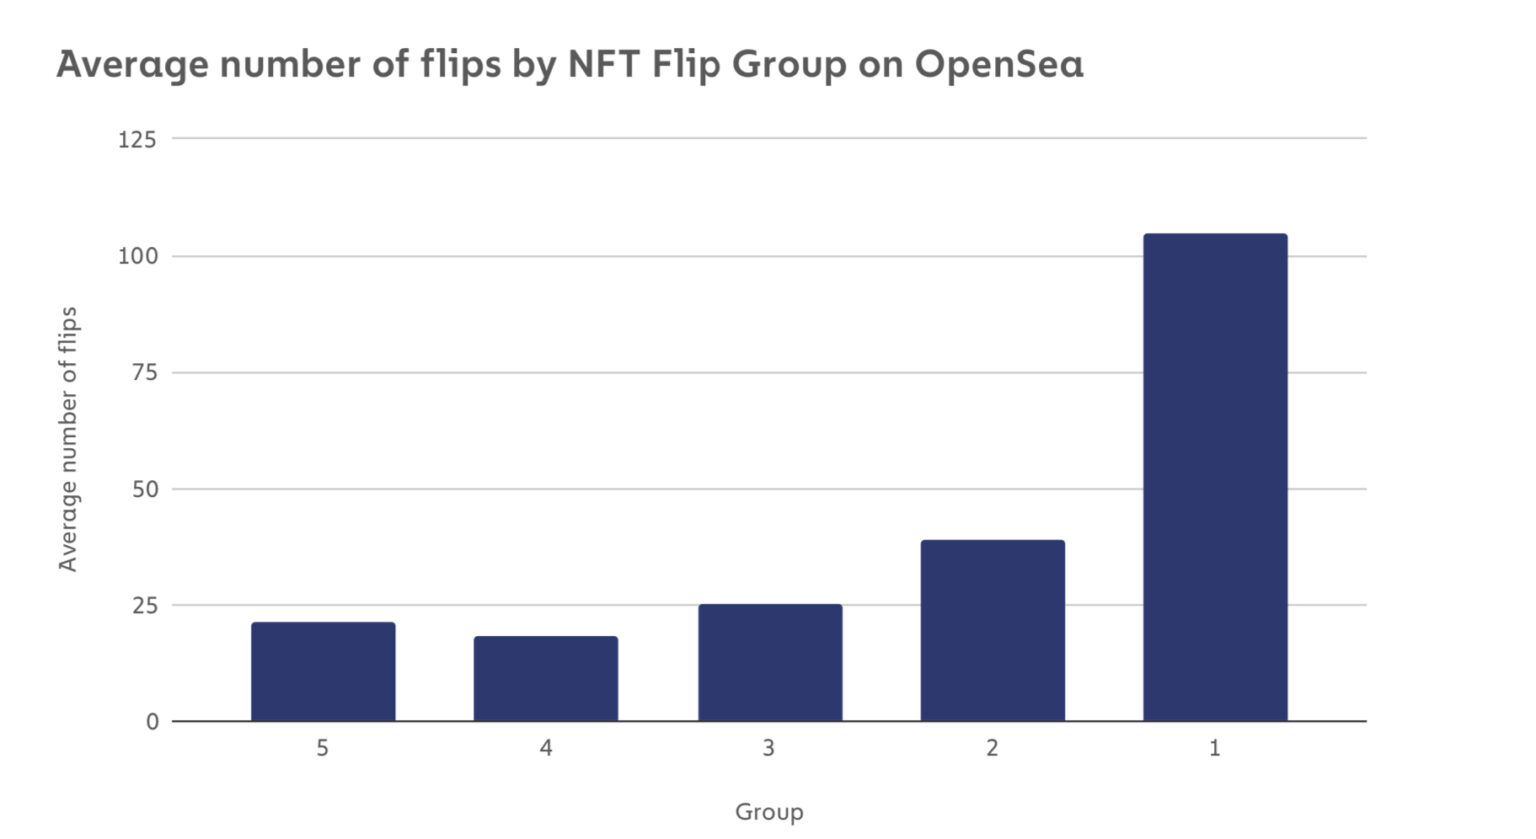
Number of resales of NFT projects
Although high-yielding users trade significantly more frequently, they tend to put their eggs in different baskets. The average number of NFT projects (Uniques) invested by group 1 investors was as high as 28, while groups 5 and 4 had less than 10. There is a linear relationship between the number of NFT projects invested and the probability of success. The diversification strategy of NFT investment projects can reduce non-systemic risk.
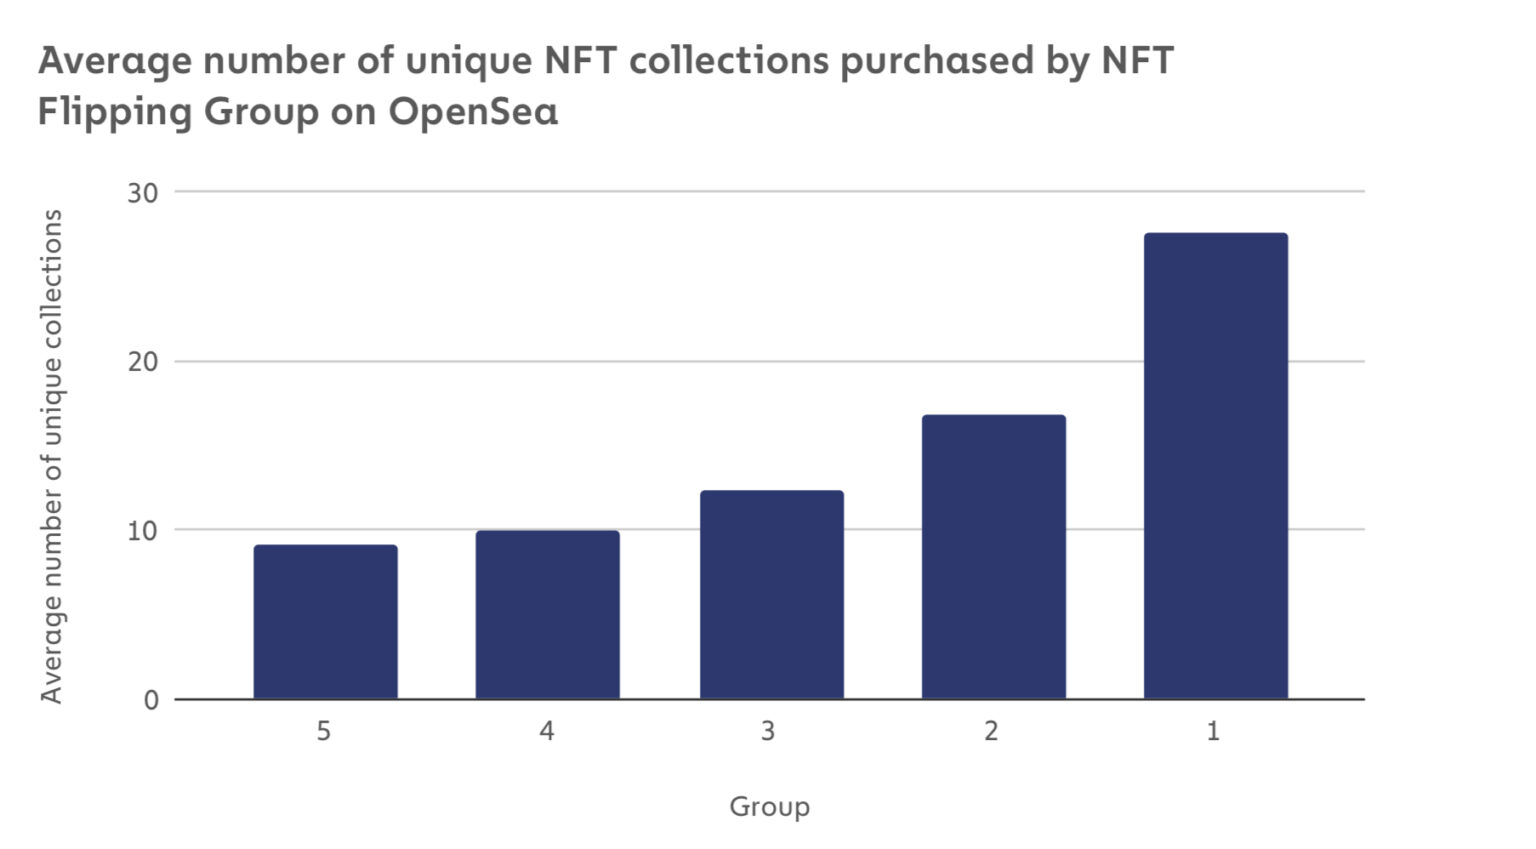
Number of NFT project participation of different groups
High yield accounts have relatively robust investment preferences
Comparing the highest return orders from each NFT trader's historical trades, it was found that group 1 was the most successful investment group and their highest return orders had the lowest returns of any group except group 5. In combination with contextual data analysis, it can be seen that groups with high returns tend to be more rational and less likely to have a small mentality. The timing of entry and the selection of projects tend to consider whether the target has a certain value basis, so the possibility of obtaining excess returns is also low. On the contrary, groups with lower overall investment returns tend to have higher excess returns on their most successful single trades.
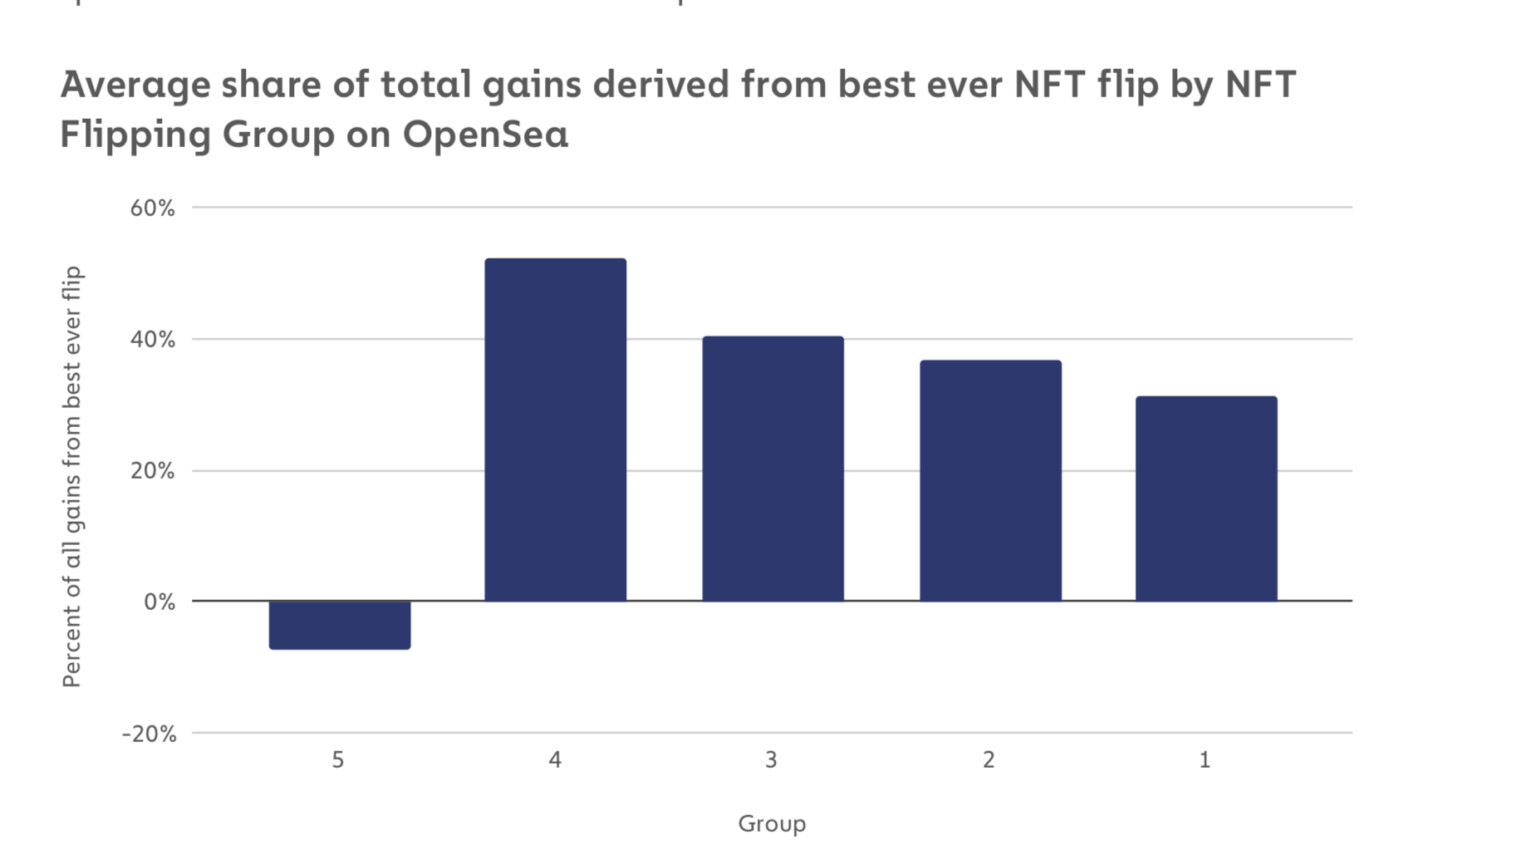
Average return statistics of the most successful NFT trading orders
The high-yield group also had higher project costs
The more successful the transaction group, the higher the average purchase cost of NFT. The average NFT cost of group 4 was 0.375ETH, while that of group 1 was 1.07ETH. This also reminds us that in NFT investment, the start-up projects are often good and bad, do not blindly buy for cheap projects, otherwise it may lead to low returns or even losses.
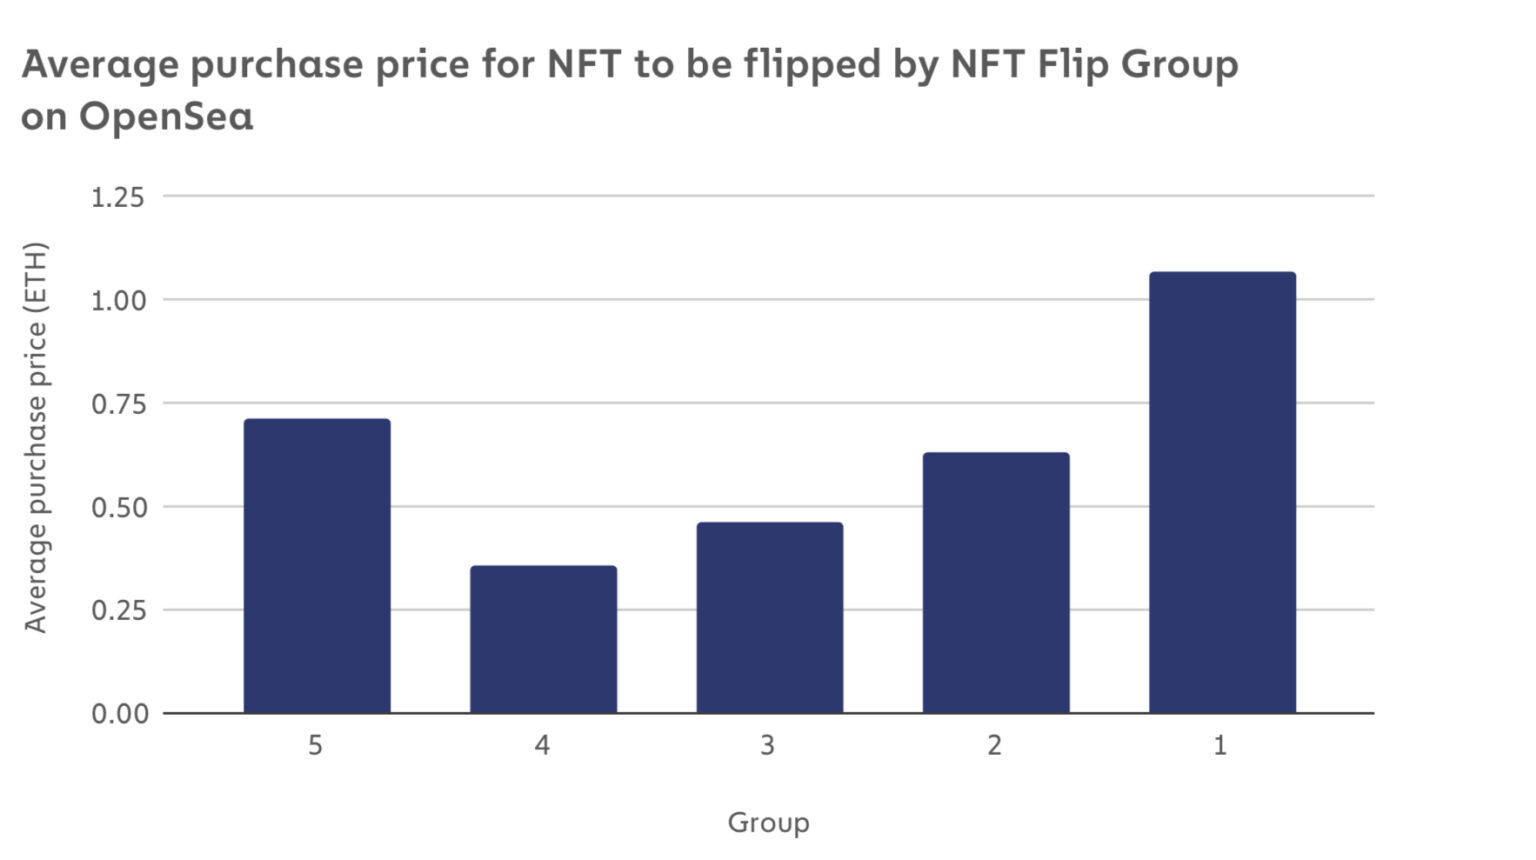
The average cost of NFT purchases
Most successful NFT traders are also "wealthy" Defi users
In Chainalysis, the initial source of funds in the wallet of NFT traders in group 1 was counted, and more than half of the initial sources of funds were related to Defi. According to the report, it can be found that the central trading contract closely related to Defi is the main source of funds for the group of traders, accounting for 34.1%. In addition, 9% of lending contracts and 14.8% of token smart contracts are also related to Defi usage. Most of the money in the average wallet's portfolio comes from centralised exchanges.
Chainaylsis also compared the average value of each transaction between centralized and decentralized exchanges, and found that the average value of each transaction was $12,431 for the central exchange and $26,520 for the decentralized exchange. Obviously, users of the exchange to the center generally invest a high amount of money, sufficient capital. Therefore, this group of people with a large amount of capital to invest in NFT relatively mature NFT projects naturally more confident.
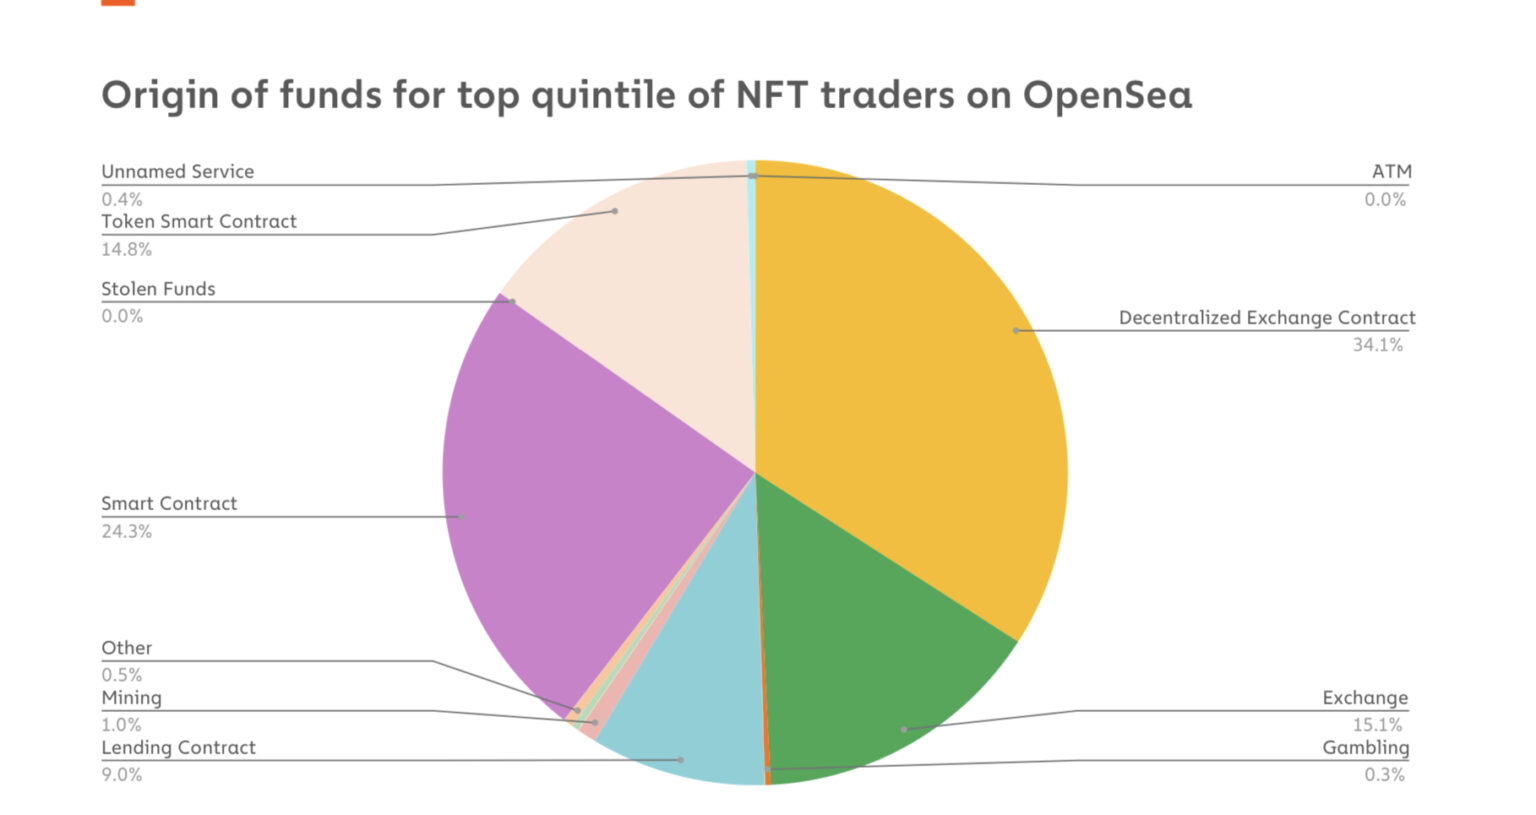
Group 1: NFT investment fund source statistics
A final note
The Chainalysis report concludes that NFT, the hottest virtual currency market product of the year, has become a necessary choice for retail investors to get into the metasomes or virtual currency markets, but NFT market participants need to understand the shape of the entire NFT market.
The report explains that the concentration degree of NFT projects and successful investors are both very high, indicating that only a few NFT can make profits in the competition of THE NFT market, and participants need to maintain a rational and prudent attitude to reduce losses in the investment process.
Investors in the NFT secondary market than in the primary market entry of the success of the probability is higher, provided that the capital must be sufficient. Users entering the primary market need to invest more to contribute to the community and join the whitelist to gain a better profit probability, rather than just snatch more NFT through robots, otherwise it may reduce the profit rate due to higher invalid transaction fees. Traders in the secondary market need to develop a more rational investment strategy: value investment, diversification of investment, to reduce systemic risk. Beware of blindly buying low-price projects and excessive desire for excess returns.
The original link
Welcome to join the official BlockBeats community:
Telegram Subscription Group: https://t.me/theblockbeats
Telegram Discussion Group: https://t.me/BlockBeats_App
Official Twitter Account: https://twitter.com/BlockBeatsAsia
 Related Articles