On-chain data analysis for the 33rd week: the demand for Ethereum exceeds the supply, and the purchasing power of market participants begins to slow down

Original title: "Dark tide surges, stars move and things change | WTR 8.15"
Original source: WatchToweR Research Institute
“Our aim is to Data analysis to help market participants dissect the market more comprehensively, so that participants can rely on their own judgment to make more rational decisions.”

This week in review
From August 8th to August 14th this week, the highest BTC was around 25,000, and the lowest was close to 22,600, with a volatility of about 10.03%.
Observing the recent chip distribution chart, there are a large number of chips traded around 22600, which will have certain support or pressure.
Analysis:
1. 23000~24000 about 680,000 pieces
2. 29000~35000 about 1.16 million pieces
The probability of not breaking through 29000~35000 is about 63%, because most of the loss-making stocks below 28000 have been digested, so the chip analysis structure has moved up.

Important news
1. Chainlink: agreement and service will Continue to run on Ethereum, does not support forks such as PoW
2. Twitter user @Tisoga cited GitHub data, indicating that the number of active developers per week in the Web3 ecosystem has remained around 5,000 in the past three months. Among them, Ethereum ranked first with 1720.
3. According to The Block, Greg Dwyer, the former head of business development at BitMEX, pleaded guilty instead of voluntarily in his criminal trial, charged with violating the Bank Secrecy Act
8.9
1. The Aave community publishes a technical analysis for the Aave community's proposal of "only support for merging Support for the new proposal for a post-PoS chain”.
2. According to Bloomberg News, Ark Fund (Ark) CEO Cathie Wood explained the reason for selling Coinbase stock in July, saying that it was due to the uncertainty of the US Securities and Exchange Commission (SEC) investigation.
3. Dune Analytics data shows that the number of smart contracts on the Ethereum chain has exceeded 50 million, and as of now it is about 51.1 million.
4. Dune Analytics data shows that nearly 3.5 million ETH (3,489,693) have been deposited on the decentralized currency mixing application Tornado Cash platform
5. Net letter China issued a document "National Cyberspace Affairs Office Concentrates on Rectifying Chaos Involving Virtual Currency Hype", stating that it follows the spirit of the "Notice on Further Preventing and Disposing of Risks of Virtual Currency Trading Hype". Closed 12,000 illegal user accounts such as the founder of @ICE Blizzard and @富环爆爷, and cleaned up more than 51,000 illegal information such as "investing in Bitcoin to make money easily".
8.10
1. DeBank officially stated that the hard fork will bring huge disaster to the entire Web3 ecosystem, so in Ethereum During the transition period of the PoS merger, DeBank and all its products will not support any potential fork chains, including Web3 user platform DeBankDeFi, non-custodial wallet Rabby and Web3 developer service DeBank Open API.
2. STEPN has reached a cooperation with the encryption subsidiary of Japanese communication giant LINE to provide localization services in Japan
3. Citigroup is recruiting two digital asset risk managers
4. FTX announced the integration of Reddit community tokens into FTX Pay. In the future, Reddit users including the United States, Australia, the European Union and other global users can trade and pay Reddit community tokens in FTX Pay.
5. Interactive Brokers announced the expansion of its crypto trading services to include 24/7 trading capabilities powered by Paxos Trust Company.
8.11
2. ; NFT aggregation trading market Element appointed former OpenSea community manager Edward Clements as the head of the English community, and will attend the Element 2.0 product launch event on August 15.
3. According to CoinDesk, Morgan Stanley launched the ETH transaction indicator PAPA (Price Adjusted Transaction Volume Per Address), which divides the cryptocurrency price in US dollars by the blockchain The ratio of trading volume to active wallet addresses (90-day average) is calculated, aiming to use traders' speculative activities to predict ETH pricing and help investors estimate ETH price trends.
4. A joint proposal released Wednesday by the Securities and Exchange Commission (SEC) and the Commodity Futures Trading Commission (CFTC) would require large hedge funds to report their Cryptocurrency Risk Exposure.
5. Cryptocurrency trading platform Bitfinex may face criminal investigation in the United States
< /p>
6. BlackRock: Launched a private trust to provide US institutional clients with direct exposure to Bitcoin spot (trading ), the trust will be BlackRock’s first product with direct exposure to BTC prices. BlackRock manages approximately $9 trillion in assets
7. Royal Foundation The Royal Foundation, the Duke and Duchess of Cambridge, the British Prince Foundation announced to join the encryption field
8.12
1. Ethereum founder Vitalik Buterin tweeted that the Ethereum mainnet merger TTD has been set to 587500000000000000000000, which means that the Ethereum PoW network now (roughly) has A fixed amount of hash power is available for mining. The bordel.wtf website predicts that the merge will happen on September 15 at 4:44:05 UTC, but the exact date depends on hash rate.
8.13
1. Sale of shares for Huobi According to reports related to the negotiations, Huobi responded that there is currently no plan for the transfer of major shareholders’ shares, and the company’s operations are normal.
2. According to data from BeInCrypto Research, the trading volume of Uniswap hit a new low in July, about 37.8 billion US dollars
Encrypted ecological news
1. According to data from CoinMarketCap, aUSD has unanchored to around $0.7.
2. Tether: POS Ethereum will be supported according to the official schedule
3. Binance Labs announced a strategic investment in Web3 infrastructure provider Ankr, which will be used to strengthen Ankr RPC service work and build its Web3 developer kit.
4. Nuri GmbH, a German cryptocurrency trading platform, has filed for bankruptcy in Berlin, citing the sell-off of the crypto market and the collapse of Celsius, while its users can still withdraw deposits.
5. Circle issued a document stating that it will only support the Ethereum PoS chain after the merger of Ethereum is completed, and it is expected that USDC's on-chain functions or fully automatic issuance and redemption services will not be interrupted.
6. Beosin statistics show that in the first half of 2022, about $1,140.7 million in stolen funds were transferred to Tornado cash by hackers, accounting for 60% of the total Web3 losses.
7. According to Blockworks, Vitalik Buterin, the co-founder of Ethereum, said that after the merger of Ethereum (The Merge), the current gas fee combined with Rollup is about 0.25 US dollars, and in the future combined with Rollup, it may be as low as $0.002 - $0.05.
Economic news
< /p>
1. According to Wall Street reports, Bridgewater Associates, the world's largest hedge fund, announced its second Quarterly position information, in the second quarter, Bridgewater increased its holdings of 612 stocks, of which Meta Platforms increased its holdings by 5,279% to 586,655 shares, worth $94.6 million.
Long-term insight: used to observe our long-term situation; bull market/bear market/structural change/neutral state
Mid-term exploration: with To analyze what stage we are currently in, how long this stage will last, and what situation we will face
Short-term observation: Used to analyze short-term market conditions; The possibility of a certain event
Long term insight
The ratio of long-term investors to new forces
ETH computing difficulty
DeFI Market Value of ETH
Monthly Active Address Status
(The investors and new forces in the picture below holding ratio)

The proportion of long-term investors has reached over 80% of the highest level in 2019.
After reaching such a level in 2019, the Mavericks era will start with the new force.
(The difficulty of ETH computing power in the picture below)

With ETH's vigorous merger event, ETH has dropped to the most difficult computing power ever.
In the face of a large number of merger events, the previous downturn has caused some participants to have a need for hedging.
(The DeFI market value of ETH in the figure below)

This time, perhaps due to DeFi issues and price issues, participants are still discouraged.
DeFi continues to slump, even with the relative increase of ETH more than doubling, the amount of pledge is still very unsatisfactory.
DeFi is in a downturn and needs to find a better way to break the situation.
(Active address status in the figure below)
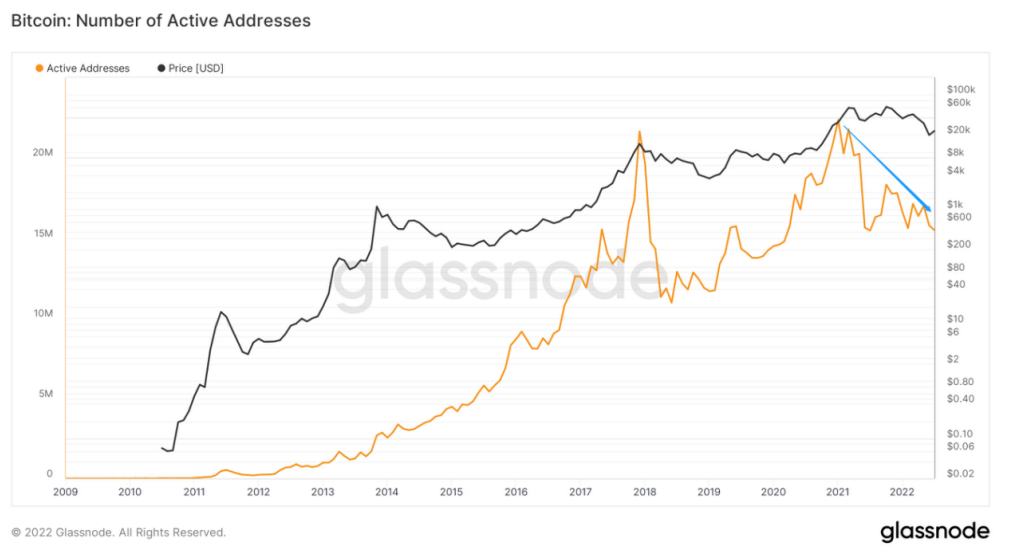
From a monthly perspective, the activity level is still relatively low, but the organization’s process speed remains unabated.
phase Compared with the whole group, this time there may be a tangled change of hands.
Mid-term investigation
Fair value standard score
BTC and ETH transaction volume
CDD Month-to-Year Ratio and MVRV Ratio
Long-term and short-term unmoved supply
new force
Stablecoin net position
BTC trend net position
ETH Trend Net Position
;Slope of monthly change in the number of addresses above 1BTC and 10ETH
Achieved HODL ratio
Total pledge amount of ETH2.0
ETH to BTC option open interest ratio
On-chain active status rating: The market value has risen slightly, and the trading sentiment has slowed down.
(fair value standard score below)

MVRV Z-Score is used to assess when Bitcoin is over/undervalued relative to its "fair value". When the market value is significantly higher than the realized value, it has historically indicated a market top (red area), and the opposite indicates a market bottom (green area).
It is currently slowly moving out of the "undervalued" area, indicating a mild sign of recovery in the market.
In-depth observation of BTC and ETH transactions.
(BTC and ETH trading volume in the figure below)

Blue line: BTC trading volume
Purple: ETH transaction volume
The trading volume of ETH is more significant than BTC, and the weight of ETH may be higher than that of BTC at this stage, so we need to pay attention.
The current trading volume of ETH has dropped, and the trading sentiment in the current market may be slowing down.
(the ratio of CDD to MVRV in the figure below)
< /p>
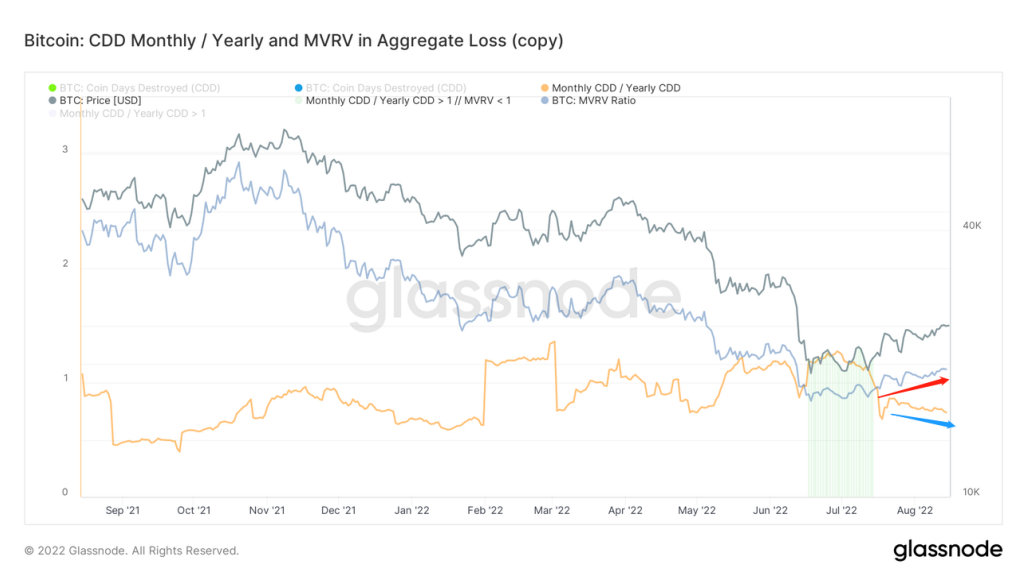
Yellow line: The ratio of CDD monthly change to annual change, used to measure the monthly selling pressure within the annual range.
Blue Line: Market Cap to Realized Value (MVRV) is the ratio between Market Cap and Realized Market Cap, which is used to measure the current market capitalization condition.
CDD is slowly declining, and traders with high age and high currency volume within the month tend to hold and slow down selling.
The MVRV ratio is slowly rising, indicating that the market capitalization is slowly recovering.
Rating from the perspective of time: long-term and short-term slow increase, new force is slightly weak< br>
(Long-term and short-term unmoved supply in the picture below)
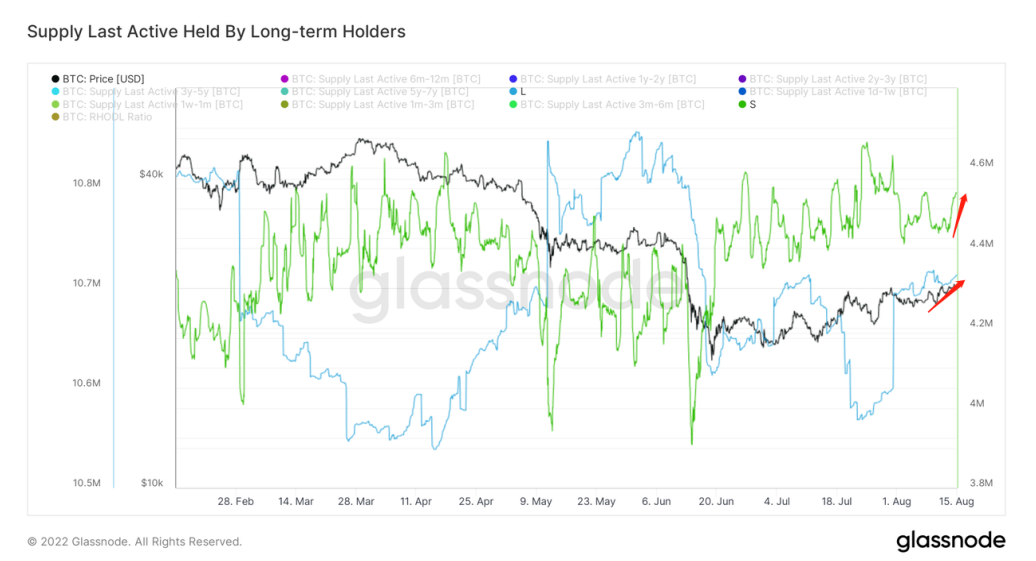
< p ql-global-para="true" line="tpRn" linespacing="115">Blue line: untouched supply by long-term traders
Green line: untouched supply for short-term traders
Both long-term and short-term traders keep increasing, and there is currently no heavy sentiment to reduce holdings.
(new force in the picture below)
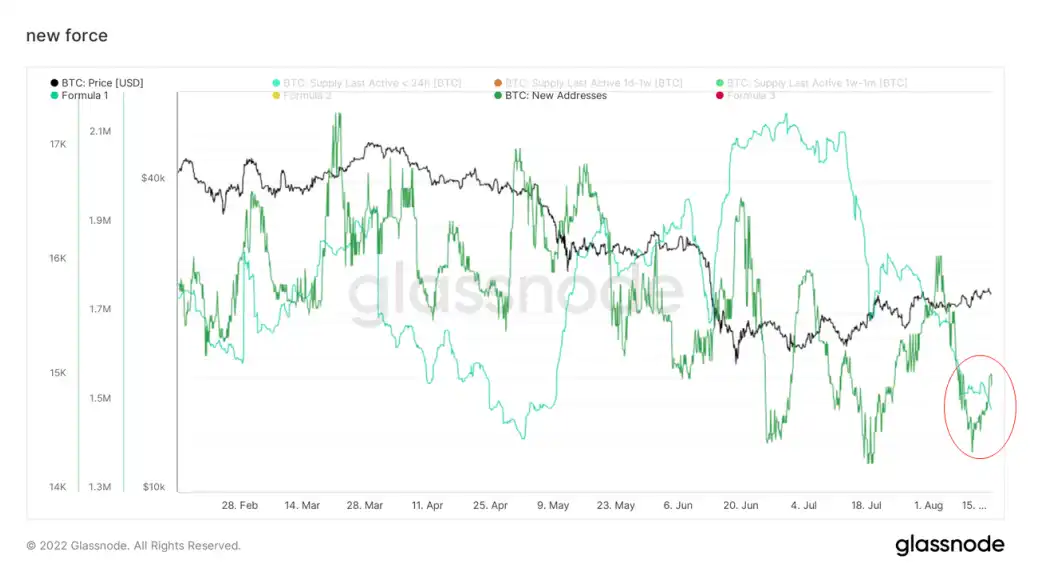
The new force is weakening, but the increase in the number of new addresses may mean that the current new users are waiting and watching.
Net position rating: buyers and sellers are hovering and stalemate, purchasing power is decreasing, The stock game is fierce.
(Stablecoin net position in the figure below)

USDT has a large outflow, USDC shows a weak outflow, and the purchasing power is reduced, prompting a fierce game of memory.
(BTC trend net position in the figure below)

(ETH trend net position in the figure below)

From the above net positions of BTC and ETH,
BTC is weakly out of the trading platform,
ETH is weak Flowing into the trading platform,
Overall, it is in a state of accumulation.
But there is no obvious trend in the medium term, and buyers and sellers are currently in a state of hesitation and stalemate.
Emotional state rating: "bullish" sentiment in the short to medium term, but growth slows Ease
(the monthly change slope of the number of addresses above 1BTC and 10ETH in the figure below)
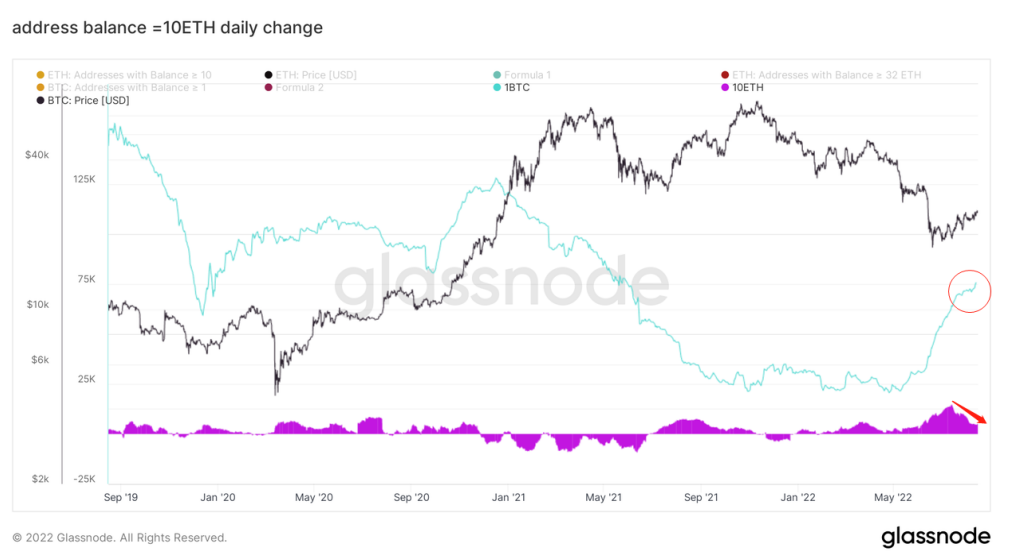
Blue line: 1BTC monthly change slope
Purple area: monthly change slope of 10ETH
From the perspective of 1BTC slope, the addresses above 1BTC are still growing within a few months, with a small range.
From the slope of 10ETH, the address of 10ETH shows signs of slowing down within a few months, and the range is relatively large.
(The HODL ratio has been achieved in the figure below)

The Realized HODL Ratio is a market indicator that uses the ratio of Realized Cap HODL waves,
Take 1 week and 1-2 years to achieve Cap Ratio for HODL bands.
Preliminarily judge the ratio of ultra-short-term traders and long-term traders to measure speculative sentiment.
It is currently in a stage of lack of speculative sentiment, which corresponds to a weaker new force.
In view of the emotional expression of ETH2.0 expectations on the news surface, let's take a deep look at the status of equity pledges on the chain.
(The total stake amount of ETH2.0 in the figure below)

Currently, the total amount of ETH2.0 pledged rights on the chain has reached 1.33 million ETH, but the slope has not increased significantly in the short to medium term.
(The ratio of ETH to BTC option open interest in the figure below)
< br>
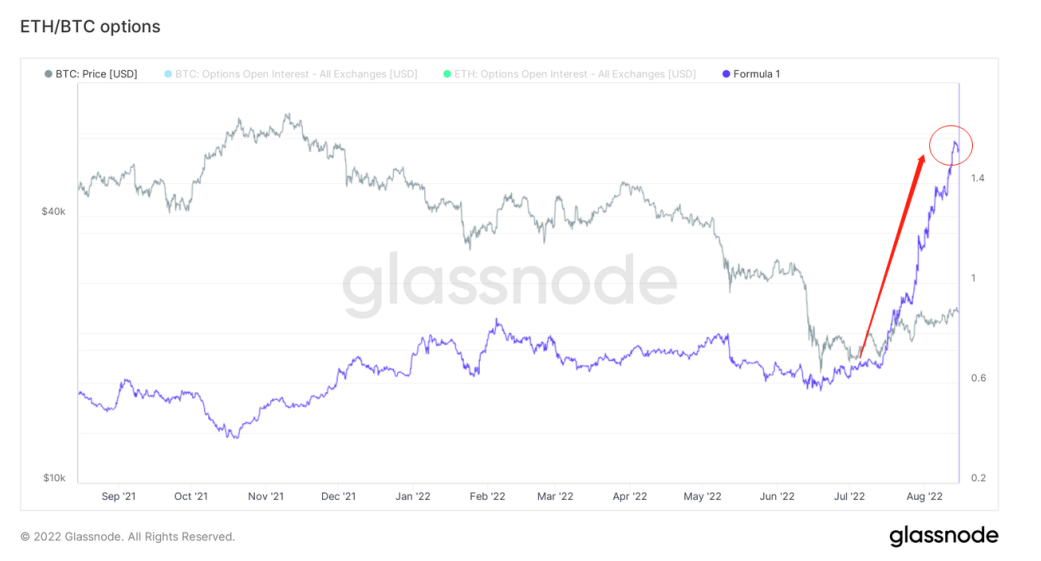
The ratio of options open interest on ETH to BTC rose sharply and is now slowing down.
The expectation of ETH2.0 may prompt some options traders to bet bullish in the short to medium term.
For details, please refer to the "Derivatives Rating" section of short-term observation.
On the whole,
1. The bullish intention driven by the expectation of ETH2.0 is more reflected in the short-to-medium term option trading market, and some option traders bet on bullishness;
2. ETH2.0 equity pledge reflects long-term holding, or users who firmly hold ETH, the current state of steady growth, the slope has not risen sharply.
A preliminary conclusion can be drawn,
ETH has some bullish intentions in the short to medium term, and long-term holders who choose "ETH2.0 equity pledge" are not affected by "ETH2.0 expectations".
Short term observation
ETH, BTC option open interest
ETH put/call option open interest
ETH exercise Price
ETH Smile Curve
BTC put/call option open interest
BTC/ETH perpetual Futures Open Interest
ETH Futures Term Structure
BTC futures term structure
Long liquidation advantage
Profit transfer amount
profit and loss selling volume
global time zone purchasing power
Stablecoin balance
Stablecoin net position
Derivatives rating: BTC, ETH bet bullish The trend is slowing down
Options market:
(Open interest of ETH and BTC options in the figure below)
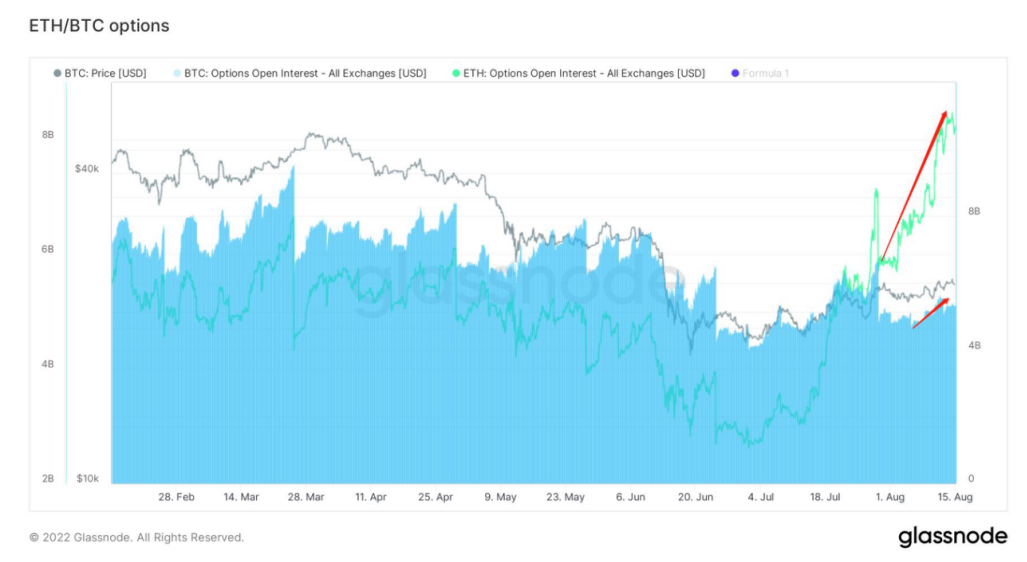
BTC, ETH options open interest, the current Ethereum options open interest continues to rise to about 8.1 billion US dollars, Bitcoin The open interest of Ethereum options is currently about 5.3 billion US dollars, and the open interest of Ethereum options is nearly 1.5 times that of Bitcoin options. This is the first time in historical data and it is also a new beginning.
This represents that mature investors have made a large bet on ETH in the near future due to the expectation of the merger of Ethereum.
(ETH put/call option position in the figure below)
< /p>
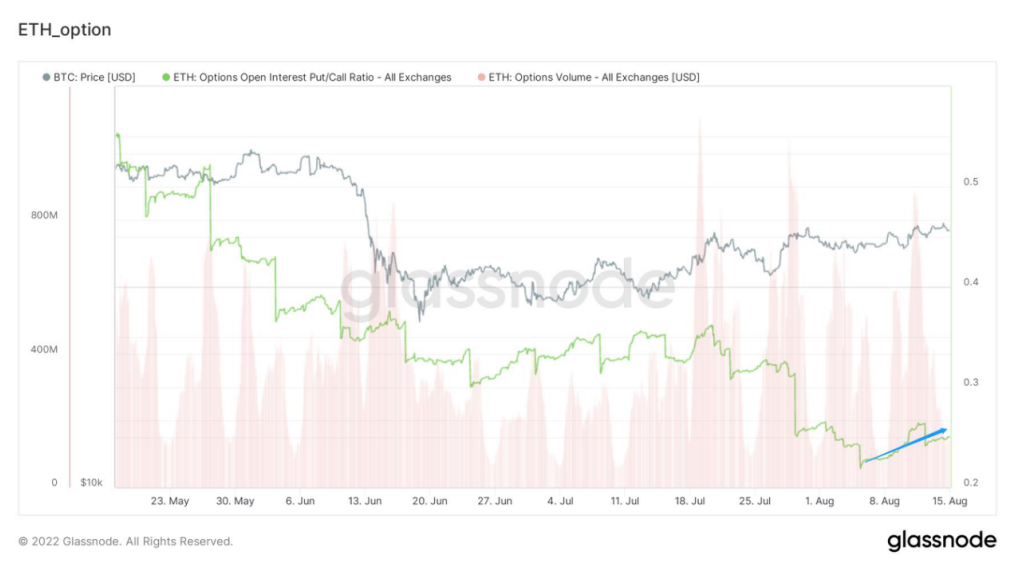
The current Ethereum put/call option position ratio is about 0.24.
In terms of proportion, options betting on the future of Ethereum account for a relatively large majority.
Judging from the recent trend changes, the ratio has increased slightly, which means that the volume of options that continue to bet on the bullish market outlook has begun to slow down recently, and there is even a possibility of a slight increase in the put options to hedge market risks.
(The strike price of ETH on September 2 in the picture below)
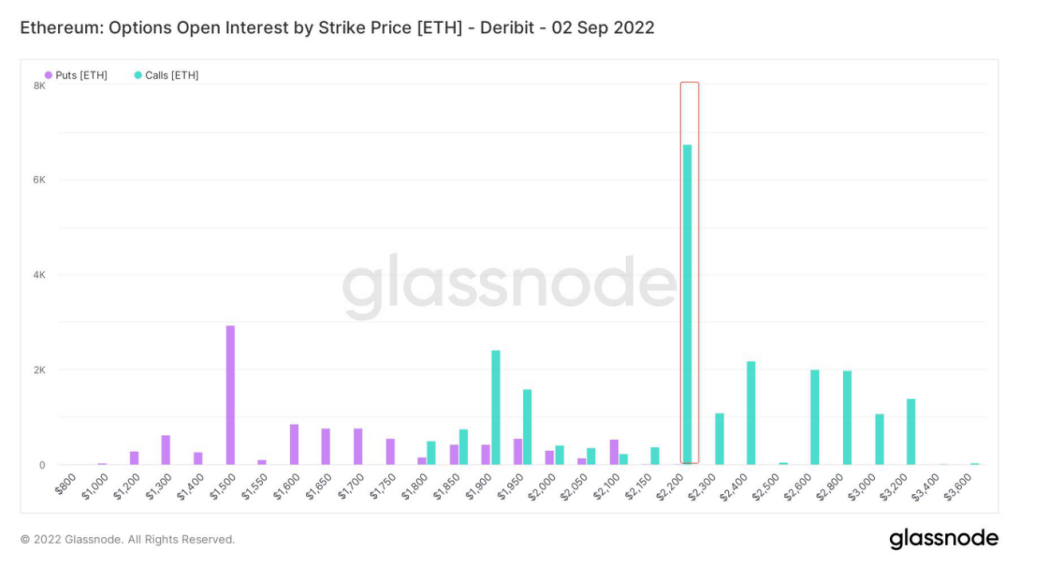
(The strike price of ETH on September 30 in the picture below)

The exercise date of Ethereum options in September is closer to September 15th, the expected time node for the merger of Ethereum in the market.
Specifically, for the exercise price of Ethereum options on September 2 and September 30, the relatively concentrated point that is closer to the current price is 2,200 US dollars.
(ETH September 30 smile curve below)
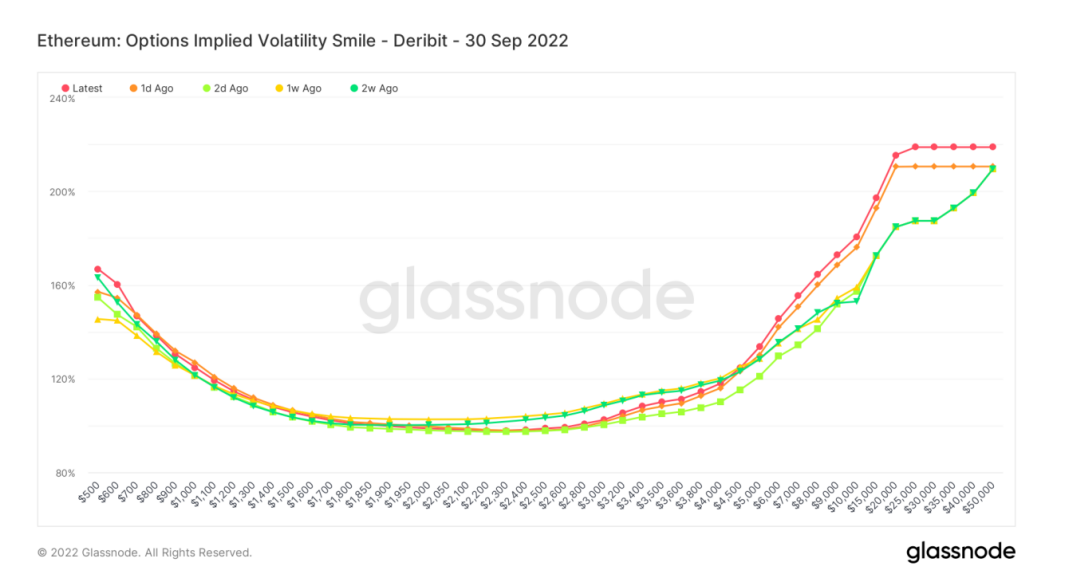
< p ql-global-para="true" line="DT1j" linespacing="115">Volatility Smile Curve:
describes the Implied volatility of options with different strike prices.
Higher-priced options have higher implied volatility, so the graph shows the typical "smiling" shape.
The steepness and shape of this smile can be used to assess how expensive options are relative to one another and to gauge the type of tail risk reflected in the market.
Usually, the probability of options being in deep real value and deep virtual value is low. According to the characteristics of the decision weight function in prospect theory, investors tend to overestimate small probability events and give too high decision weight to small probability events .
In addition, the expected value in prospect theory is jointly determined by the "value function" and "decision weight".
Therefore, when investors give too much weight to the deep real value and deep virtual value of the option, it will lead to the high expected value of the option, which will cause the option price to be overestimated and implied volatility will appear The phenomenon of smiling.
From the implied volatility smile curve on September 30, it can be seen that the current merger expectation of Ethereum has caused some traders to overestimate small probability events and give excessive decision weight to extremely high prices.
(The smile curve of ETH on October 28 in the picture below)

From the implied volatility smile curve in October, the right tail drops sharply, willing to make a higher valuation for the extreme high price of Ethereum There is a noticeable slowdown in willingness, which indicates that after the merger expectations, the demand for Ethereum has weakened significantly compared to the current one.
(BTC put/call option position in the figure below)

The put/call option position ratio for Bitcoin is currently about 0.51.
From a proportional point of view, put option positions are smaller than call option positions.
From the trend point of view, the ratio has risen slightly recently, which also means that the continuous bullish betting trend has signs of slowing down.
Futures market:
(below BTC/ETH perpetual futures open interest)

At present, the open interest of Bitcoin perpetual futures is about 8.3 billion US dollars, and the open interest of Ethereum perpetual futures is about 6.3 billion US dollars.
Similar to the trend of open interest in the options market, investors' bets on the futures market are also gradually rising recently.
( ETH futures term structure below)

Ethereum futures term structure, until January 23, is in a state of futures discount, that is, the price of the near-term contract is higher than the price of the forward-month contract.
It is possible that traders are hedging their exposure to Ethereum before the merger in case technical or other possible events affect the merger.
At the same time, this means that the demand in the near future is greater than the supply, and the price of the near-term contract has a greater increase than the price of the forward contract.
"Futures discount" is a structure of near high and far low, which is destocking.
If the near-end price is very high, when it reaches a certain level, the demand will be activated. Traders can borrow other people's inventory and sell it at the near-end, while locking in the far-end price.
Because the price is lower, the price at the far end is locked and the stock is replenished and returned. This also constitutes a risk-free arbitrage of destocking. Therefore, the price structure of "futures discount" can theoretically restrain demand.
( BTC futures term structure in the figure below)

Bitcoin’s futures term structure is in contango, with traders having to pay a slight premium to gain exposure to future rock sugar oranges. This is a relatively common situation in the rock sugar orange market, with a lower premium towards the end of the year.
Short-term conservative, long-term slightly bullish.
(The advantage of long liquidation in the picture below)
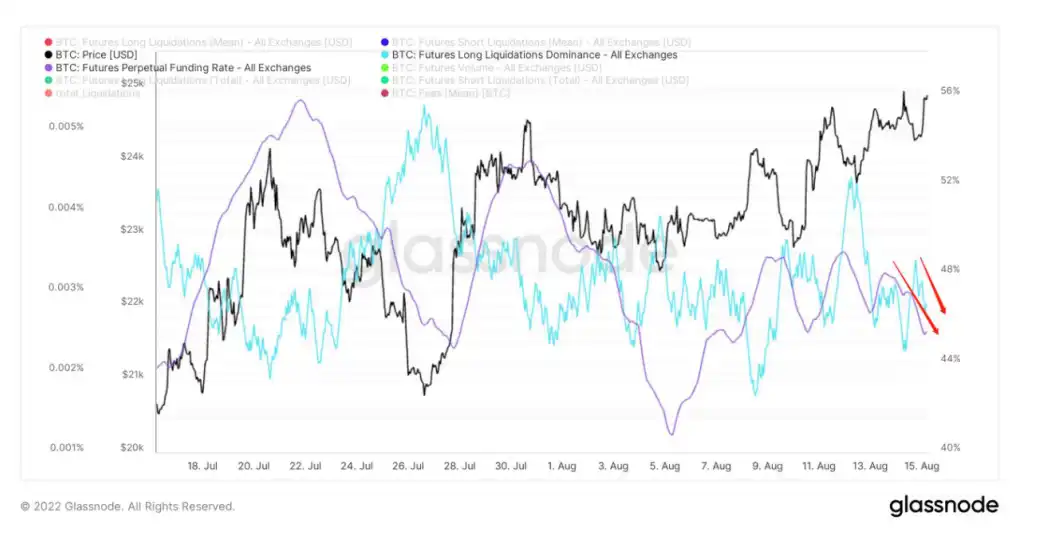
Blue: Long liquidation advantage.
Purple: funding rate.
The current bull liquidation advantage is about 46.6%. Recently, the fluctuation range of this indicator is small, and there is no obvious trend direction.
The comprehensive funding rate fluctuates within a certain space, and traders in the derivatives market have not made any obvious bets on Bitcoin in a certain direction recently.
Spot Market
Market State: Profit Selling Volume Falls
(the amount of profit transfer in the figure below)

Purple: profit transfer volume
yellow : loss transfer amount
orange: active address.
Recently, the main active addresses are biased towards profit transfer. At the same time, the sentiment of profit-making selling has reached a local high point and has begun to fall. The state of profit-making selling from the short-term market shows signs of slowing down slightly.
(Profit and loss selling volume in the figure below)

Red: Sell at a loss.
Green: Sell at profit.
Recently, the volume of selling at a loss has continued to decline, while the volume of selling at a profit is also at a local low position.
This means that traders tend to wait and see in the near future. When these two indicators are at a low position and then rise at the same time, it indicates that there will be greater fluctuations in the market in the future.
Purchasing power rating: continued slowdown
(Purchasing power of the global time zone in the figure below)

The purchasing power of the American time zone has dropped significantly,
Purchasing power in European time zone began to slow down,
Purchasing power in Asian time zone continued to pick up.< /p>
Usually, the reference weight of purchasing power in European and American time zones is slightly higher. On the whole, there are certain differences in the purchasing power of global time zones. Compared with the previous continuous increase in purchasing power, funds have entered a slowdown stage.
(Stablecoin balance in the picture below)< /p>

The balance of the Stablecoin trading platform has continued to decline recently, and the recent market promotion is mainly supported by stock funds.
(Stablecoin net position in the picture below)

The net position of Stablecoin is currently showing a trend of outflow, and the funds on the market are beginning to flow out, so attention should be paid Funding intentions began to shift.
Off-chain data rating: 23,450 USD has purchasing power
< p ql-global-para="true" line="f3bY" linespacing="115">(Binance trading platform order book below)

Binance has a touch of buyer pending orders around $23,460, and a touch of seller pending orders around $25,300.
(Bitfinex trading platform order book below)

Binance has a buyer pending order around $23450
(Coinbase trading platform order book in the picture below)

Coinbase buy and sell orders are scattered.
This week’s summary:

Message Summary:
1. The biggest hot spot this week is undoubtedly the merger and fork of ETH. Judging from the voice of the market, most people are optimistic about this event, but the best stories often deceive more people. Please Always pay attention to the direction of the market.
2. The second hot spot this week is Tornado's sanction incident, which made the entire market players restless and took self-protection behaviors, and the vision of decentralization encountered obstacles again.
3. Morgan further launched data products on the chain. In the future, encrypted investment research services will produce new innovations. From this perspective, it has been initially confirmed.
From a macro perspective:
As the master of market expectation management, the Federal Reserve has always maintained extremely harmonious communication with the market.
A lot of times, taking advantage of the favorable market recovery, the expectation can be released and the work in hand can be done.
If inflation peaks like this, the capital market will be more volatile, and there will be a lot of capital fiercely scrambling for funds.
The difficulty will be very high at this level, so before November is a critical period.
If you are optimistic, the turning point has already appeared. If you invest in the capital market, you must make two-handed plans.
1. At present, the inflection point has appeared and the global bottom has appeared.
2. Second dip.
3. Will the second dip be lower than before.
The other conditions are unknown, and the corresponding conditions can be matched continuously based on probability and certainty.
2020 and 2022 are years of intense gate opening and closing, and many routinely unforeseen things are bound to happen.
The macro will get trickier.
Long-term insights on the chain:
1. The proportion of long-term investors has reached more than 80% of the highest level in 2019.
2. ETH has dropped to the highest computing difficulty ever.
3. DeFi continues to slump and needs a way out.
4. The monthly activity is still sluggish, which is in stark contrast to the continuous progress of the institution.
Market tone:
Cooling hand change.
Interim exploration on the chain:
1. The trading sentiment on the floor has slowed down;
2. ETH may have a higher influence weight than BTC in the short to medium term;
3. The selling pressure of high age and high currency volume slowed down during the month, and the market value of BTC rose slightly;
4. The new force is slightly weaker, and they tend to wait or wait and see;
5. Speculative sentiment Weaker;
6. The purchasing power is weakened, and buyers and sellers are at a stalemate;
7. "ETH2.0 bullish expectations" are reflected in the short-to-medium term options market, "ETH2.0" long-term pledge users have not been greatly affected, Continue the previous growth state;
8. The growth of BTC high-quality addresses is still rising, and the growth of ETH high-quality addresses Growth slowed.
Market setting:
Wandering, wait and see
From the current situation, the market growth is slowing down and the power is slightly weak;< /p>
However, in the context of "ETH2.0 expectations", there are short and medium-term bets on ETH in the options market. Those who need to be alert to fluctuations.
On-chain short-term observation:
1. The open interest of Ethereum options is about 1.5 times that of Bitcoin.
2. A large proportion of Ethereum options positions are bullish.
3. The exercise price of Ethereum in September is concentrated at 2,200 US dollars.
4. Ethereum has bullish demand in September and slowing down in October.
5. The recent bullish trend in Bitcoin options has slowed down.
6. The recent demand for Ethereum is greater than the supply.
7. Bitcoin is conservative in the short term and slightly bullish in the long term.
8. Profit selling reached a local high point, and profitability was slightly weak.
9. Purchasing power began to slow down.
10. Off-chain data has purchasing power at around 23,500 US dollars
11. The probability of not breaking through 29000~35000 is about 63%
market tone:
Bet on a slowdown in the bullish trend, with profit selling sentiment reaching local The high point fell back, and the financial momentum declined.
Risk warning:
The above are market discussions and explorations, not directional opinions on investment; please be cautious and prevent market black swan risks.
This article is from a contribution and does not represent the views of BlockBeats.
Welcome to join the official BlockBeats community:
Telegram Subscription Group: https://t.me/theblockbeats
Telegram Discussion Group: https://t.me/BlockBeats_App
Official Twitter Account: https://twitter.com/BlockBeatsAsia

 Related Articles