Can the post-midterm U.S. stock market rebound overcome the hurdles of war and oil prices?
TL;DR
·Across the 19 midterm elections since 1950 tracked by Strategitz, the S&P 500 rose in the 12 months after every election, with a median gain of 15.1%, but divided government showed no clear additional return advantage.
·Democrats' pre-election advantage in retaking the House is clear; given historical polling bias in Republican-leaning states, Strategitz judges the Senate race as closer to a 50-50 toss-up.
·A change in congressional control can block legislation, increase investigations and constrain appropriations, but it is hard to eliminate the uncertainty of the president advancing tariffs and foreign policy through executive power.
·The market has already priced in to a large extent the scenario of Democrats winning both chambers; if Republicans hold the Senate, banks, industrials, defense and data-center real estate could see a reversal-driven recovery.
·The biggest post-election risk comes from the Iran war: another rise in oil prices could push up inflation and interest rates, weakening the post-election rally that is historically common.
·The December funding deadline, the 2027 debt ceiling, and post-election policy toward Iran will determine whether political uncertainty can truly fade.
Democrats' House Advantage Is Clear, but the Senate May Still Be Overestimated
On November 3, 2026, U.S. voters will elect all 435 House seats, 35 Senate seats, and governors in 36 states. Trump himself is not on the ballot, but his economic performance is being tested.
The Iran war that began in late February has brought shipping through the Strait of Hormuz to near standstill, gasoline prices are up about 34% year over year, and the president's approval rating has fallen to about 38%. The cost of living, the war and the ruling party's electoral fortunes are thus intertwined.
As of October 29, Kalshi and Polymarket put the probability of Democrats retaking the House at about 91% to 93%, and the probability of winning the Senate at about 67% to 68%. Democrats winning both chambers has become the single most favored scenario in prediction markets. However, the Senate race still has considerable variables, and the market may be overestimating Democrats' advantage.
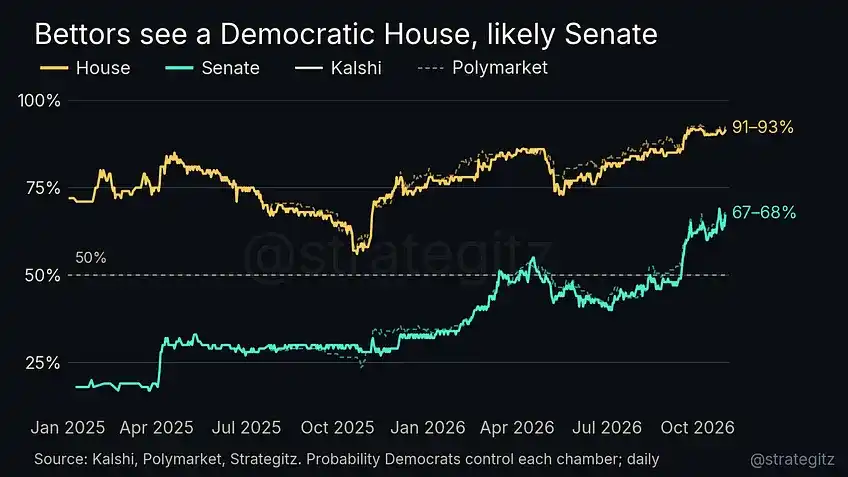
Prediction markets clearly favor Democrats retaking the House, and Senate win odds have also risen before the election.
House members serve two-year terms, with one member elected per district, and 218 seats are needed for a majority. The Senate has 100 seats, two per state, with six-year terms, and about one-third is usually up for election every two years. This cycle also includes special elections in Ohio and Florida. Democrats and the independents who vote with them currently hold a combined 47 seats and need a net gain of four seats to secure a majority even with the vice president casting tie-breaking votes for Republicans.
Midterm elections are typically unfavorable to the president's party. Historical statistics show that since 1946, the ruling party has lost House seats in 18 of 20 midterm elections, with an average loss of 26 seats. The exceptions were 1998, when Clinton faced an impeachment offensive, and 2002, under the Bush administration following the "9/11" attacks.
As of late October, RealClearPolitics (RCP) listed 227 House seats as leaning Democratic, 182 as leaning Republican, and 26 as too close to call, of which 19 are held by Republicans. RCP's aggregated forecasts point to a net gain of about 25 seats for Democrats. Under this distribution, even if Democrats lose most of the toss-up districts, they still have a chance to secure a majority.
The Republican counteroffensive relies on redistricting and campaign funding. Redistricting can improve seat conversion efficiency by concentrating opposition voters and dispersing the party's own voters. According to Cook Political Report estimates cited by Nomura, this round of redistricting could yield a net gain of zero to eight seats for Republicans; Goldman Sachs also judges it to be "only a few seats."
The funding advantage is more direct. According to Goldman Sachs, Republicans' spending advantage in Senate races has exceeded $200 million. In the House, although Democrats lead in total fundraising in key races, they hold an advantage in only seven of 22 toss-up races in head-to-head fundraising comparisons. These factors are enough to narrow the gap, but may not offset the pressure from high gasoline prices and the president's low approval rating.
The Senate map is more complicated. This cycle, Republicans need to defend 22 seats and Democrats 13. RCP lists 13 of these as leaning Democratic, 13 as leaning Republican, and nine as too close to call. Key battlegrounds include Texas, Alaska, Iowa, and Ohio, states whose Republican lean in 2024 was about 10 to 12 percentage points higher than the national level.
The rise in Democrats' Senate win probability has mainly occurred in recent months: Kalshi pricing rose from 23% at the start of the cycle to 32% in January 2026, 44% in June, above 50% in mid-September, and briefly reached 69% on October 23. Goldman Sachs cautions that historically, at similar points in time, prediction markets have on average overstated by about five percentage points the probability that the party challenging the ruling party would sweep both chambers.
Polling error also warrants vigilance. Strategitz compared the final RCP average polls in Senate races with actual results where data were available since 2014, and found that errors did not always point in the same direction.
In 2016, 2020, and 2024, when Trump himself was on the ballot, polls in competitive Senate races on average overstated Democratic support by 3.5 percentage points, with 87% of races showing a deviation in that direction. The 2018 and 2022 midterms were the opposite, with the relevant samples on average understating Democrats by about one percentage point, including an understatement of 3.6 percentage points in 2022. These errors cannot be directly mixed with errors derived by other institutions using different samples.
Even more concerning are states with a Republican advantage. In the 26 midterm Senate races from 2014 to 2022 where the Republican lean exceeded five percentage points, polls on average overstated Democratic support by 4.6 percentage points; swing states and states with a Democratic advantage did not show the same pronounced bias. Goldman Sachs data going back to 2002 also found a similar relationship.
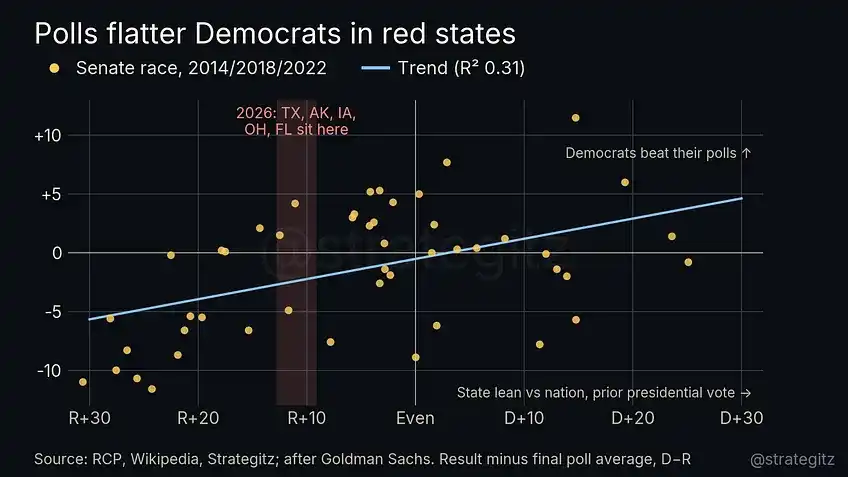
In the historical sample, states with a stronger Republican lean were more prone to polls overstating Democratic support.
Adjusting according to this historical relationship, the gap in some key states could shift toward Republicans by about 2.5 percentage points, enough to change the leader in Texas and Alaska and expand the Republican advantage in Iowa. If the larger error from years when Trump himself was on the ballot is used as a stress test, the calls in Michigan, Maine and Ohio could also change. This is a sensitivity analysis, not a prediction of actual voting results.
Early voting provides another set of evidence for Democrats. Strategas observed that, compared with Republicans, Democratic early-voting performance in Texas and North Carolina improved by 15.6% versus 2022, and Ohio improved by 17.5% versus 2024. Bespoke calculated that early-voting volume in five large Texas counties reached 89% of 2024 levels, while Republican-leaning rural areas were at about 69%. However, Republican voters may also be more likely to choose to vote on Election Day itself, and early voting cannot be directly equated with final vote totals.
Taking these factors together, Strategitz judges that the Democratic advantage in the House is already quite clear, while the Senate is closer to a 50-50 toss-up rather than the roughly two-thirds win probability priced by the market. If this judgment is wrong, the most likely explanation is that early voting did indeed capture a Democratic mobilization advantage.
Gasoline hit the campaign, but a change of control in Congress cannot freeze executive power
War affects votes through the cost of living, and gasoline is the most direct transmission channel.
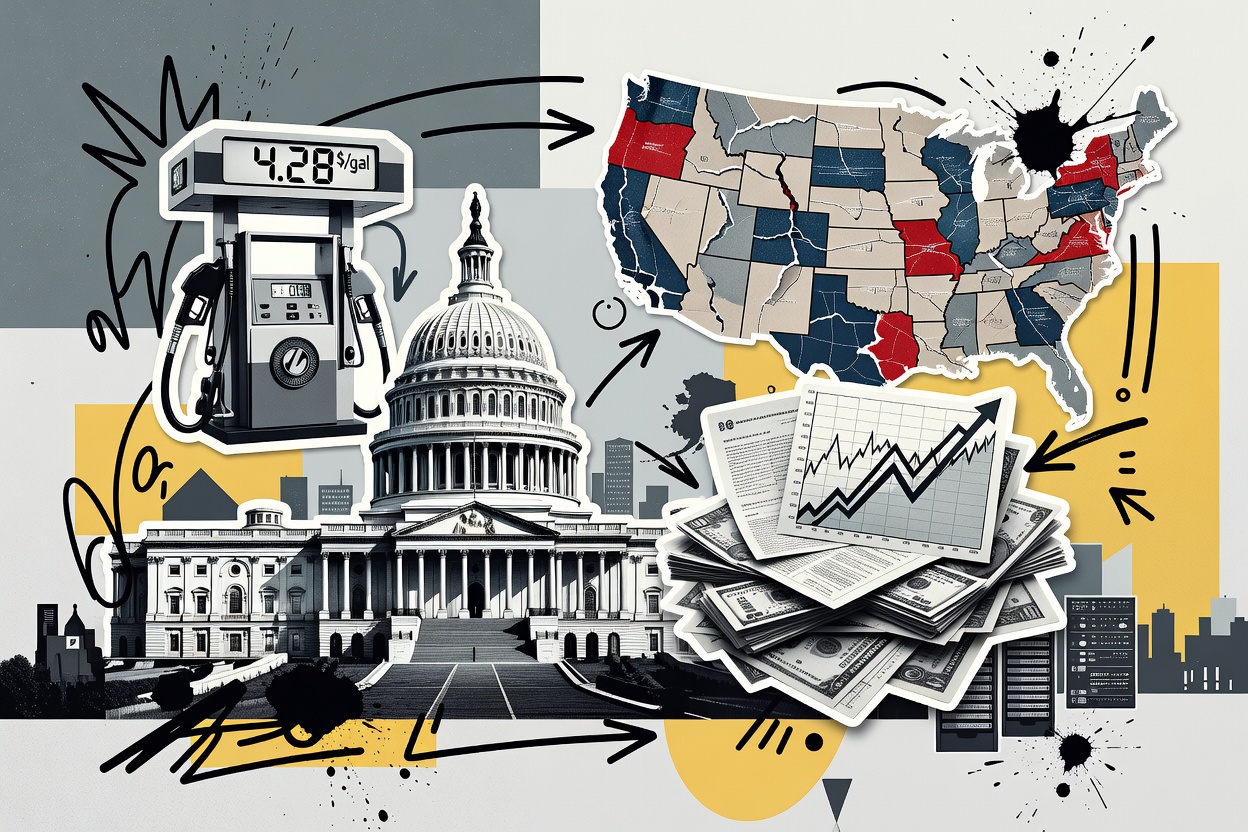
The gasoline consumer price index rose 34.2% year on year in September. Since 1946, only the 1974 midterm election year saw a larger increase, at 40.5%; that year, after Nixon resigned, Republicans lost 48 House seats. On October 26, the average price of regular gasoline was $4.27 per gallon, up from $2.80 at the start of January.
Strategitz calculated that in the 12 midterm elections when gasoline prices rose year on year, the president's party lost a median of 44.5 House seats; in the eight when gasoline prices fell, the median was 15.5 seats. But gasoline prices can explain only about 13% of seat changes, and using them alone to predict election results is unreliable.
Presidential approval ratings have stronger explanatory power. According to Gallup historical data, when a president's approval rating reaches or exceeds 50%, the median seat loss for the incumbent party is eight seats; when below 50%, it is 30 seats. As of late October, Trump's average approval rating in the RCP aggregate was 38.4%, with some polls lower.
A simple model constructed by Strategitz incorporating both approval ratings and gasoline prices points to Republicans losing about 51 seats, but the range covering 80% of outcomes is as wide as 23 to 78 seats. It reveals the headwinds facing the governing party, but also shows that a few macro variables alone cannot precisely project seat counts. Morgan Stanley Wealth Management in mid-September simultaneously observed national party vote intention, presidential approval, consumer confidence, and gasoline prices—all four indicators favoring Democrats. As of late October, Democrats led by 8.2 percentage points in the RCP national party vote intention aggregate.
A change in congressional control would alter how policy is advanced, but would not halt the president's executive authority.
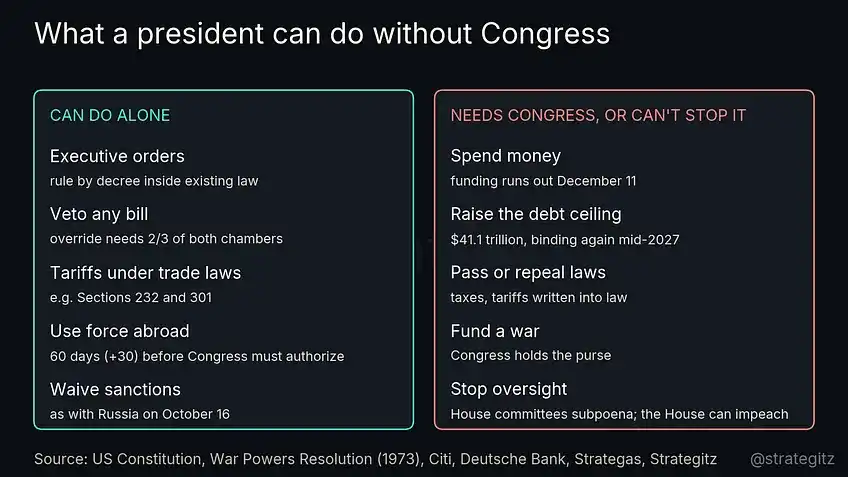
The president retains powers such as executive orders and vetoes, while appropriations, the debt ceiling, and legislation require congressional participation.
The new Congress will be sworn in on January 3, 2027. The roughly two months prior constitute the old Congress's "lame-duck session"—the legislative window after the election and before members transition—during which the outgoing majority party may still attempt to pass major bills.
If Democrats control even one chamber, they can block tax cuts, immigration reform, and plans to codify tariffs into law that require congressional passage. However, the president can still advance policy through executive orders and existing legal authorities. After the Supreme Court struck down tariffs based on the International Emergency Economic Powers Act (IEEPA), the administration is using other trade laws to rebuild tariff measures. Morgan Stanley accordingly emphasizes that since January 2025, much policy uncertainty has originated from the executive branch, and congressional elections cannot automatically eliminate such risks.
The president also retains veto power, and overriding a veto requires two-thirds support in both chambers. After the congressional transition, neither party is likely to achieve such a majority.
The area of greatest change is appropriations and oversight. With Democratic control of the House, the party can constrain government programs through budget negotiations and strengthen oversight using committee investigative and subpoena powers. Tax bills must originate in the House, and appropriations bills typically also start there.
Existing government funding expires on December 11, so the first test occurs during the old Congress's session. Citi economists expect a December shutdown may be avoided, with the main conflict deferred to 2027. At that point, the $41.1 trillion debt ceiling may re-emerge as a binding constraint mid-year, followed by the September 30, 2027 appropriations deadline.
Strategas says some Republicans want to raise the debt ceiling before the change of administration to reduce the Democrats' future negotiating leverage. If not addressed in advance, PGIM expects the dispute to be particularly intense the following summer. Citi believes the eventual agreement could lead to looser fiscal policy.
Divided government does not automatically mean the deficit narrows. Over the past 12 months, the federal deficit was equivalent to 6% of GDP, and the economy has not yet fallen into recession. In the 1980s, divided control of Congress also failed to prevent the deficit from remaining at about 4.5% of GDP. The fiscal surpluses of the late 1990s, beyond the checks and balances between a Republican Congress and a Democratic president, also benefited from an economic boom and the post-Cold War spending environment. Divided government is more likely to freeze policy than to repair the fiscal position.
19 post-election rallies show no clear "gridlock premium"
In market discussion, a common judgment is that divided government is good for stocks because the two parties check each other and can reduce policy shocks. Strategitz's backtest found no clear support for this.
The backtest covers 19 midterm elections since 1950, using the closing price on the last trading day before the vote as the starting point. Pre-election periods are usually more volatile: from the start of the year to the eve of the election, the median gain for the S&P 500 was only 1.6%; drawdowns occurred in every cycle, with a median maximum drawdown of 16%.
In 2026, as of October 27, the S&P 500 was up 12.6% year to date, but had fallen 9.1% from late January to the end of March, overlapping with the initial shock of the war.
Performance in the 12 months after the election improved markedly. In all 19 samples, the S&P 500 rose, with a median gain of 15.1%; measured from the pre-election low, the median gain was 33.9%. Even in 1986, the weakest performer, it still rose 4% on this basis. However, returns measured from the pre-election low involve the problem of identifying the low after the fact and cannot be regarded as actually replicable buying returns.
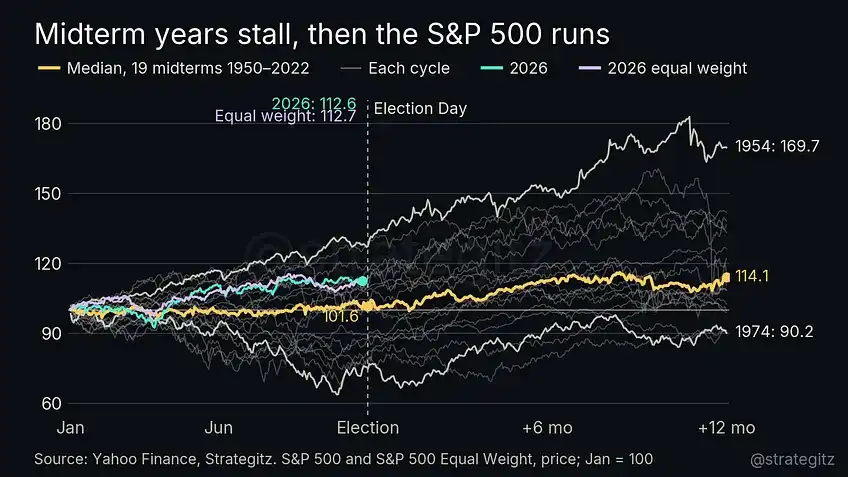
S&P 500 price paths around past midterm elections, normalized to 100 at the start of the year; the 2026 curve is through the pre-election period.
Different measures from other institutions also show similar seasonality. Deutsche Bank calculates that in 21 of the past 23 midterm election years, the market rose in the three months starting in early October. Statistics cited by Brentview show that since 1946, the S&P 500's total return in the 12 months after every midterm election has been positive, averaging 14.4%. These data differ in starting points, samples, and whether dividends are included, and cannot be directly combined.
In shorter windows, RIA Advisors found that in midterm election years, from the close on October 26 to the end of the year, the S&P 500 rose an average of 4.45%; looking only at the nine samples that had already achieved year-to-date gains by late October, the average gain was about 6%, and all closed higher. The nine samples can only provide context, not a forecast for this year's returns.
More critically, the return gaps under different political outcomes do not support a distinct "gridlock premium." In the backtests, the median S&P 500 gains over the 12 months after the election were: divided government, 14 samples, up 13.7%; unified government, five samples, up 16.0%; House flip, six samples, up 13.7%; no House flip, 13 samples, up 16.0%; Republican presidency, 10 samples, up 14.2%; Democratic presidency, nine samples, up 15.1%.
This result suggests that the fading of election uncertainty may deserve more attention than whether the government is in gridlock. However, these statistics themselves cannot prove that the fading of uncertainty caused the stock market rally; the economic cycle, earnings, and monetary policy also affect outcomes.
The reason different studies reach different conclusions partly comes from the observation window. MFS used calendar-year returns for all years since 1933 and found that performance was better when Congress was split between the two parties; if the observation window is limited to the 12 months after midterm elections, that advantage disappears. Morningstar, using about 100 years of CRSP data, found that U.S. stocks performed better during periods of unified government.
Small samples can also be misleading. The claim that "when Republicans control the White House and both chambers, U.S. stocks fell an average of about 10% in the year after midterm elections" comes from only two years: 1931, during the Great Depression, when stocks fell 47%, and 2003, when they rose 26%. Making stable investment judgments on this basis is clearly insufficiently supported.
From the broader presidential term cycle, Robeco cited Fidelity data noting that the second year is usually the weakest year for the stock market and the third year the strongest. But this is still a historical average pattern and cannot replace analysis of the current economic environment.
Other assets also show a tendency toward post-election risk easing. Using the window from the eve of the election to six months later, Strategitz statistics show that in the nine midterm elections since 1990, the VIX volatility index fell seven times, with a median decline of 4.6 points; in 16 samples since 1962, the 10-year U.S. Treasury yield fell 10 times, with a median decline of 20 basis points, or 0.2 percentage points; in 13 samples since 1974, the dollar index fell eight times, with a median decline of 4.4%.
Gold rose in all six samples since 2002, with a median gain of 7.9%. Using monthly data going back to 1974, it rose in ten of 13 samples, with a median gain of 3.5%.
The starting point in 2026 is markedly different. On October 27, the VIX was just 17.5, below the historical median of 23.4 for the same period; Man Group estimates that options priced implied volatility for November 4 at only 1.2 times that of a normal trading day, meaning the risk of a prolonged vote count may not be fully reflected. The 10-year Treasury yield rose 61 basis points to about 5% before the election, the dollar index rose 3.9%, and gold fell 10.1% over the past six months.
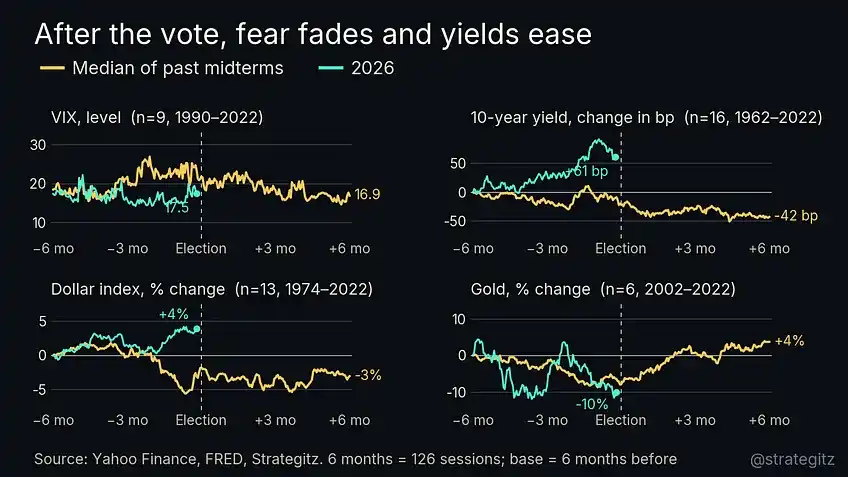
The pre-election moves in Treasury yields, the dollar and gold in 2026 differ markedly from historical midterm election paths.
On bonds, Numera Analytics cited academic research saying that since 1947, excess returns on 10- to 30-year Treasuries have been positive under divided government and negative under unified government. Its explanation is that legislative gridlock may limit new fiscal expansion. If Republicans keep control of both chambers, new borrowing and term premiums may rise. Term premium refers to the extra compensation investors demand for bearing longer-term interest rate and inflation risk; this mechanism also does not mean divided government necessarily reduces the deficit.
Sector trades look at expectation gaps, while the macro direction still depends on war and interest rates
Several institutions share a similar core judgment on the election: Democrats are expected to win the House, the Senate remains competitive; the factors determining the market's medium-term direction remain the economic cycle, the Federal Reserve and war.
JPMorgan believes the midterm elections' impact on credit markets is often smaller than expected, the Fed matters more, and the subsequent focus is the debt ceiling, the defense bill and tariffs retained under executive authority. Goldman Sachs emphasized the probability bias in prediction markets and polling errors in states with Republican advantages.
Morgan Stanley Research believes that regardless of the election outcome, administrative policy and tariffs will continue to affect the market, with the main changes reflected in fiscal and debt ceiling risks. Its wealth management division reminded investors to watch changes in committee powers, as well as healthcare, data center and drug pricing issues.
Citi believes that if Democrats win both chambers and can constrain the executive branch's tariff and war powers, the market may react positively. Deutsche Bank is focused on the December funding deadline and the mid-2027 debt ceiling, while not expecting the Iran war to end soon. UBS reminded that results may take days to confirm; in 2022, control of the Senate and House took four and eight days respectively to become clear.
The key to sector trading lies in the degree to which outcomes deviate from market expectations. Strategas believes that since August 1, US equities have been trading on a Democratic sweep of both chambers. If Republicans hold the Senate, banks, industrials, defense, managed care, and data center REITs could rebound.
Looking at election scenario allocations across multiple institutions, a Democratic sweep is generally seen as favorable for healthcare services and retail, and unfavorable for capital markets-related businesses and some defense names. But these are relative judgments on sector portfolios and cannot be directly extrapolated to individual company stock prices.
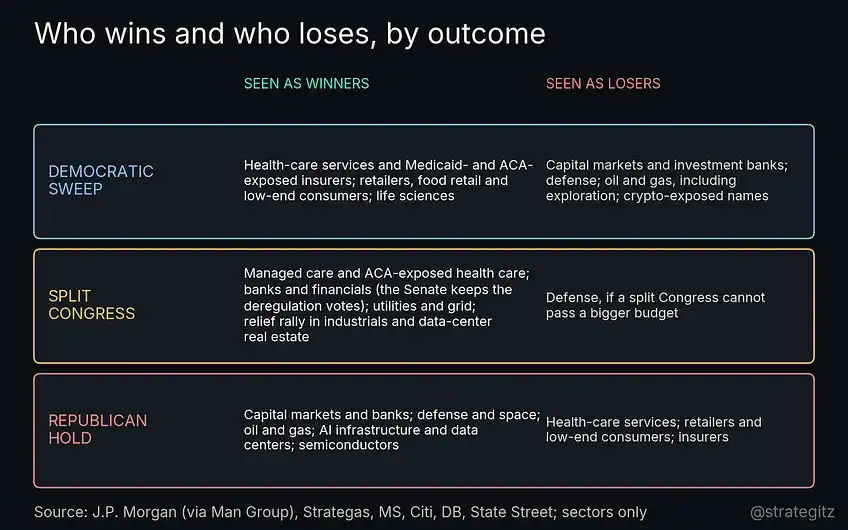
Judgments from multiple institutions on relative sector performance under different election outcomes still show divergence in areas such as defense.
Man Group's calculation of JPMorgan's election portfolio shows that as of October 22, the Democratic portfolio was overweight healthcare services by 48 percentage points and underweight capital markets by 40 percentage points. Citi found that semiconductor stocks moved in the same direction as Republican win probabilities, while insurance, healthcare services, and pharmaceutical stocks moved in the same direction as Democratic win probabilities, though Citi itself questioned the explanatory power of such relationships.
Defense is an area where institutions diverge significantly. JPMorgan and Strategas portfolios treat it as a sector that suffers under a Democratic sweep scenario; Morgan Stanley remains neutral on the relevant Democratic scenario; Deutsche Bank believes a divided Congress could also create pressure. Numera Analytics argues the market may be overly pessimistic, because regardless of who controls Congress, ongoing wars are depleting military inventories.
Strategas also suggests that Republicans may push to raise the debt ceiling and increase defense spending before the transition, which could provide support for the defense sector even if Democrats win. However, passing major legislation during a lame-duck session is not easy.
Historical sector rotation offers another perspective. Morgan Stanley studied midterm elections since 1982 and found that in the 12 months after the election, semiconductors outperformed the equal-weighted market by an average of 39.5 percentage points, software by 17.4 percentage points, and tech hardware by 16.8 percentage points; real estate development, energy, banks, and utilities underperformed by 21.9, 10.7, 8.8, and 7.3 percentage points respectively. Before elections, defensive sectors such as consumer staples, food, and pharmaceuticals typically lead. Citi also observed that post-election capital tends to rotate from defensive sectors into cyclical tech and industrials.
These are historical averages. The energy shock from the 2026 war has already pushed the sector environment away from normal: according to data cited by Morgan Stanley Wealth Management, the energy sector rose more than 40% through mid-September and was up 56% by mid-October.
The reaction of interest rates and the dollar is equally scenario-dependent. Morgan Stanley believes that continued Republican control of both chambers is the main upside risk for increased U.S. Treasury supply and could also boost the dollar. If Democrats secure a relatively solid majority, the focus will shift to short-end rates and the 2027 debt ceiling; if the majority is narrow, policy gridlock and growth concerns could push down long-term yields, and a fragile majority would also increase the risk of a government shutdown.
Strategitz expects a typical relief rally in markets after vote counting concludes, extending support from AI investment, productivity improvements, and economic growth. Post-election rotation into cyclical technology also aligns with this view. But the biggest risk comes from beyond the ballot.
What could truly break the post-election rally is a re-escalation of the Iran war
According to IMF and State Street data cited in the original text, about 60 to 130 vessels normally passed through the Strait of Hormuz each day, but shipping volume plunged to near zero in March and has remained depressed since.
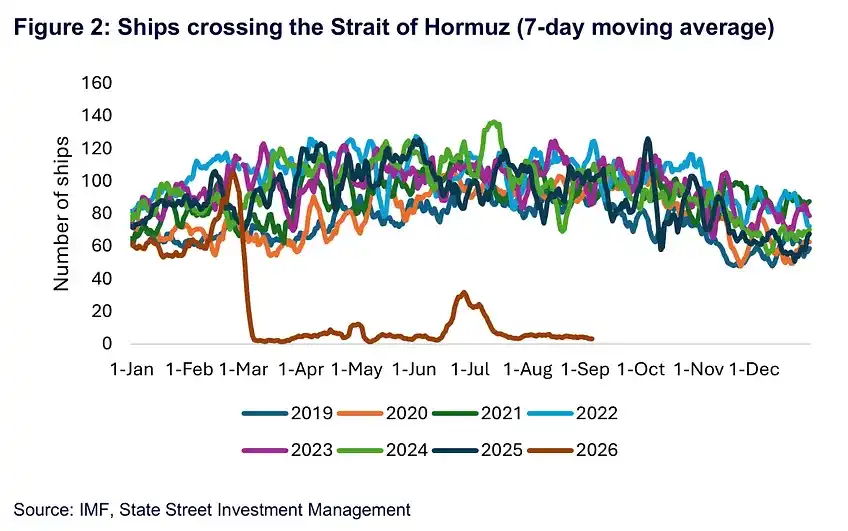
In 2026, vessel traffic through the Strait of Hormuz was significantly lower than in previous years; the charted data runs through approximately the end of August.
Prediction markets also reflect the link between the war and the election outlook. Since May, the market-implied probability that shipping through the strait will not return to normal within 2026 has risen from about 20% to nearly 90%; over the same period, the probability of Democrats sweeping both chambers rose from about 45% to 67%, with a correlation coefficient of 0.83 between the two. Such synchronized moves do not prove causation, but they are consistent with the logic that war pushes up gasoline prices and that cost-of-living pressures weigh on the ruling party's electoral fortunes.
Congress can increase pressure over war authorization and appropriations, but it is difficult to change the course of the war quickly. The War Powers Resolution sets time limits on military action without congressional authorization. In the summer, bipartisan lawmakers pushed through a resolution requiring the president to seek authorization for war with Iran or end military operations. The war continues. A Democratic Congress cannot unilaterally end the war, but it can exert influence by refusing appropriations.
The Ukraine issue also illustrates the tension between congressional legislation and presidential implementation. According to UBS and Strategas materials, the Senate passed a Russia sanctions bill in August with bipartisan support, authorizing tariffs of up to 100% on major buyers of Russian oil, and the House passed the Senate version in September. However, on October 16, two days before the measures were scheduled to take effect, Trump granted Russia an exemption on national security grounds. Congress passing a law does not necessarily mean policy will be implemented as originally designed.
In October, multiple media outlets reported on Russian diesel deals, the so-called "energy ceasefire," restrictions on Ukraine's use of Starlink, and U.S. suggestions that Europe unfreeze Russian assets. These events further highlighted the dominant role of the executive branch in foreign policy.
Louis-Vincent Gave of Gavekal raised a question more worthy of market attention: if a ceasefire arrangement emerges in Ukraine, would it make it easier for the U.S. to escalate actions against Iran? Democratic control of the House could bring more war funding and sanctions votes, more hearings, but does not necessarily mean two wars will end soon.
Before the election, the White House had an incentive to push down oil prices and prevent gasoline prices from further damaging Republican electoral prospects; after the election, this short-term constraint will weaken. Nomura noted that Trump has hinted that if negotiations fail, bombing could resume after the vote. Vincent Deluard of StoneX also worries that after the election, with the White House less concerned about ballots, escalation could push up oil prices and inflation at the moment the Fed least wants to see it.
Gavekal proposed two risk paths: the U.S. demands that Gulf states stop paying extra fees for their oil shipments to Asia, or resumes bombing. In both scenarios, oil prices could be pushed to new highs, while inventories that previously buffered the first round of shocks have been depleted. PGIM flagged the risk that Brent crude could first break above $120 per barrel, then fall back to the $90 to $120 range.
If this scenario materializes, the shock will transmit through oil prices, inflation, and interest rates. With the Fed still raising rates and the 10-year Treasury yield near 5%, a new energy shock could simultaneously weigh on valuations and economic growth.
2018 also reminds investors that short-term declines after elections can still occur due to trade friction and Fed policy concerns. This does not contradict the historical statistic that all post-election 12-month periods showed gains: different observation windows mean short-term drawdowns and positive returns one year later can coexist.
Therefore, post-election watch points include not only the Senate results in Texas, Ohio, Alaska, and Iowa and their deviations from polls, but also the December 11 funding deadline, whether strikes on Iran resume, changes in oil and gasoline prices, and the VIX and 10-year Treasury yield. The APEC-related diplomatic developments on November 18-19 are also a window for observing Ukraine arrangements.
History supports the possibility of risk appetite recovering after election results become clear. But what determines whether this rebound can be sustained will be whether war, inflation, and interest rates allow such a recovery to continue.
Welcome to join the official BlockBeats community:
Telegram Subscription Group: https://t.me/theblockbeats
Telegram Discussion Group: https://t.me/BlockBeats_App
Official Twitter Account: https://twitter.com/BlockBeatsAsia
 Related Articles