CoinGlass: 2025 Cryptocurrency Derivatives Market Report
Source: CoinGlass
Introduction
2025 marks a clear structural inflection point in the evolution pathway of the cryptocurrency market. In this year, cryptocurrency assets transitioned from a phase dominated by edge experimentation to further integration into the mainstream financial system, with structural adjustments seen in market participant composition, trading toolsets, and regulatory environment.
The derivative market saw significant growth in 2025, with the market structure becoming markedly more complex. The early single driving model focused on high-leverage retail speculation was replaced by a more diverse institutional trading demand, ushering in a new stage of "institutional capital dominance, regulatory infrastructure, and parallel evolution of decentralized technology". On one hand, traditional financial capital entered the market in larger scales and clearer compliance pathways through channels such as BTC spot ETFs, options, compliant futures, and mergers and acquisitions, gradually shifting hedging and basis trading demands to on-exchange products, driving the structural rise of CME: surpassing Binance in 2024 to become the world's largest BTC futures open interest platform, CME further consolidated its leading position in BTC derivatives in 2025 and for the first time approached Binance's retail scale in ETH derivatives in terms of open interest and trading participation. On the other hand, on-chain derivatives, based on intent-centric architecture and high-performance application chains, formed a functional alternative to centralized derivatives, especially in specific niche scenarios such as censorship-resistant transactions and composable strategy execution, starting to pose substantial competitive pressure on CEX in market share at the edge.
The increased complexity and deeper leverage chain also raised systemic tail risks. Extreme events that occurred in 2025 posed an unprecedented stress test on existing margin mechanisms, clearing rules, and cross-platform risk transmission paths, with impacts extending beyond the scope of a single asset or platform, requiring a reassessment of the overall robustness of the derivative ecosystem.
It is important to emphasize that the aforementioned changes are just a slice of the 2025 market restructuring. Beyond the macro narrative and extreme events, the rise of Perp DEX, the large-scale expansion of stablecoins, institutional explorations of RWAs, development of DAT architecture, iterative improvements in on-chain prediction markets, and the gradual implementation of major jurisdictional regulatory frameworks collectively formed the multidimensional background of this year. These internal structural evolutions intertwined with external shock events, painting the overall picture and analytical starting point of the 2025 cryptocurrency derivatives market.
Market Overview
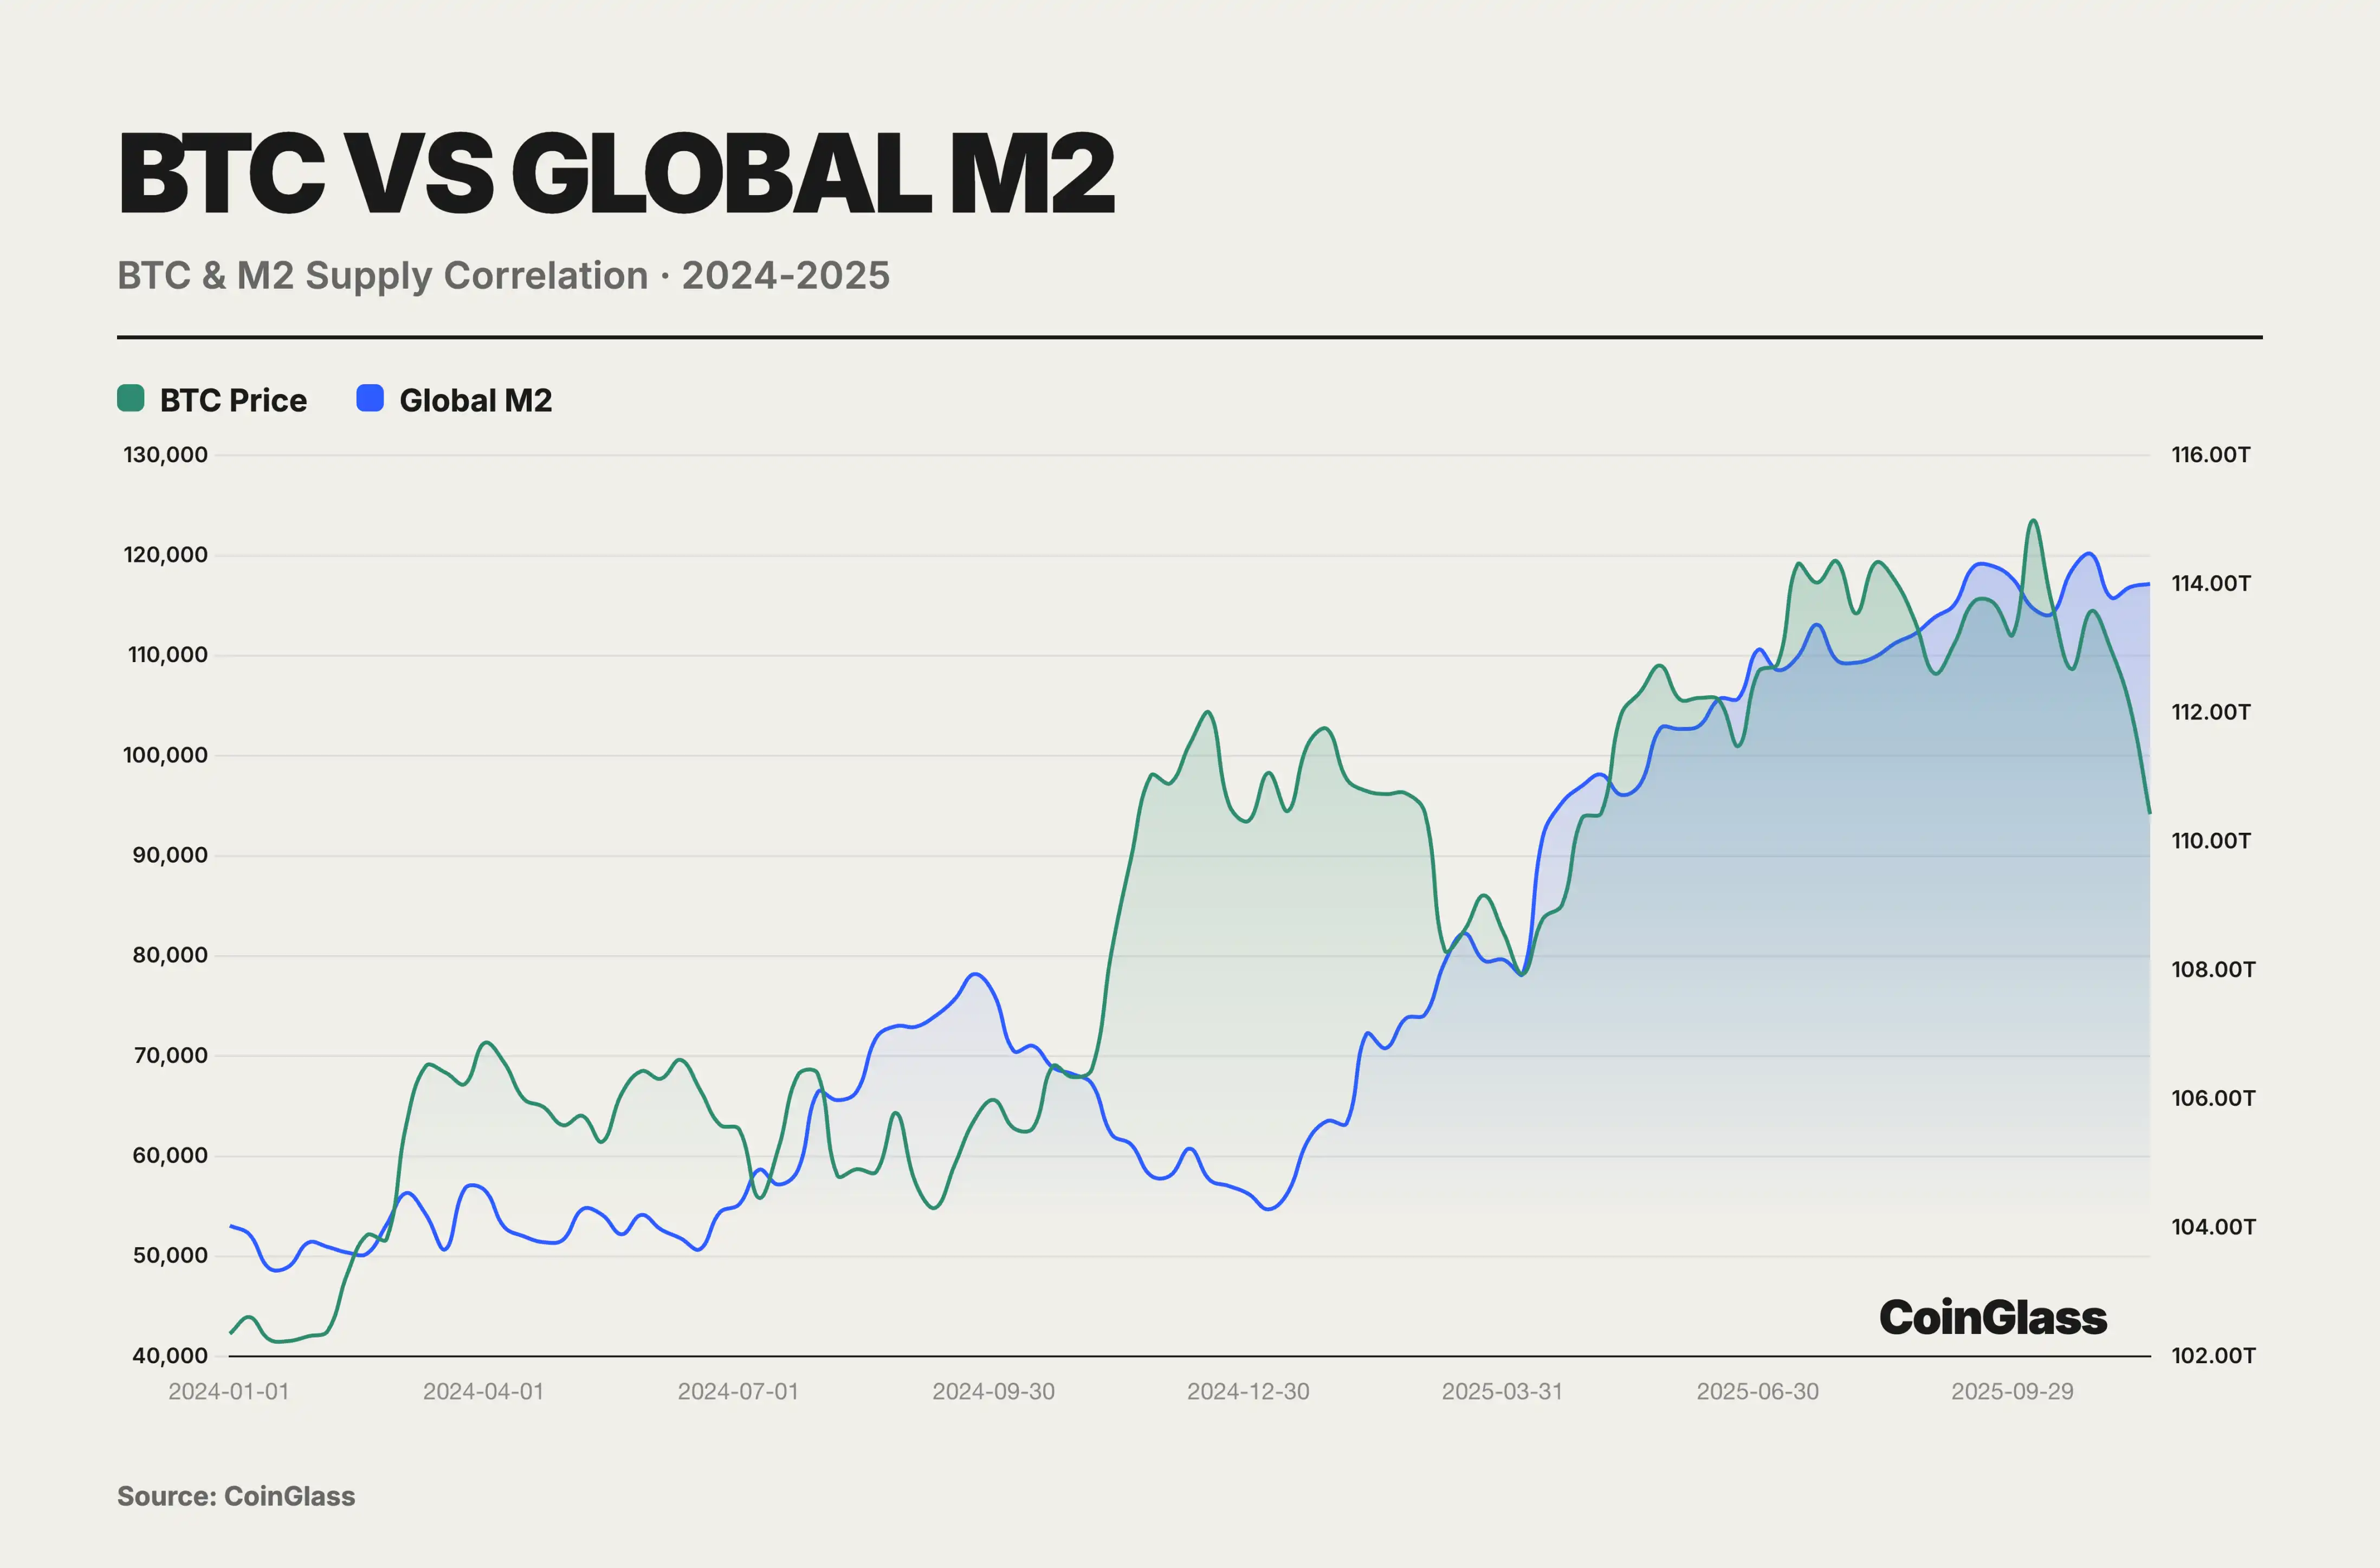
During the 2024–25 period of easing and bull market, BTC became closer to a High-Beta risk asset rather than an independent inflation hedge tool. Its full-year correlation with global M2 of 0.78 masked a structural decoupling in the second half of the year, and the November sell-off validated its nature as a High-Beta risk asset. Buying BTC is not hedging against inflation but rather betting on liquidity. Once liquidity tightens, BTC will be the first to be sold off. Against the backdrop of the Fed starting a rate cut cycle and major global central banks significantly increasing liquidity, BTC surged from $40,000 to $126,000. This excess return fundamentally comes from its 2.5-3.0 Beta coefficient, leveraging a response to liquidity expansion rather than independent price discovery.
Geopolitical and policy uncertainty became a significant market driver in 2025, and the complexity of the macroeconomic environment throughout the year provided a rich trading narrative for the derivatives market. The re-escalation of trade tensions between the U.S. and China, the Fed's difficult balance between rate cuts and inflation, arbitrage trading downturn triggered by the Bank of Japan's monetary policy normalization, and the U.S. government's crypto-friendly policies all intertwined to create a complex macro force, injecting ongoing volatility and deep strategic gameplay into the derivatives market. Overall, cryptocurrency still behaved more as a risk asset and, as a High-Beta risk asset category, demonstrated extreme sensitivity to global liquidity conditions and central bank policy shifts during this year.
In 2025, major jurisdictions exhibited a "converging direction, diverging paths" pattern in crypto derivatives regulation. Under the leadership of the new administration, the U.S. shifted towards a legislative and licensing-focused regulatory framework, incorporating digital assets into the national financial strategy and weakening previous sources of uncertainty based on "enforcement as regulation" through a series of bills including the GENIUS Act. The EU continued to pursue a steady path under existing frameworks such as MiCA and MiFID, focusing on consumer protection and leverage limits, implementing stricter access thresholds for high-leverage retail derivatives. There were significant internal differences in the Asian region: Mainland China continued its high-pressure stance on crypto trading, while Hong Kong and Singapore were positioned as compliance test grounds, competing for institutional pricing and settlement business through licensing systems and product whitelists. Notably, the launch of BTC and ETH perpetual futures on a new exchange signaled the incorporation of some native cryptocurrency products into traditional financial infrastructure. Leveraging a unified digital asset regulatory framework, the UAE accelerated efforts to attract crypto businesses and trading platforms, positioning itself as a regional compliance hub. Overall, regulatory approaches to DeFi derivatives gradually converged towards the principle of "similar business, similar risks, similar regulation," indicating a progressive alignment in compliance requirements between on-chain and off-chain markets.
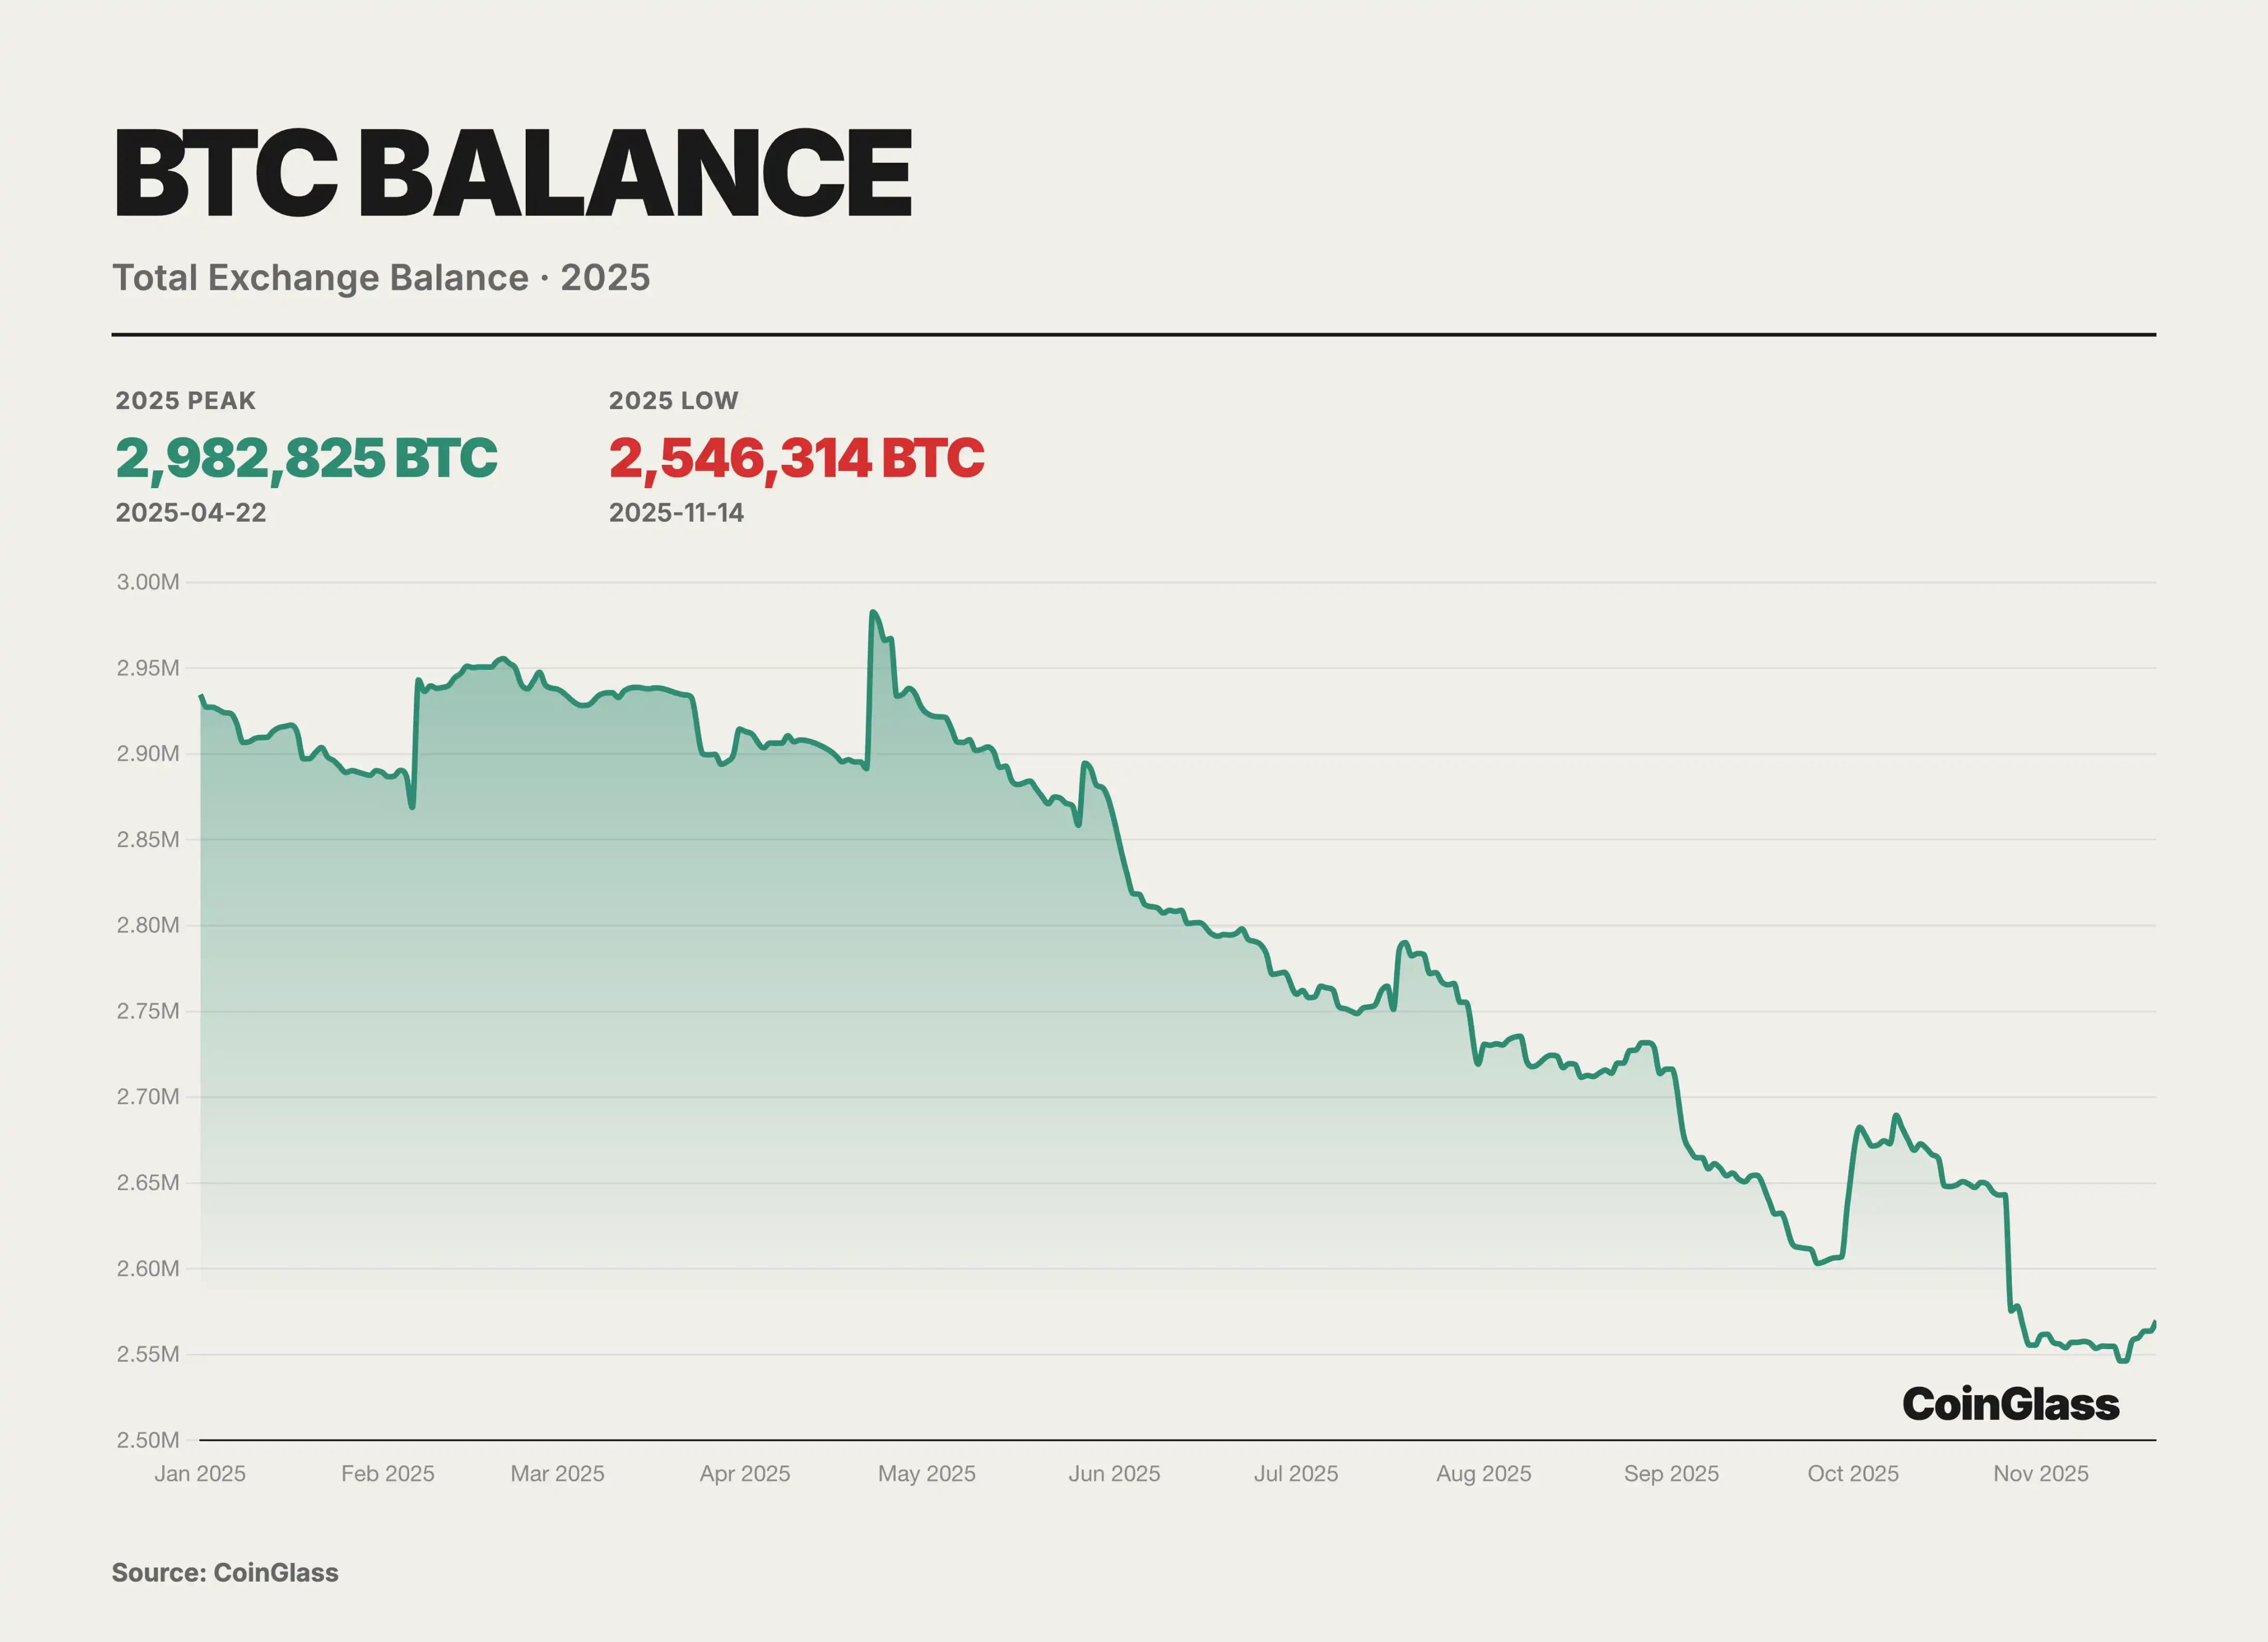
In 2025, BTC showed clear signs of supply rebalancing at the exchange level, with the overall balance of BTC on exchanges exhibiting a stepwise decline, entering a continuous destocking phase from the April peak. CoinGlass data shows that since reaching a peak of around 2.98 million BTC near April 22, exchange BTC reserves have exhibited a stepwise decline over the following months, dropping to around 2.54 million BTC in mid-November, with a net outflow of about 430,000 BTC, a decrease of about 15%.
This destocking cycle more reflects chips migrating from exchanges to self-custody addresses and transaction demand structurally shifting towards the "low turnover, long hold" side, rather than simply reducing short-term selling pressure. As tradable chips continue to move away from the exchange side, during the price uptrend phase, this helps lift the marginal traded price and amplify the pro-cyclical gains. However, it also means that once macro expectations or price trends reverse, if a portion of the reserves that were previously withdrawn from exchanges flows back in a concentrated manner, it could create amplified selling pressure and volatility on thinner order books.
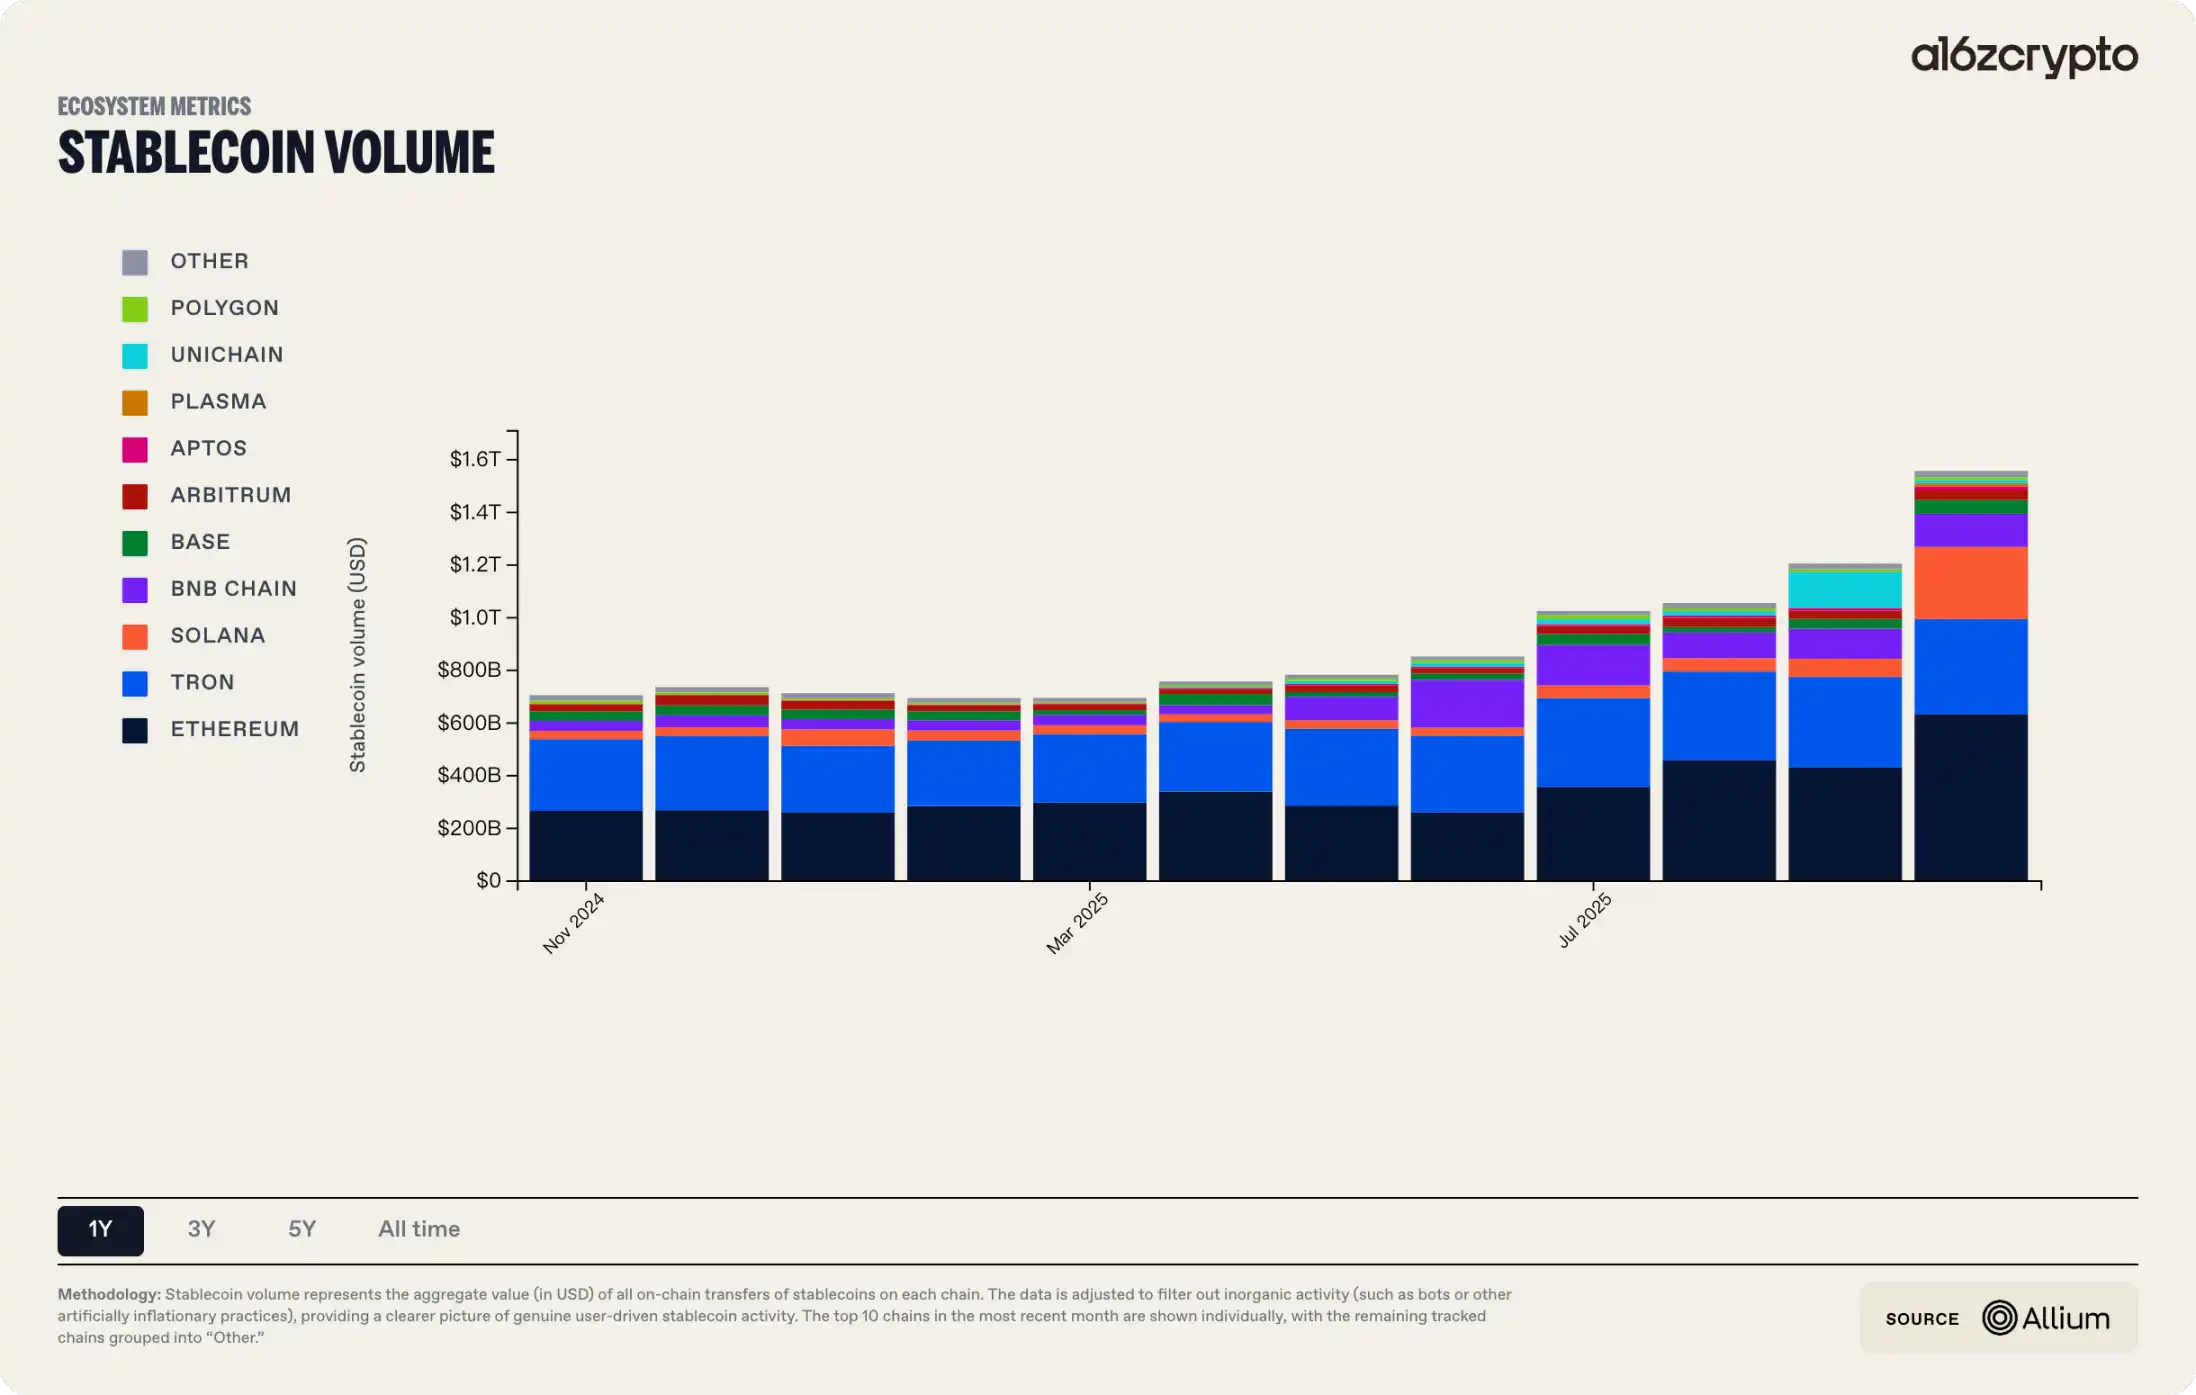
In 2025, the volume and use cases of stablecoins and DAT expanded synchronously, beginning to directly interface with traditional finance at the periphery. The total market value of stablecoins once exceeded $230 billion, with an annual on-chain settlement scale of about $15 trillion. With the support of legislation like the GENIUS Act, this gradually solidified into the underlying settlement layer for cross-border payments and on-chain finance. The DAT model, through compliant equity or fund vehicles, provided a standardized path for traditional institutional investors to access crypto asset exposure, with its holdings of BTC and ETH assets exceeding $140 billion at peak value, more than tripled year-on-year. RWAs serve as a key intermediary in this process: anchoring real-world asset cash flows on one end and connecting the on-chain settlement and valuation systems of stablecoins and DAT on the other. The BCG-Ripple 2025 report projects that the tokenized asset market will expand from the current approximately $600 billion to nearly $18.9 trillion by 2033 at a compounded annual growth rate of about 53%, laying the scale assumption foundation for this evolution.
2025 also marks a turning point where decentralized derivatives move from conceptual validation to actual market share competition. Mainstream on-chain derivative protocols made significant progress in technical architecture, product forms, and user experience, beginning to form a substantial alternative to CEX's trading and listing dominance. High-performance application chain architectures represented by Hyperliquid validated that decentralized infrastructure can directly compete with centralized matching platforms in specific scenarios in terms of throughput, latency, and capital efficiency. The intent-centric architecture becomes the core paradigm for upgrading the DeFi end-user experience in 2025: users only need to provide the desired state, and Solvers or AI agents competitively search for the optimal execution path off-chain, then uniformly submit it for on-chain settlement, significantly reducing the operational barriers for complex transactions.
By 2025, On-chain RWA had become a key milestone for the crypto industry's mainstream adoption. Its growth momentum was mainly driven by two factors: first, a more relaxed regulatory environment, with the United States seeking to reshape its status as a crypto financial center, with US bonds and stocks leading the way as core tokenized assets; and second, a strong real demand — a significant number of global investors lacked a direct and convenient way to trade US stocks, and tokenization to some extent reduced the barriers to entry posed by nationality and geography. Token Terminal data shows that the market capitalization of stock tokens grew by 2695% in 2025.
At the same time, the brand effect of leading issuance and trading platforms gradually emerged: Platforms such as Ondo and xStocks, focusing on on-chain accessible traditional financial assets, became representative players in the RWA narrative; mainstream exchanges like Bitget and Bybit continued to invest resources in listing, trading, and providing liquidity support for related assets. Coupled with advantages such as streamlining account opening processes and 24/7 trading, stock tokens became a direction of significant market attention in 2025. A report by Bitget showed that during Q3 of 2025, its stock contract trading volume increased by 4468% compared to the previous period, with a total trading volume surpassing $10 billion.
In an environment where the macro narrative and regulatory framework were gradually clarified and uncertainties converged, a more complex trading structure and strategic space were opened up. Building on this macro and institutional backdrop, the second part will shift to an empirical profile of centralized trading infrastructure: quantitatively tracking the spot and derivatives trading volume distribution of mainstream CEXs, changes in market share, and the fund flow of BTC spot ETFs in 2025, outlining the capital allocation paths of various participants throughout the year, the structural reshuffling of market share among trading platforms, and the reshaping of overall market liquidity and price discovery mechanisms due to institutional capital inflows.
Centralized Derivatives Trading Platforms
CEX Derivatives Trading Volume
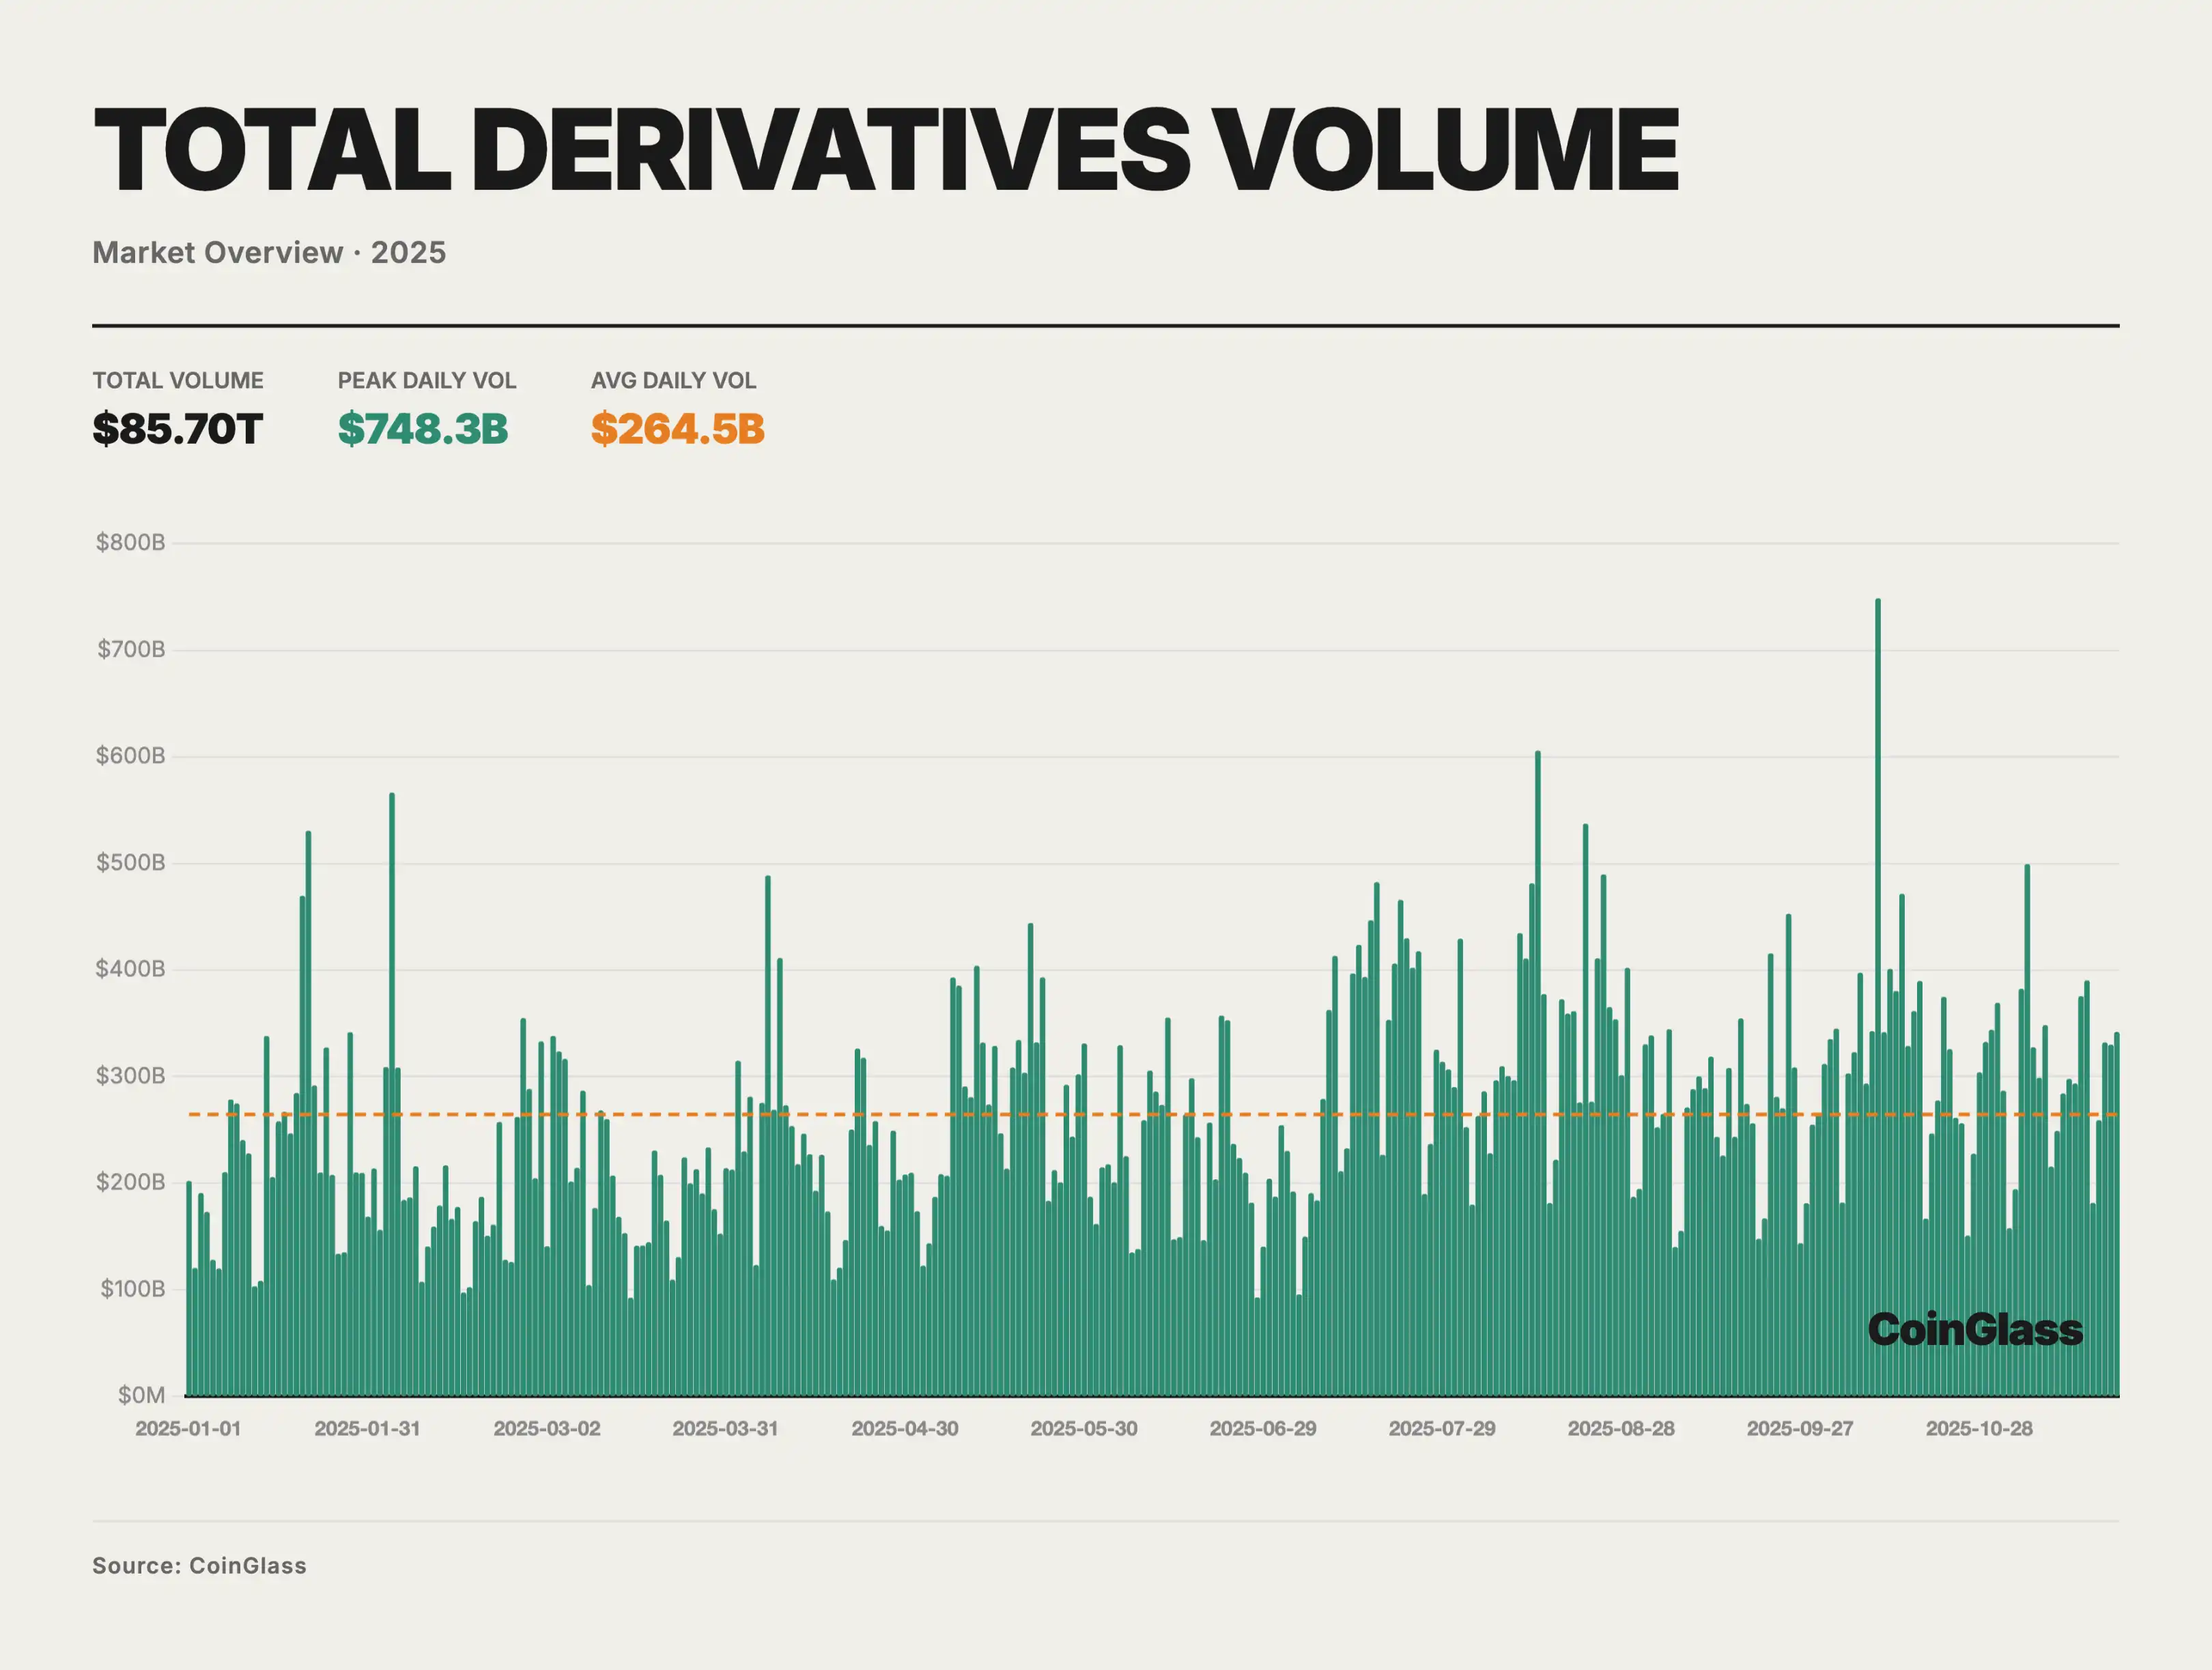
By 2025, the total trading volume of the crypto derivatives market was approximately $85.70 trillion, with a daily average trading volume of around $2,645 billion. Against the backdrop of a still relatively tight macro liquidity environment and a phased recovery in risk appetite, the overall trading activity throughout the year followed a structure of "initially low, then high, with oscillations and upward trends." Currently, derivatives have become the primary venue for price discovery and risk management for the vast majority of mainstream assets. High-volume trading days above the mean indicated by the orange dashed line in the graph were repeatedly observed, with October 10 recording a peak of around $748 billion in a single day, significantly higher than the normal levels during the year, reflecting that in a rapidly evolving market phase, derivatives had become the core battlefield for price discovery and leverage games. On a monthly basis, the average daily trading volume in the first quarter mostly stayed around $200 billion, gradually increasing from the second quarter onwards, with the daily levels in July–August and October rising to above $300 billion.
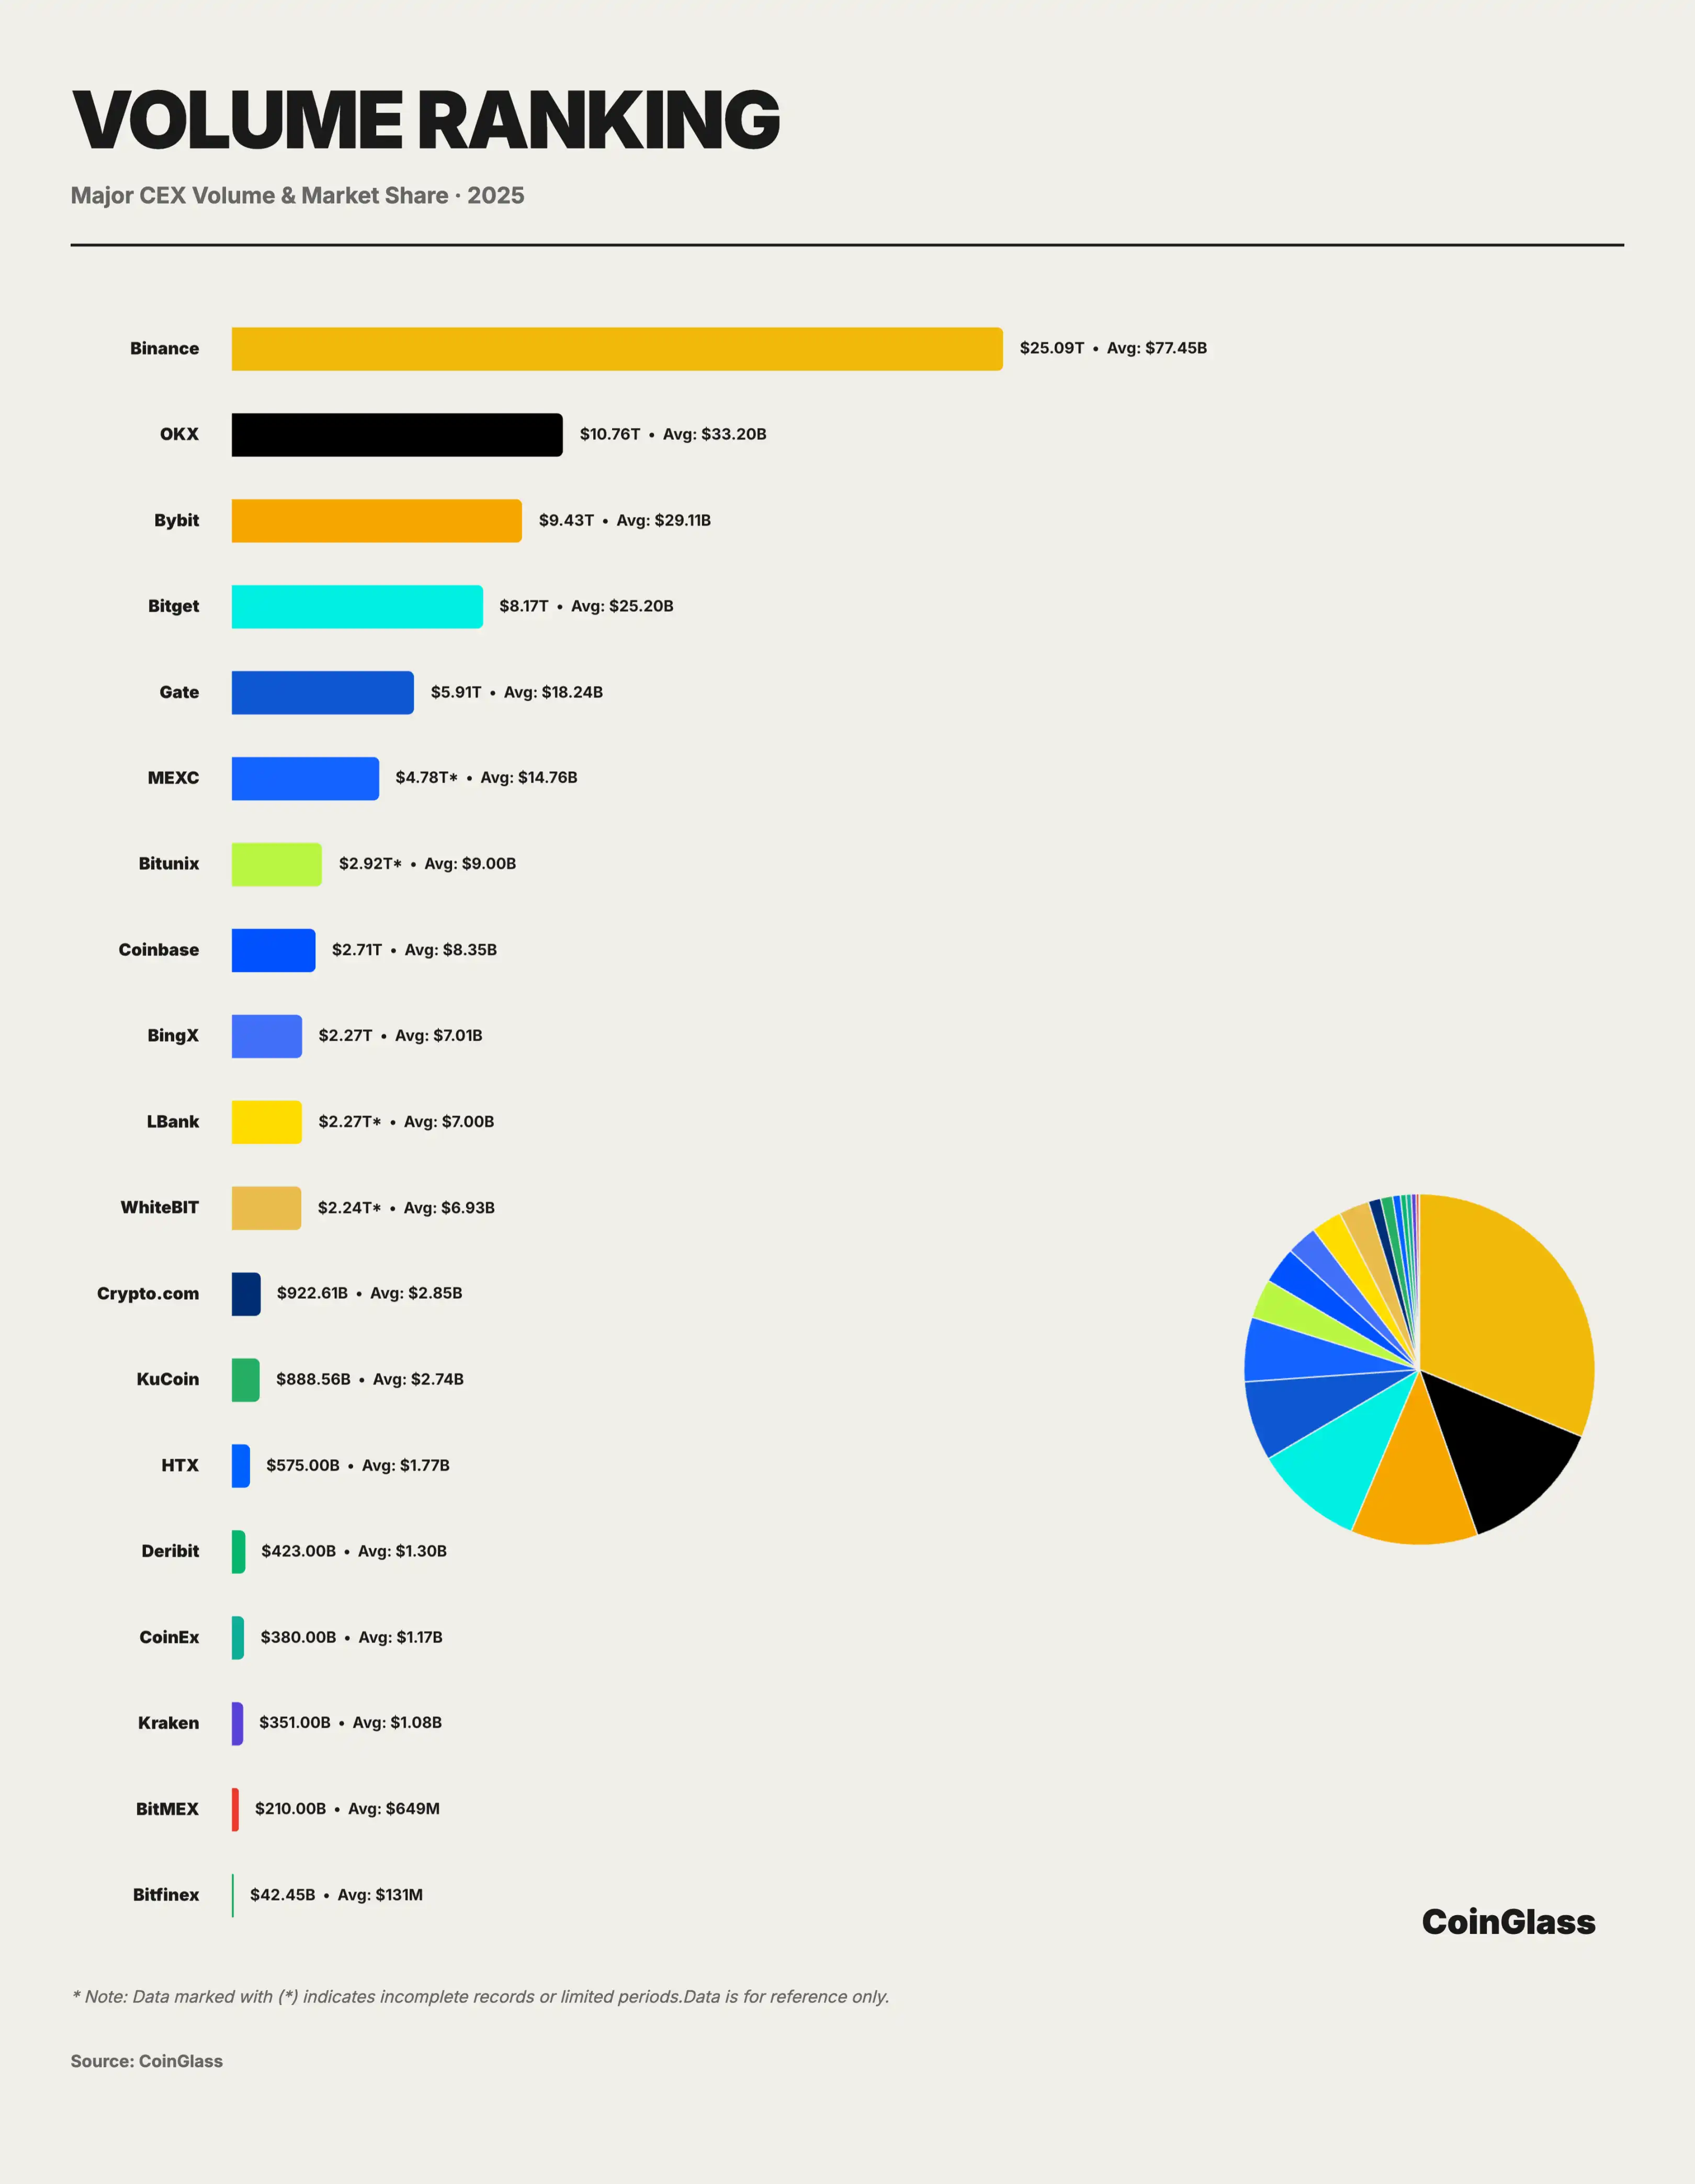
Behind a total trading volume of 85.70T USD and a daily average trading volume of 264.5B USD, the distribution of market share exhibits a highly concentrated feature. Binance firmly holds the market leadership position with a cumulative trading volume of 25.09T USD and a daily average of $77.45B, representing approximately 29.3% of market share. This means that out of every $100 of trading volume in the global derivatives market, about $30 takes place on Binance.
The second-tier competitive landscape shows a clear differentiation. OKX, Bybit, and Bitget follow closely behind, with cumulative trading ranges of approximately 8.2–10.8 trillion USD and daily averages ranging from 250–330 billion USD, collectively accounting for about 62.3% of the overall market. OKX ranks second with a total volume of 10.76T USD and a daily average of 33.20B USD, holding around 12.5% of market share. Bybit follows closely behind, with a total trading volume of $9.43T, a daily average of $29.11B USD, and a market share of about 11%. Bitget secures the fourth position with a total volume of 8.17T USD, a daily average of 25.20B USD, and a market share of around 9.5%.
Gate.io ranks fifth with 5.91T USD, with a daily average of $18.24B, and its market share drops to approximately 6.9%. Despite Gate maintaining a certain volume as a long-standing trading platform, the gap between it and the top three is widening. More noteworthy is the gap after Gate: BingX's 2.27T USD is less than 40% of Gate's, while Crypto.com and KuCoin have fallen to the billion-dollar level (922.61B USD and 888.56B USD), representing only 3-4% of Binance's volume. Single players like Crypto.com and KuCoin hold about 1% market share each, mainly serving regional or niche customer segments, with significantly weaker bargaining power and liquidity stickiness compared to the top players. Comparing the year-on-year and quarter-on-quarter growth rates of trading volume, Bitunix is in a leading range in both metrics, with the steepest growth slope, making it one of the fastest-growing platforms in trading volume.
This cliff-like distribution reveals the Matthew Effect of platform economics, where top platforms form a self-reinforcing cycle based on liquidity advantages. For medium and small platforms, they need to establish a differentiated position in niche markets, otherwise, they will face sustained pressure of market share erosion.
CEX Derivatives Open Interest
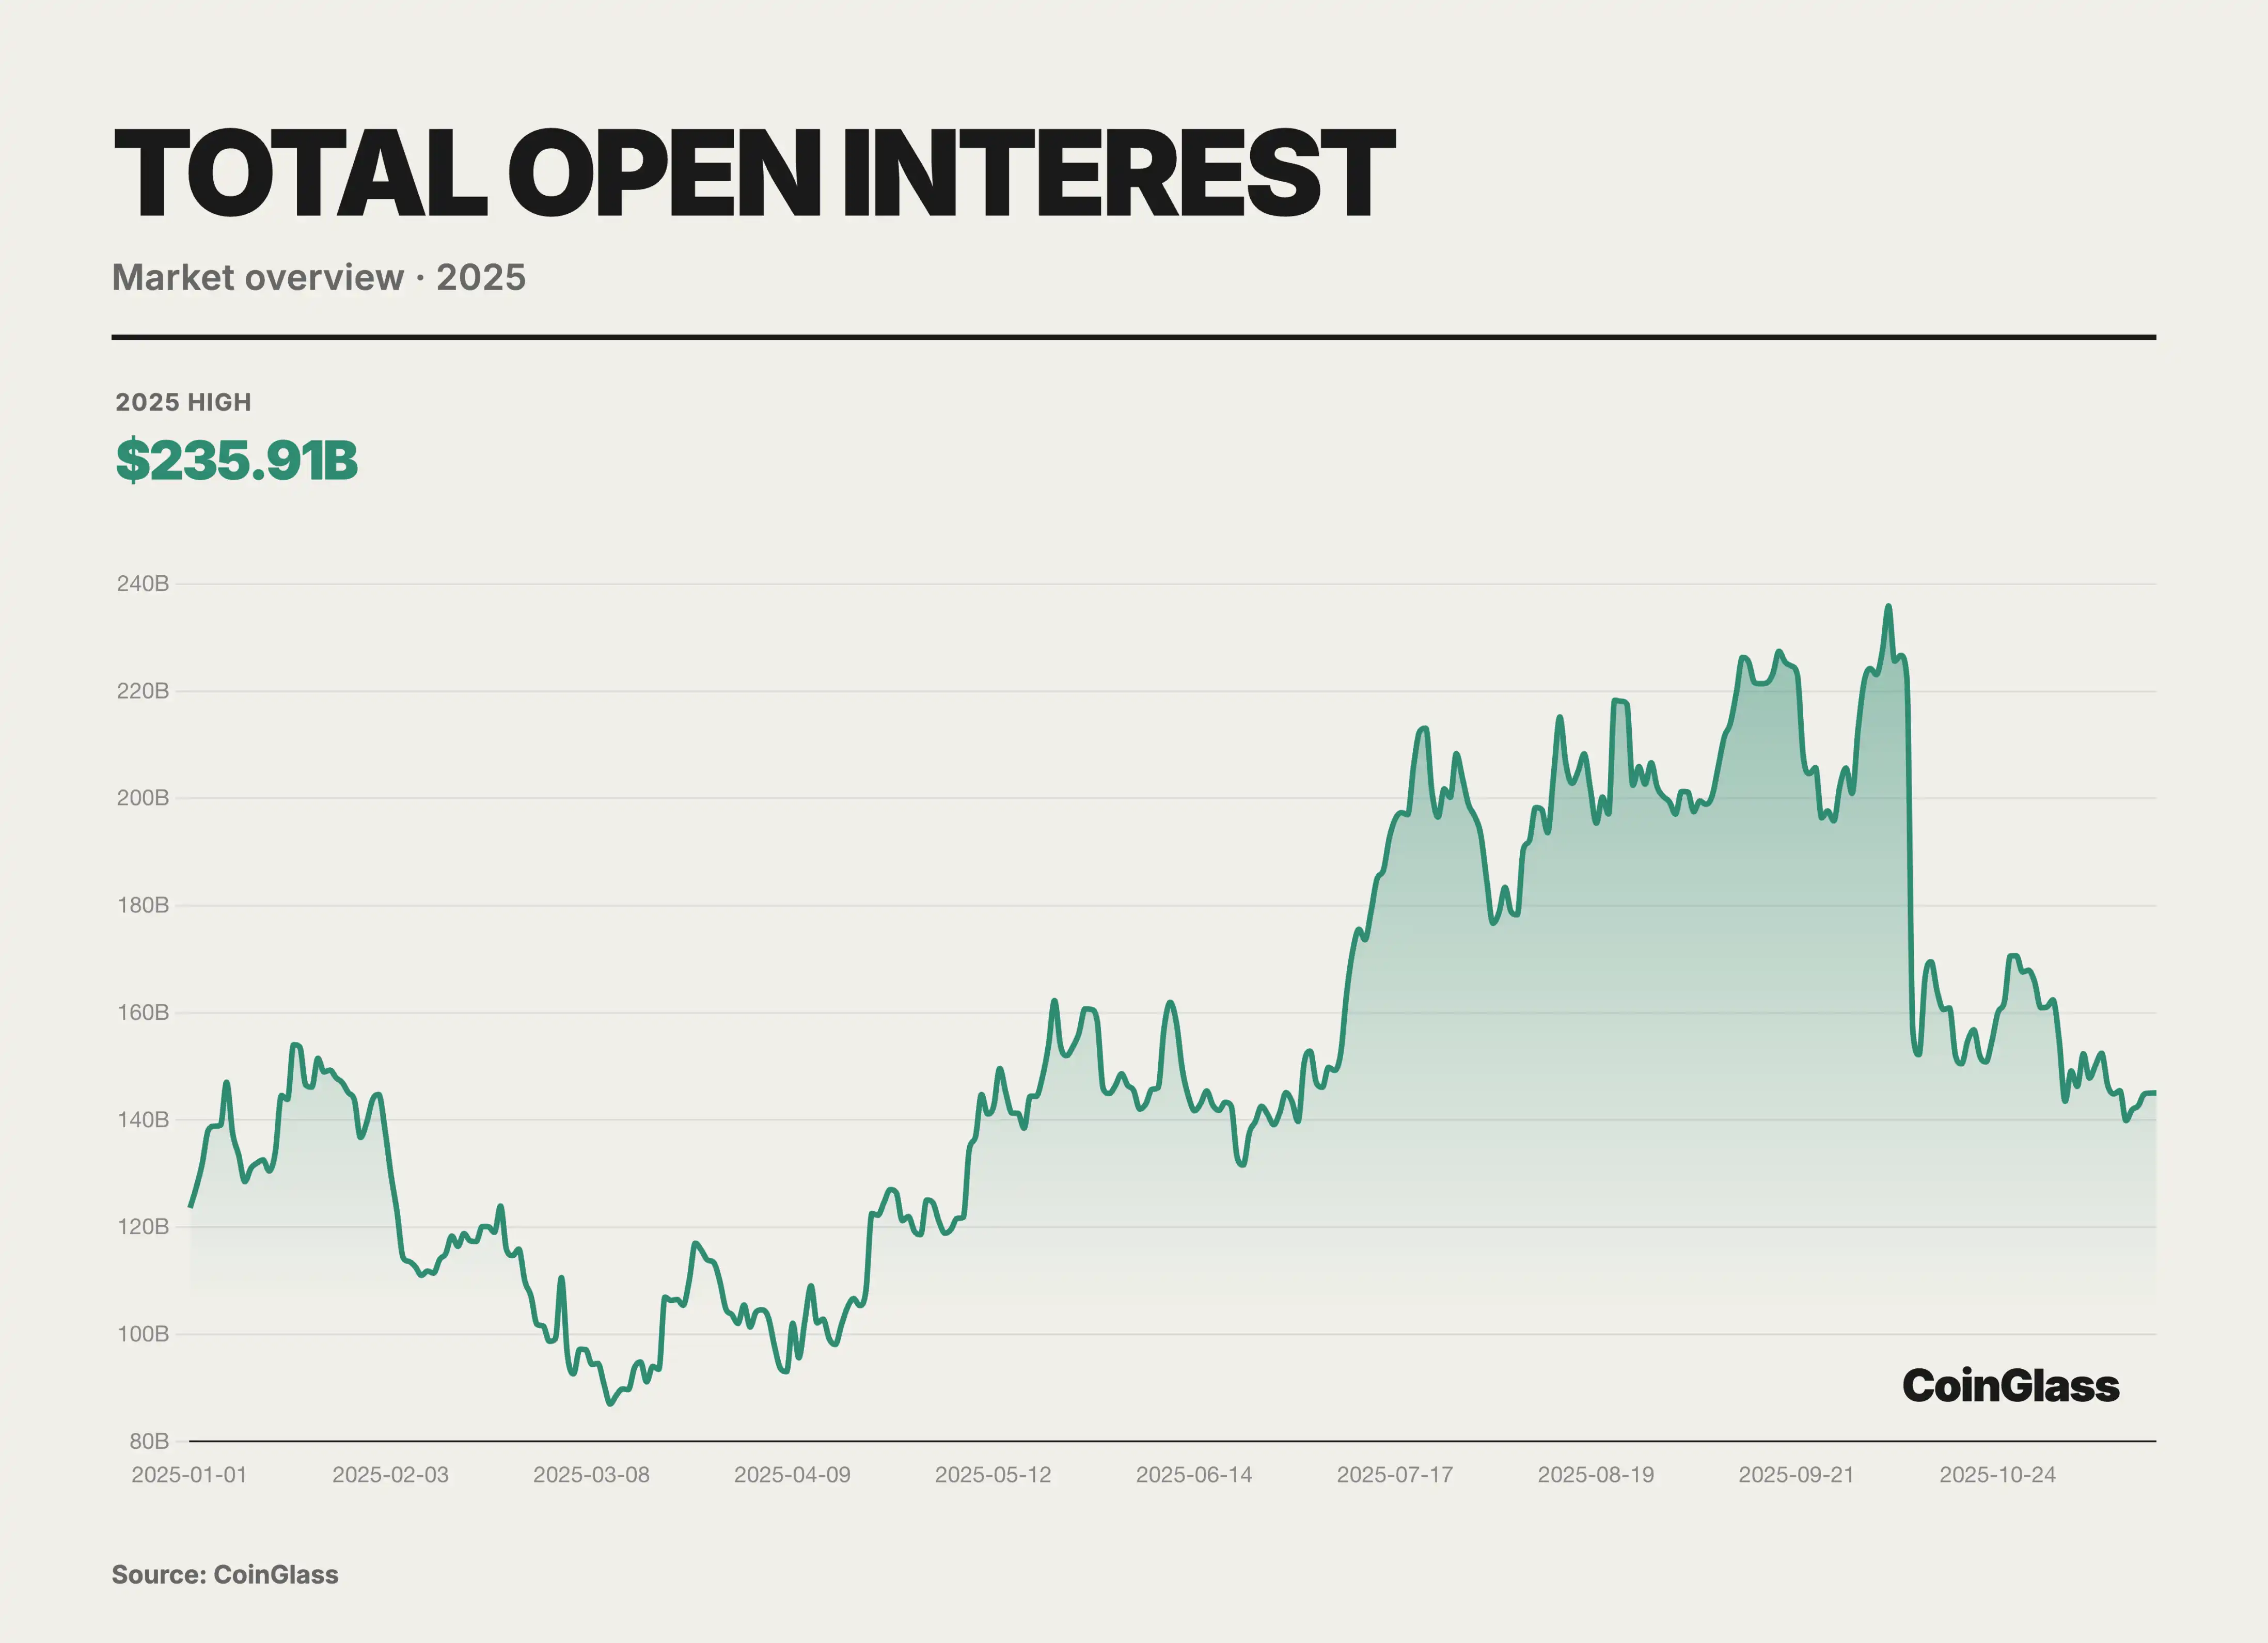
In 2025, the global cryptocurrency derivatives open interest (OI) followed a path of initial restraint, followed by recovery, and then a sharp decline. The market experienced a deep deleveraging in Q1, with OI hitting a low of $87 billion during a panic-induced sell-off, but then showed remarkable resilience in Q2, moving from cautious testing to mild re-leveraging and confidence rebuilding. This recovery trend in Q3 evolved into an almost manic leveraged bubble accumulation, with funds pouring in rapidly driving OI unilaterally higher, reaching a historical peak of $235.9 billion on October 7. The highly crowded trading structure significantly increased the probability and intensity of a market correction, with an early Q4 lightning deleveraging washing out over $70 billion in just 1 day, accounting for a third of the total OI. Nevertheless, the OI, falling to $145.1 billion, still grew by 17% compared to the beginning of the year, and the overall fund lock-up in the second half of the year was significantly higher than in the first half.
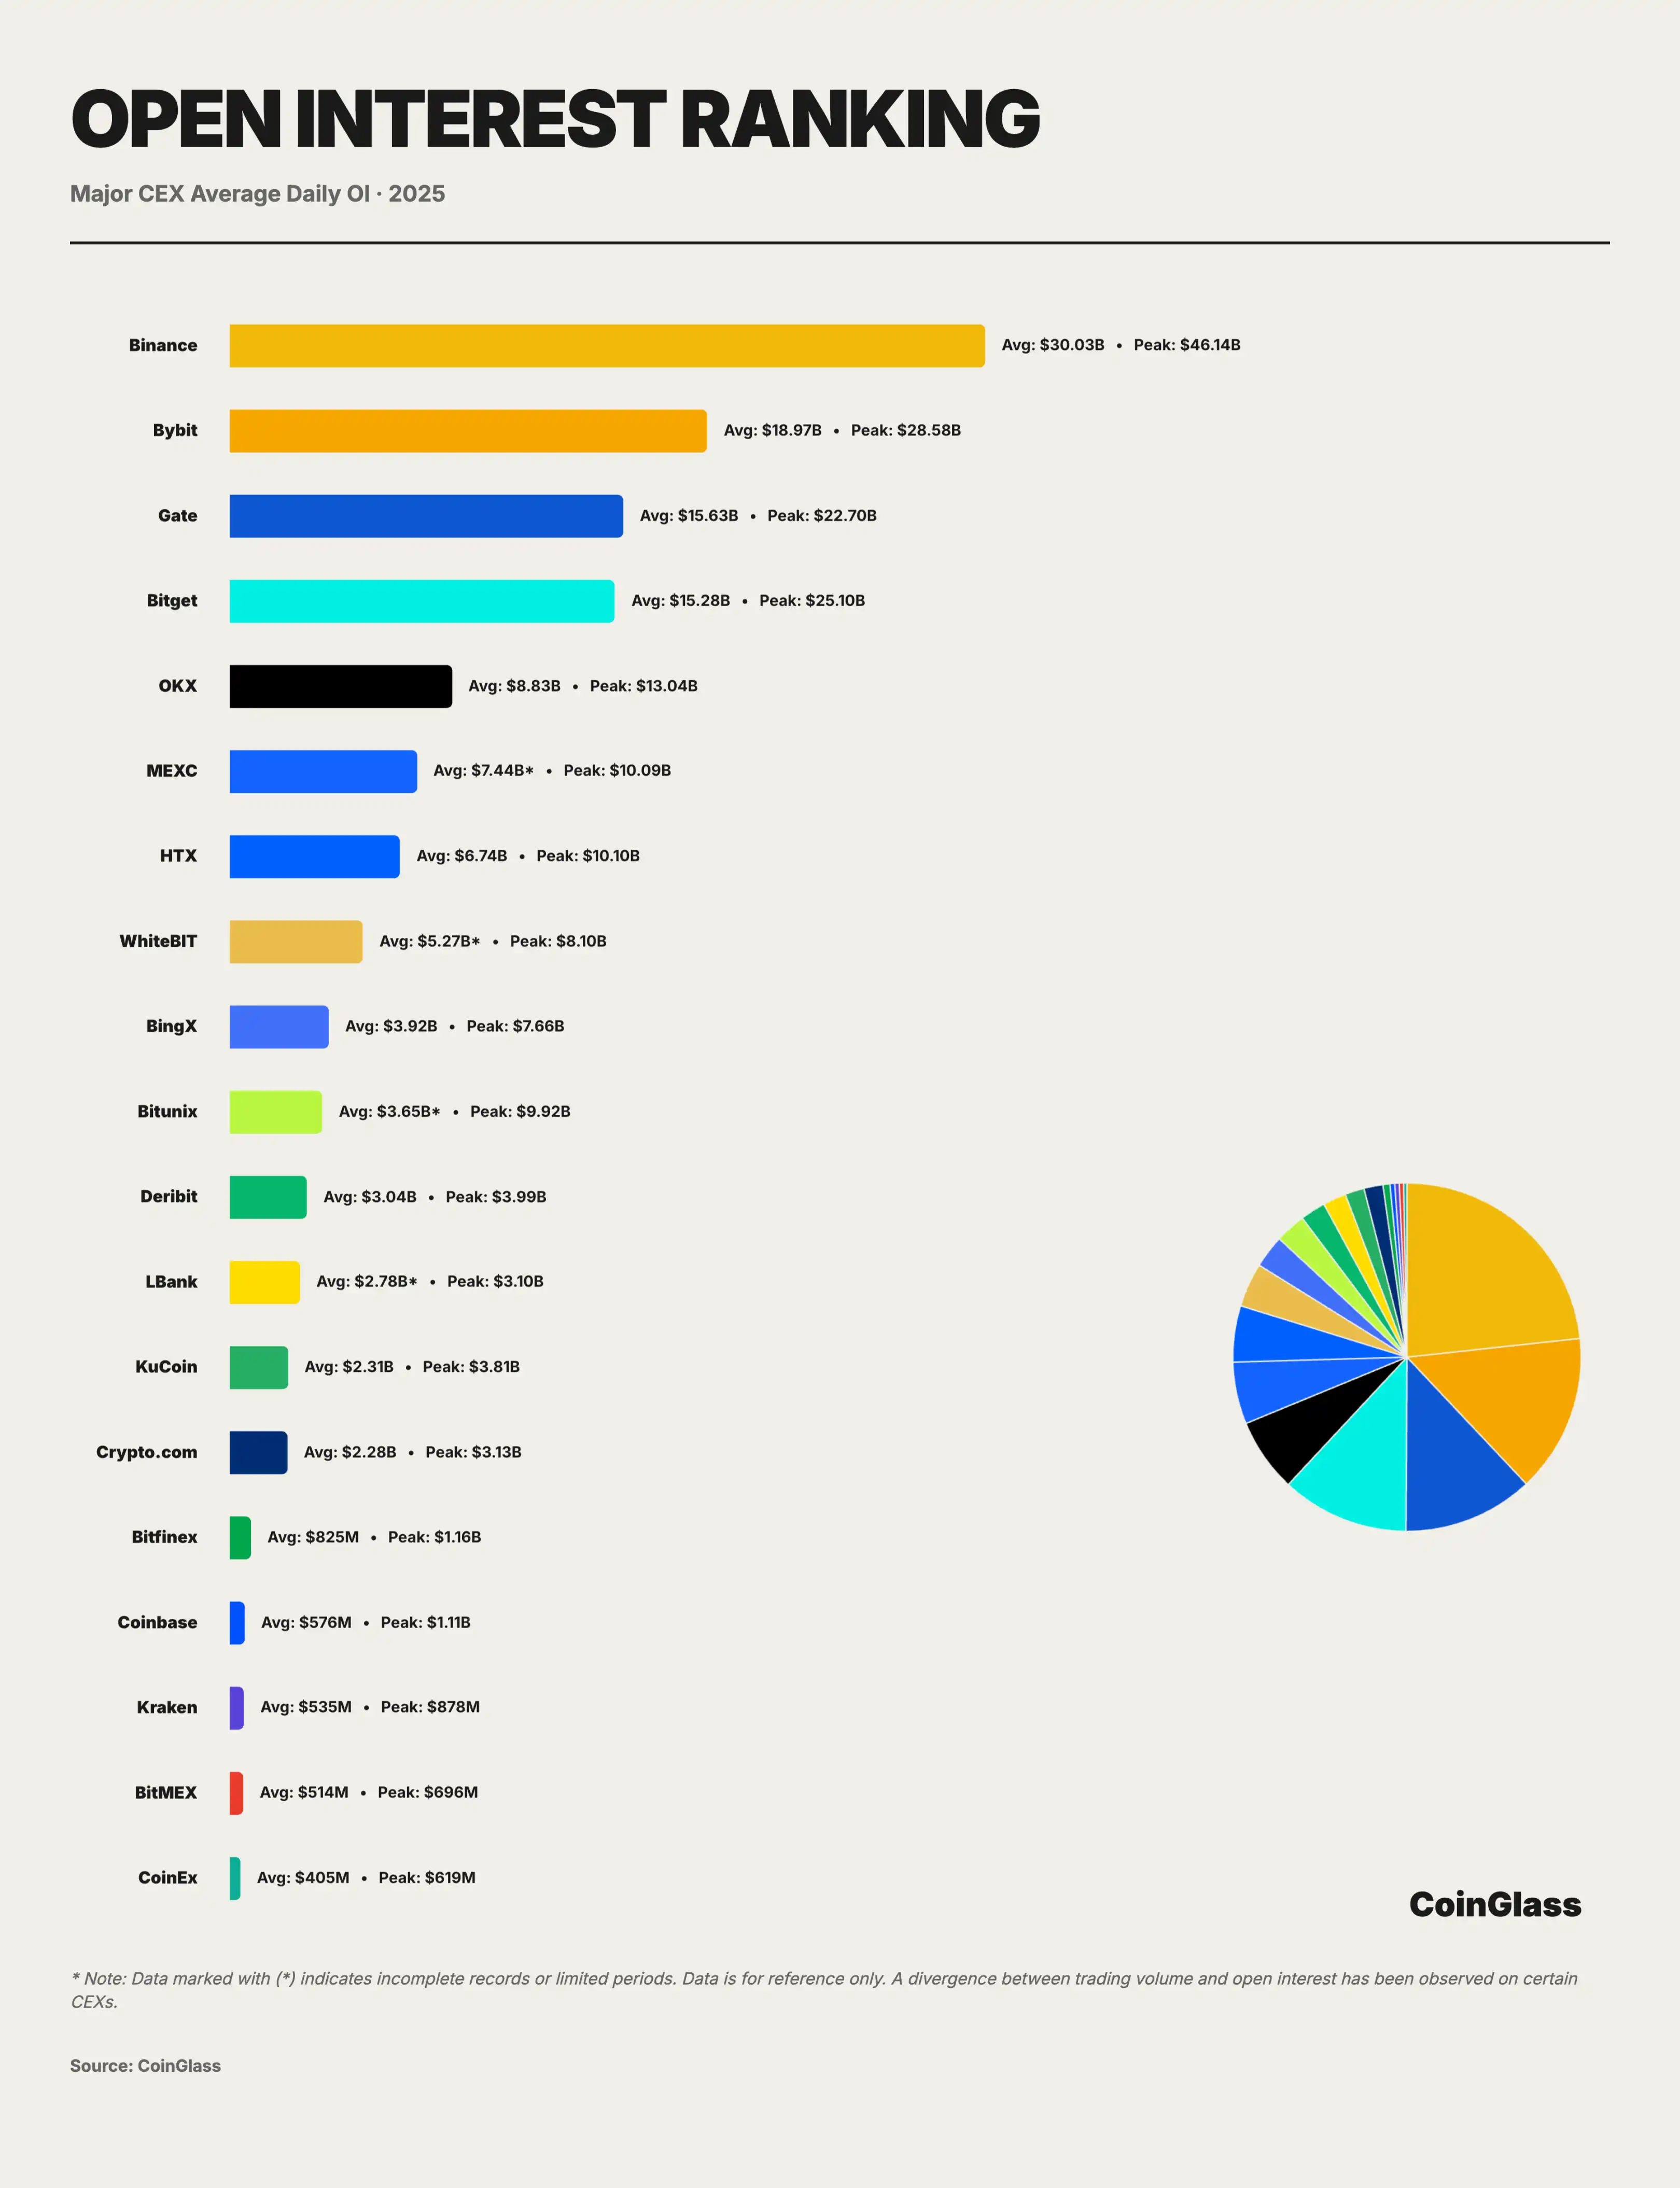
Based on the daily average position data of major CEXs in 2025, the global derivatives market has solidified into a clearly tiered oligopoly structure. The total OI of the top ten centralized exchanges is approximately $108.3 billion, with Binance accounting for about 28% with a daily average OI of around $30 billion, Bybit, Gate, and Bitget with approximately $19 billion, $15.6 billion, and $15.3 billion respectively, collectively making the top four platforms control about 73% of the entire network's tradable leverage positions; after adding OKX, the OI proportion of the top five platforms exceeds 80%, showing a very high level of concentration at the top. Binance, with a daily average position of around $30 billion, has established a stark leading advantage, with its volume close to the sum of the second and third places, playing a decisive role as the market's liquidity cornerstone. Following closely behind is the second tier composed of Bybit, Gate, and Bitget, with their daily average positions maintained in the high range of $15 billion to $19 billion, collectively commanding a significant share of the market; among them, the daily average difference between Gate and Bitget is only about $300 million, showing an extremely high level of competition in market share.
OKX's position data is relatively lower, partly because OKX provides users with a product structure with high capital utilization, where funds rotate quickly between different trading pairs and products, spread across spot, savings, staking, and other non-trading modules, so the open interest indicator cannot fully reflect the actual locked-in fund scale. In addition, there may be some deviation between the trading volume and the position amount on some platforms, so investors should pay more attention to the trading structure and fund distribution, rather than relying solely on the position indicator.
CEX Liquidity Depth
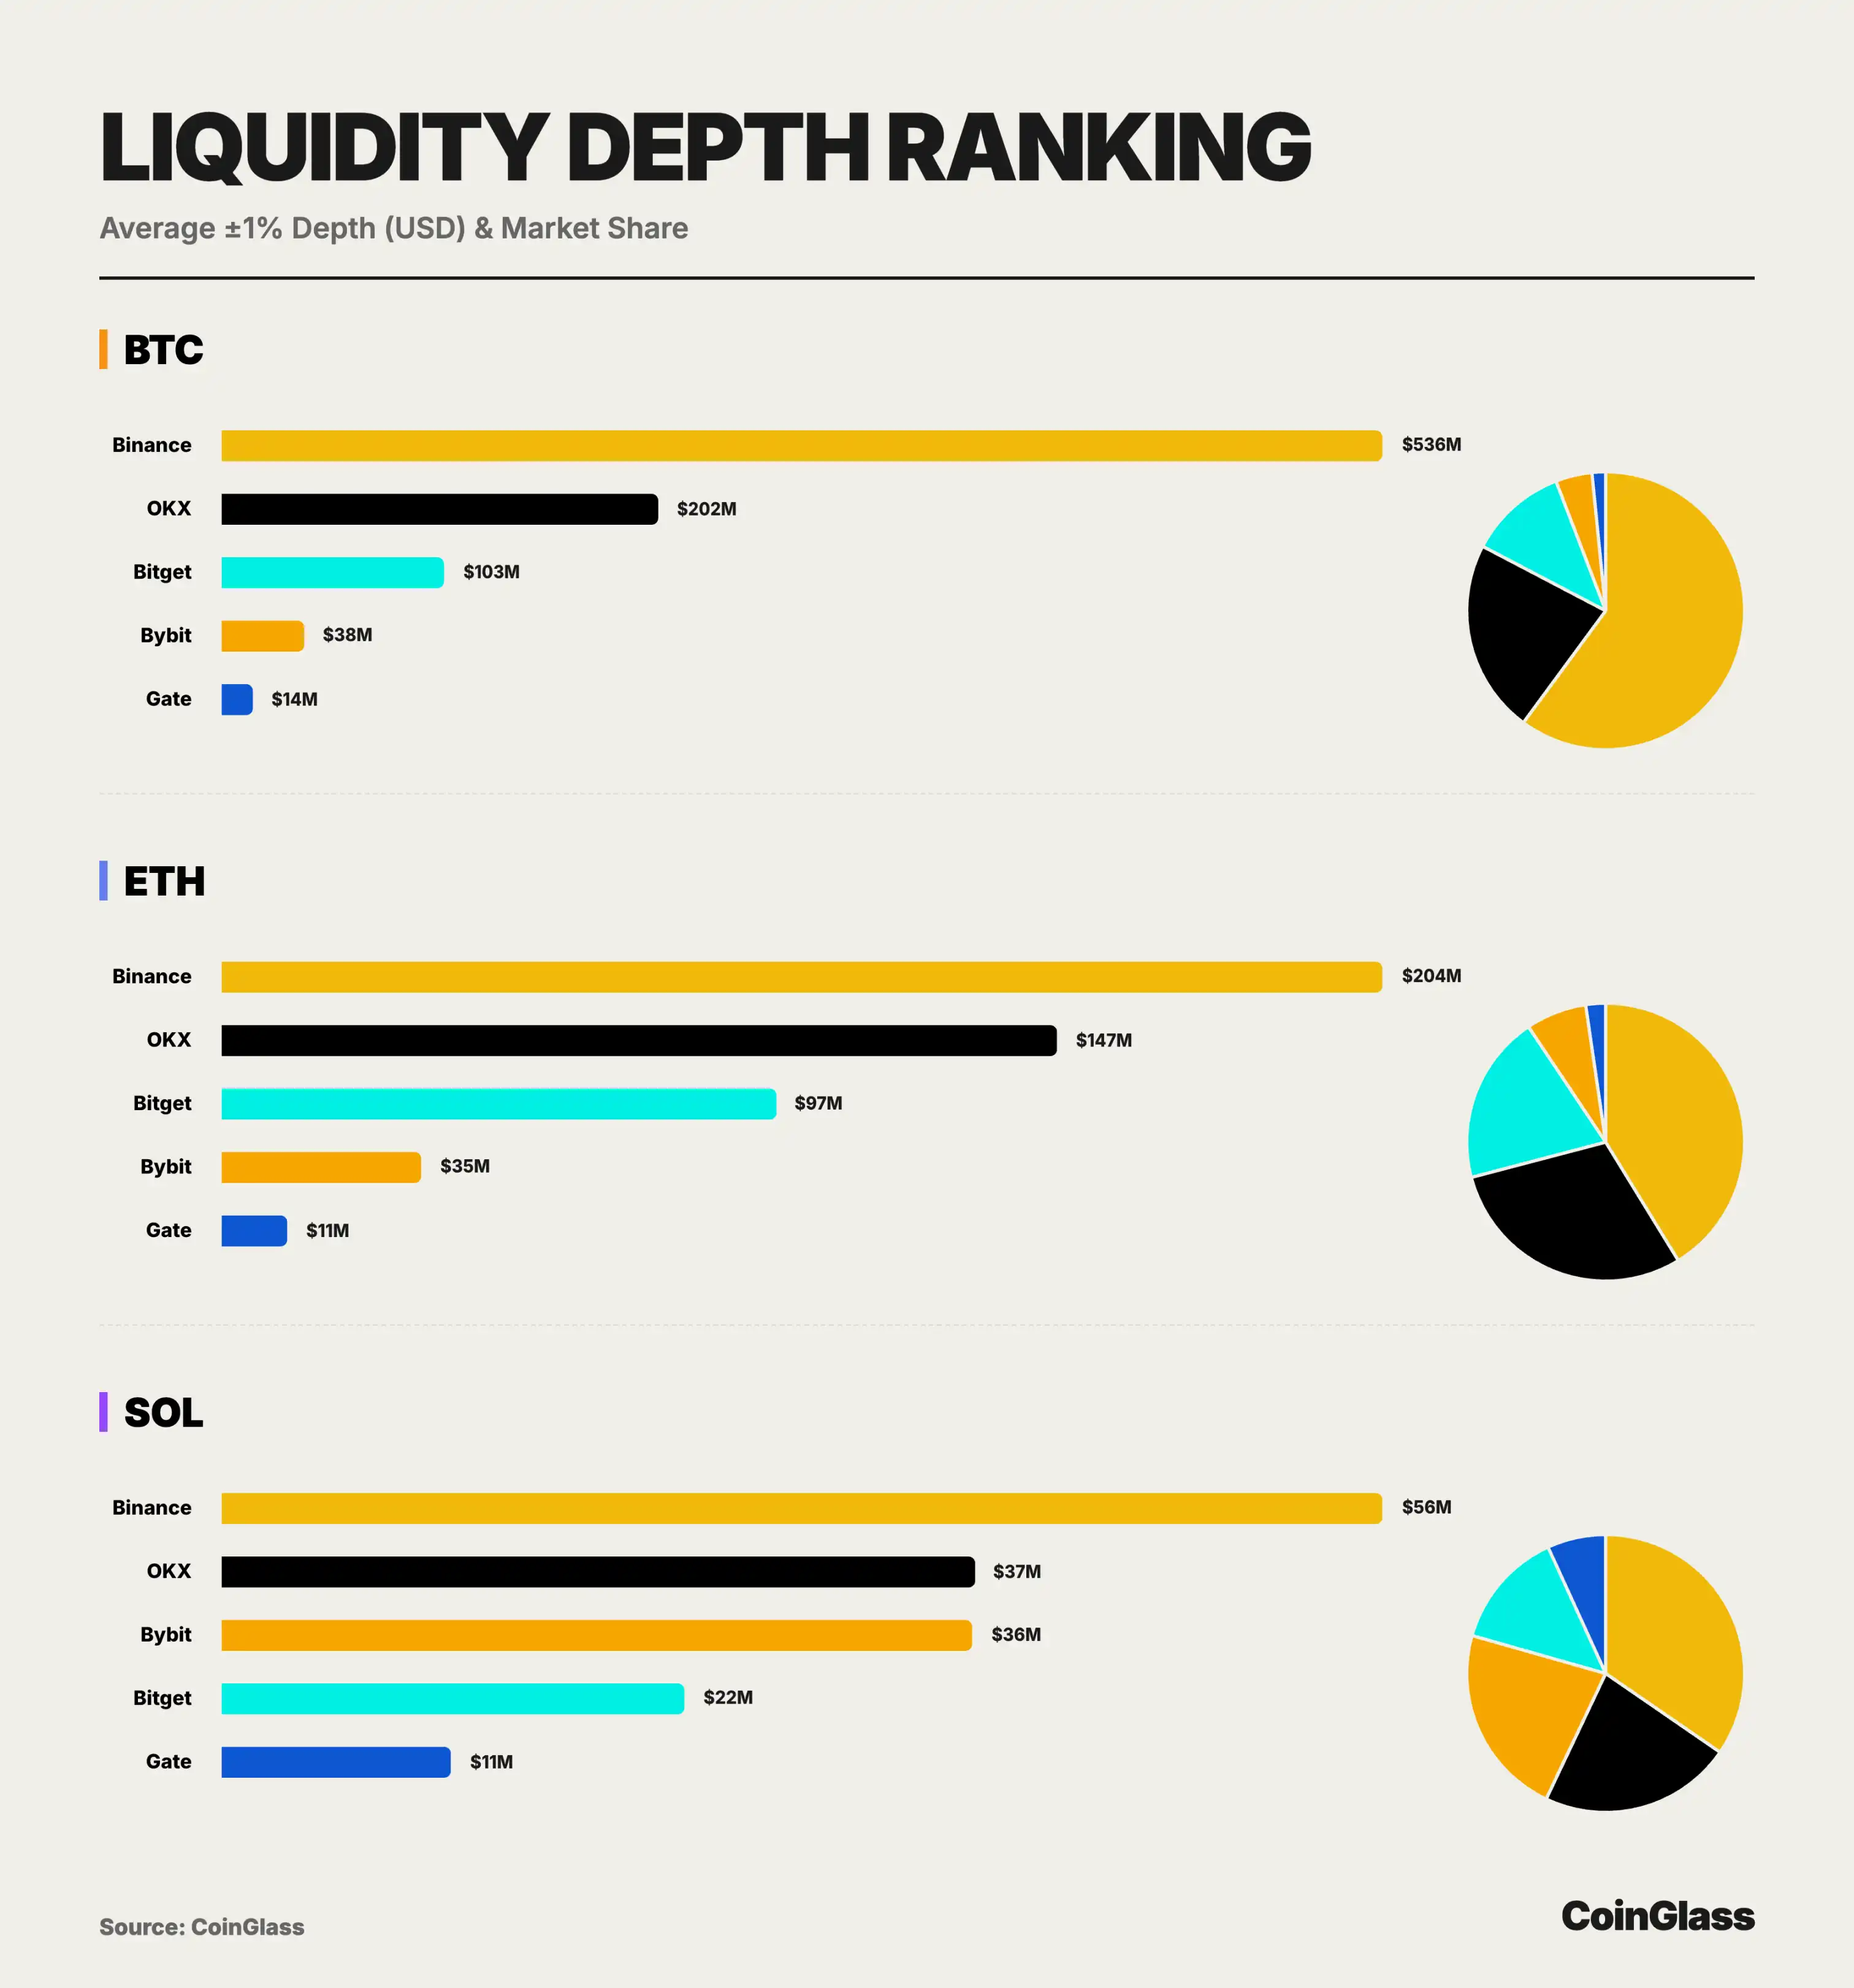
Based on 2025 major asset (BTC/ETH/SOL) order book depth data, the market exhibits a market structure vastly different from the Open Interest (OI). Binance unequivocally dominates the market with a staggering $536 million BTC depth, not only 2.6 times larger than the second-place, but also nearly equivalent to the sum of the rest of the four platforms, establishing its absolute position as the global cryptocurrency derivatives liquidity hub. OKX, with $202 million BTC depth and $147 million ETH depth, demonstrates its capacity to handle large trades, proving it remains the second choice for institutional and whale trading, just behind Binance.
On BTC, Bitget ranks third with approximately $103 million in bilateral depth, about 2.7 times that of Bybit and 7 times that of Gate, contributing nearly 11.5% to the overall market BTC depth. On ETH, Bitget's ±1% depth of around $97.48 million is close to 70% of OKX's, far exceeding Bybit and Gate, contributing close to 20% to the total ETH depth. This forms a liquidity distribution with Binance in the lead, OKX in a stable second position, and Bitget stably occupying the core of the second-tier liquidity. Even in SOL, which has relatively weaker overall liquidity, Bitget still provides over $22.42 million in ±1% depth, about 60% of OKX and Bybit, holding approximately 14% of the total SOL depth, demonstrating its significant order absorption capability in high-volatility, relatively long-tail mainstream assets.
CEX User Asset Deposits
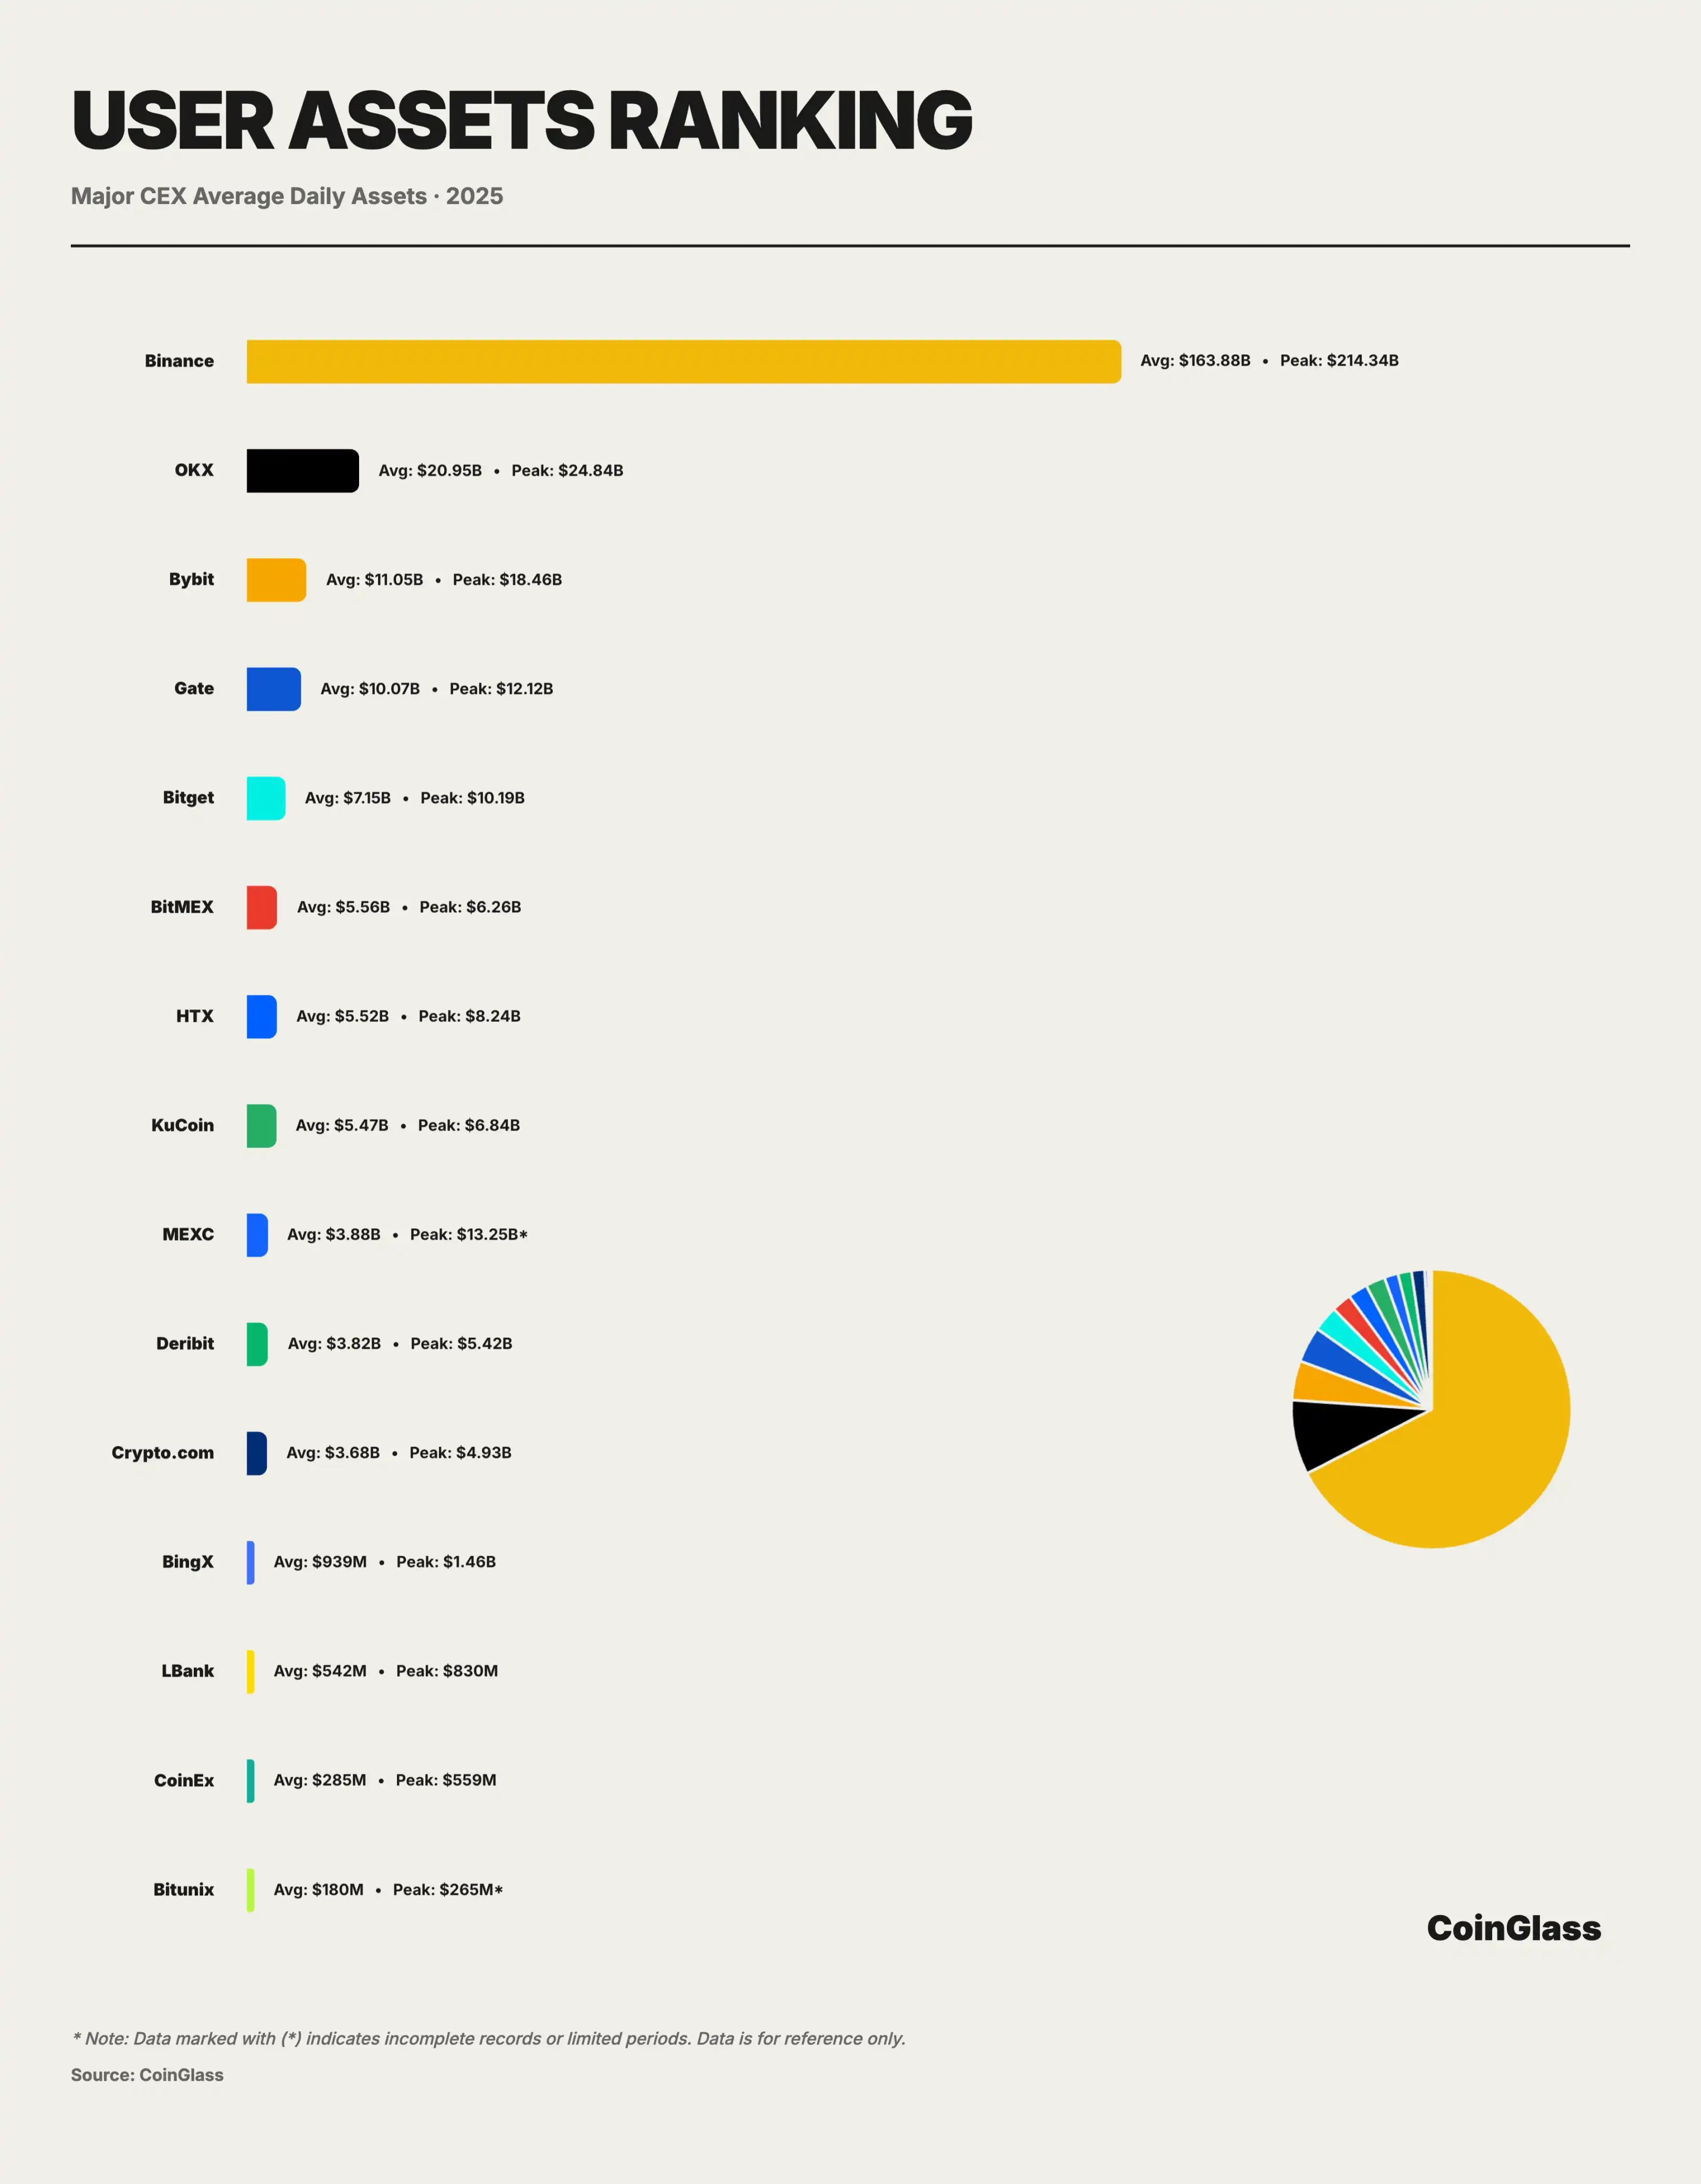
Based on 2025 user asset deposit data, the crypto market demonstrates a highly concentrated unipolar structure in terms of fund custody. Calculated based on the Herfindahl-Hirschman Index, the 2025 CEX custody asset concentration is 5352, indicating an extreme oligopoly state in the cryptocurrency exchange market, with Binance alone holding over 72% of the market share. Binance's daily average custody assets are around $163.9 billion, peaking in the year at around $214.3 billion, exceeding 2.5 times the total assets of the following seven major platforms. This concentration implies that in terms of actual fund storage and custody, Binance effectively plays a role similar to "systemic infrastructure," and its operations and compliance status have an amplifying effect on the overall robustness of the crypto market.
With around $21 billion in average daily assets and a peak of $24.8 billion, OKX ranks second, approximately twice the size of third-placed Bybit, demonstrating its advantage in user fund retention and medium- to long-term asset accumulation. However, this bipolar structure plus multiple mid-sized platforms means that fund custody risk is highly concentrated in the top two platforms. If any one platform experiences a tail event in terms of compliance, technology, or operations, the spillover effect will far exceed the market share of the individual platform. Beyond the second tier, the market enters a more fiercely competitive range in the tens of billions. Bybit, Gate, and Bitget have daily average assets of around $11.05 billion, $10.07 billion, and $7.15 billion, respectively, collectively forming the second-tier asset-bearing layer. The top five platforms together absorb over 90% of user assets, indicating a high concentration of user funds.
CEX Rankings
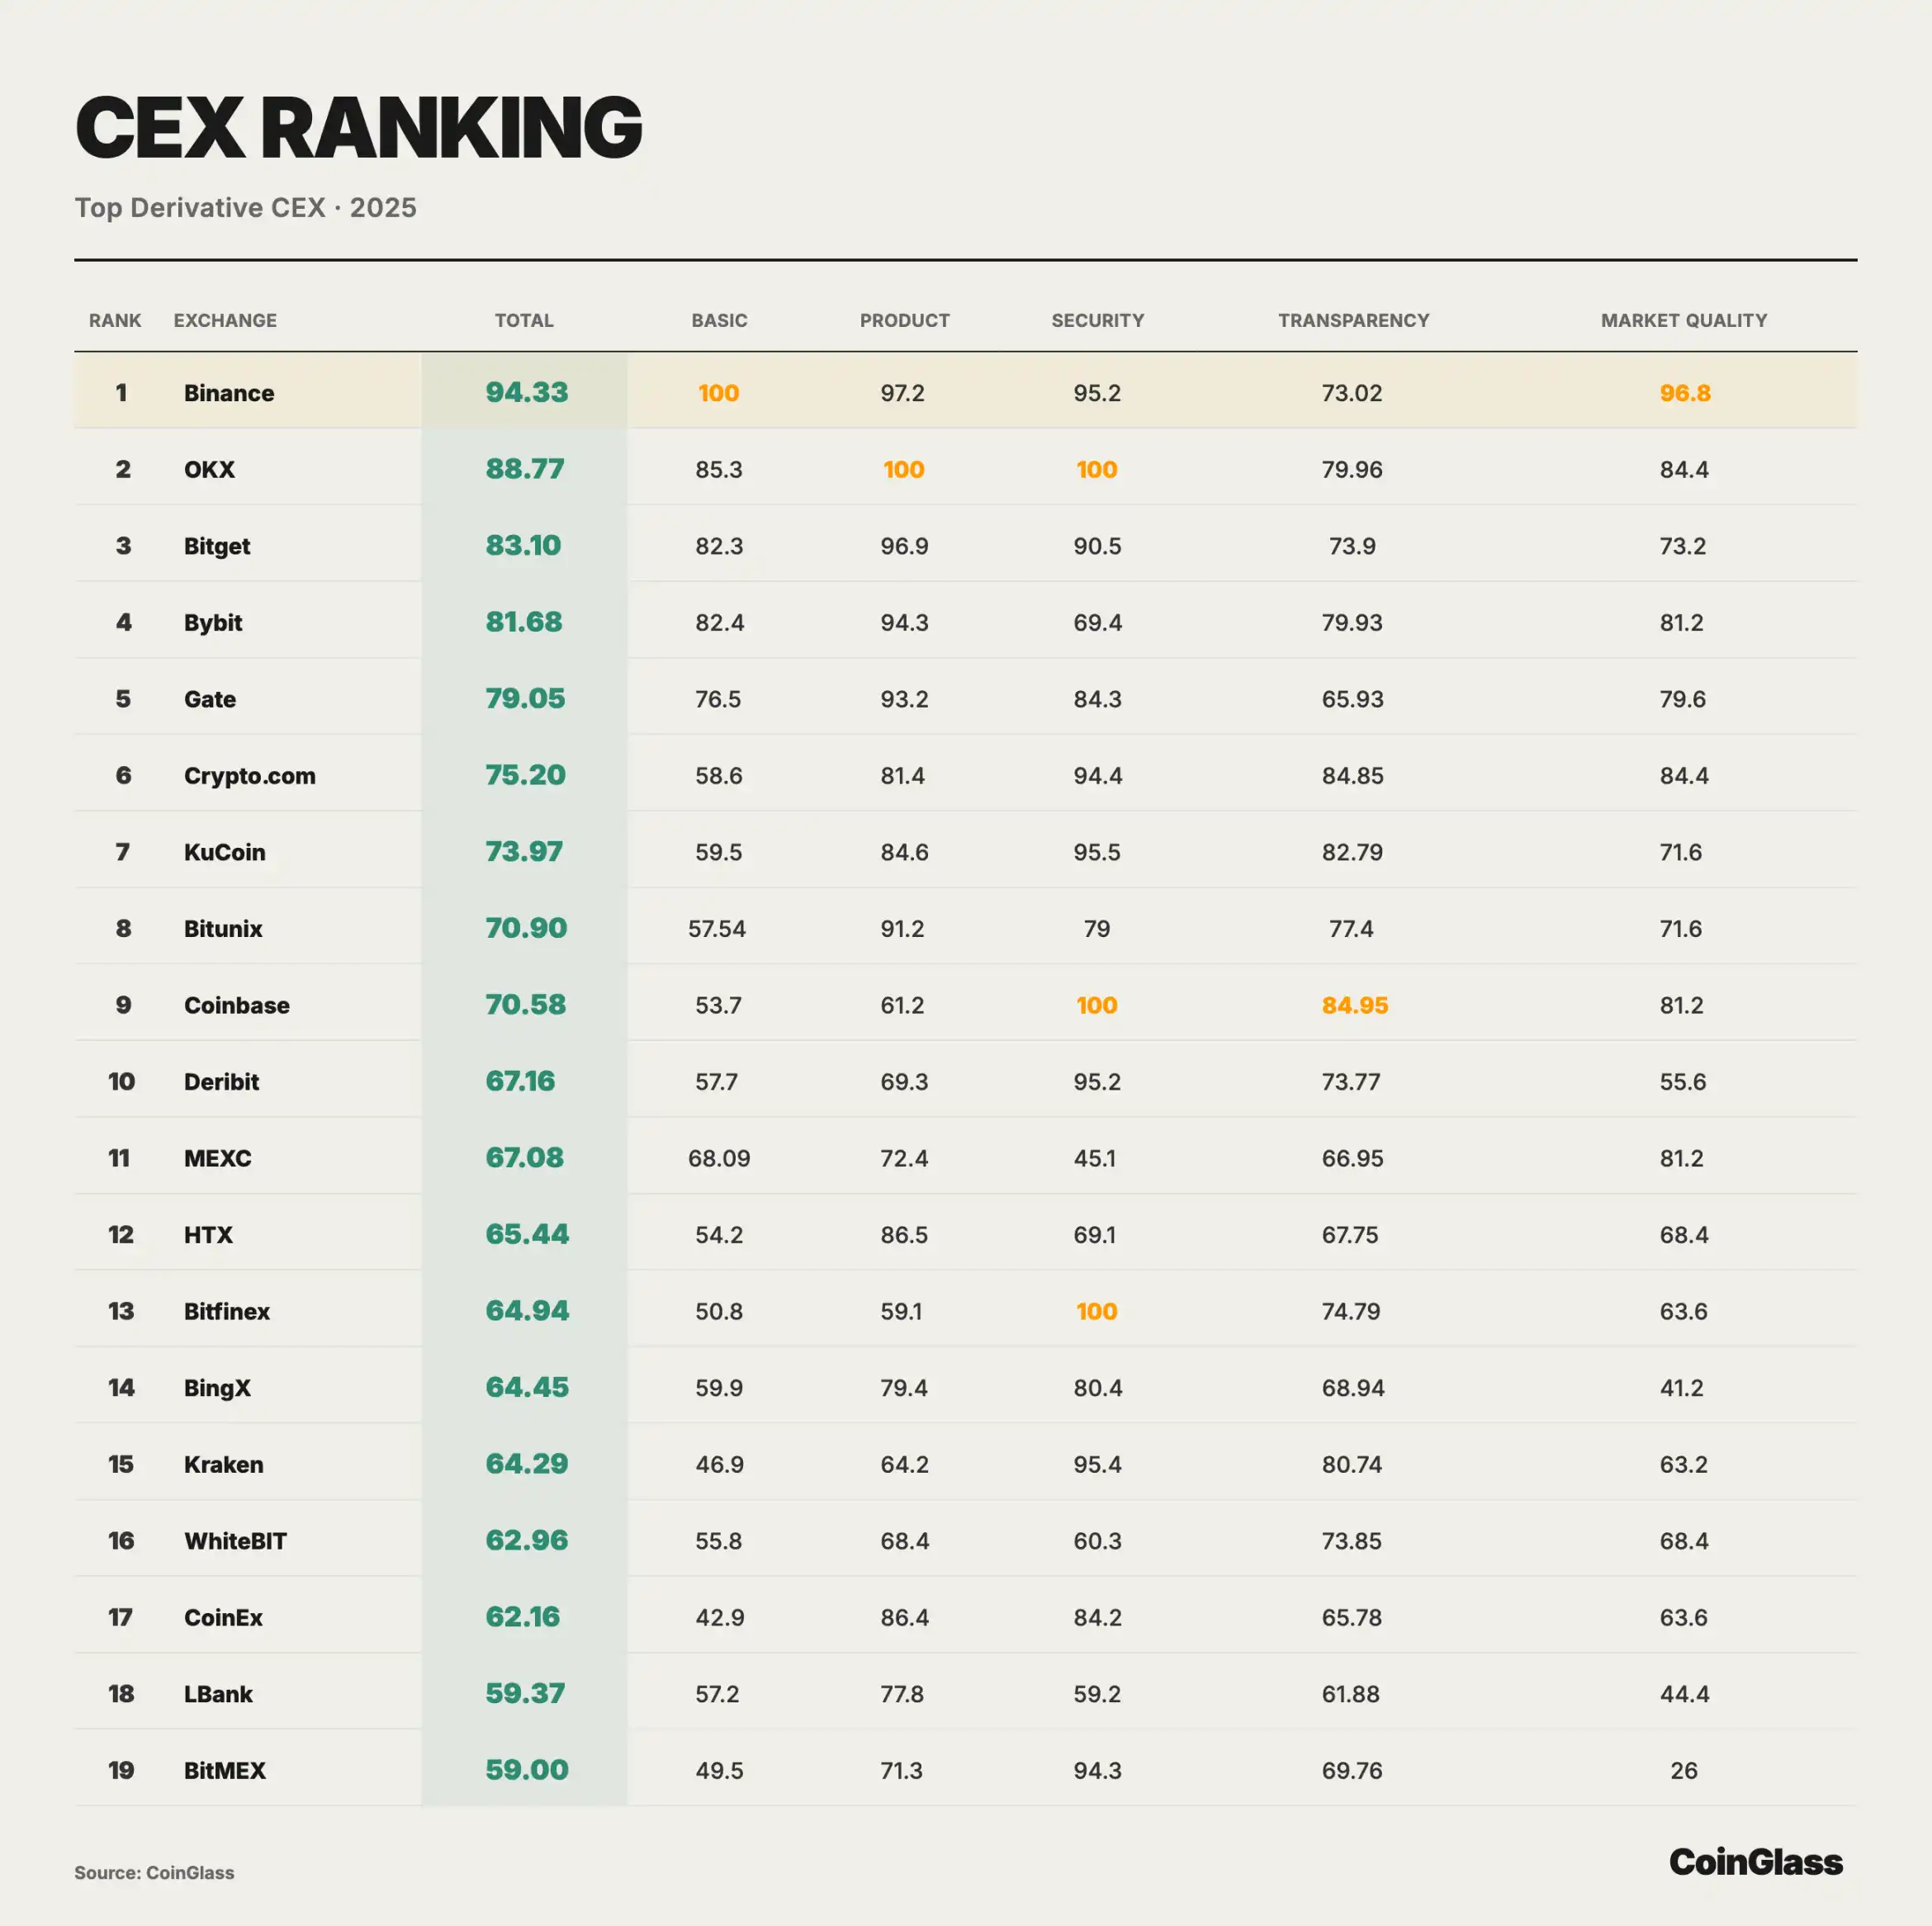
To further translate the concentration of derivative trading on the CEX side from a narrative of volume to a comparable quality dimension, CoinGlass has conducted a comprehensive rating and ranking of major derivative CEXs. The following chart is based on underlying trading data as the core weight, providing sub-scores and weighted total scores across dimensions such as product, security, transparency, and market quality, to vividly illustrate the structural gaps among different platforms in terms of liquidity provision, risk constraints, and information disclosure.
Liquidation Data
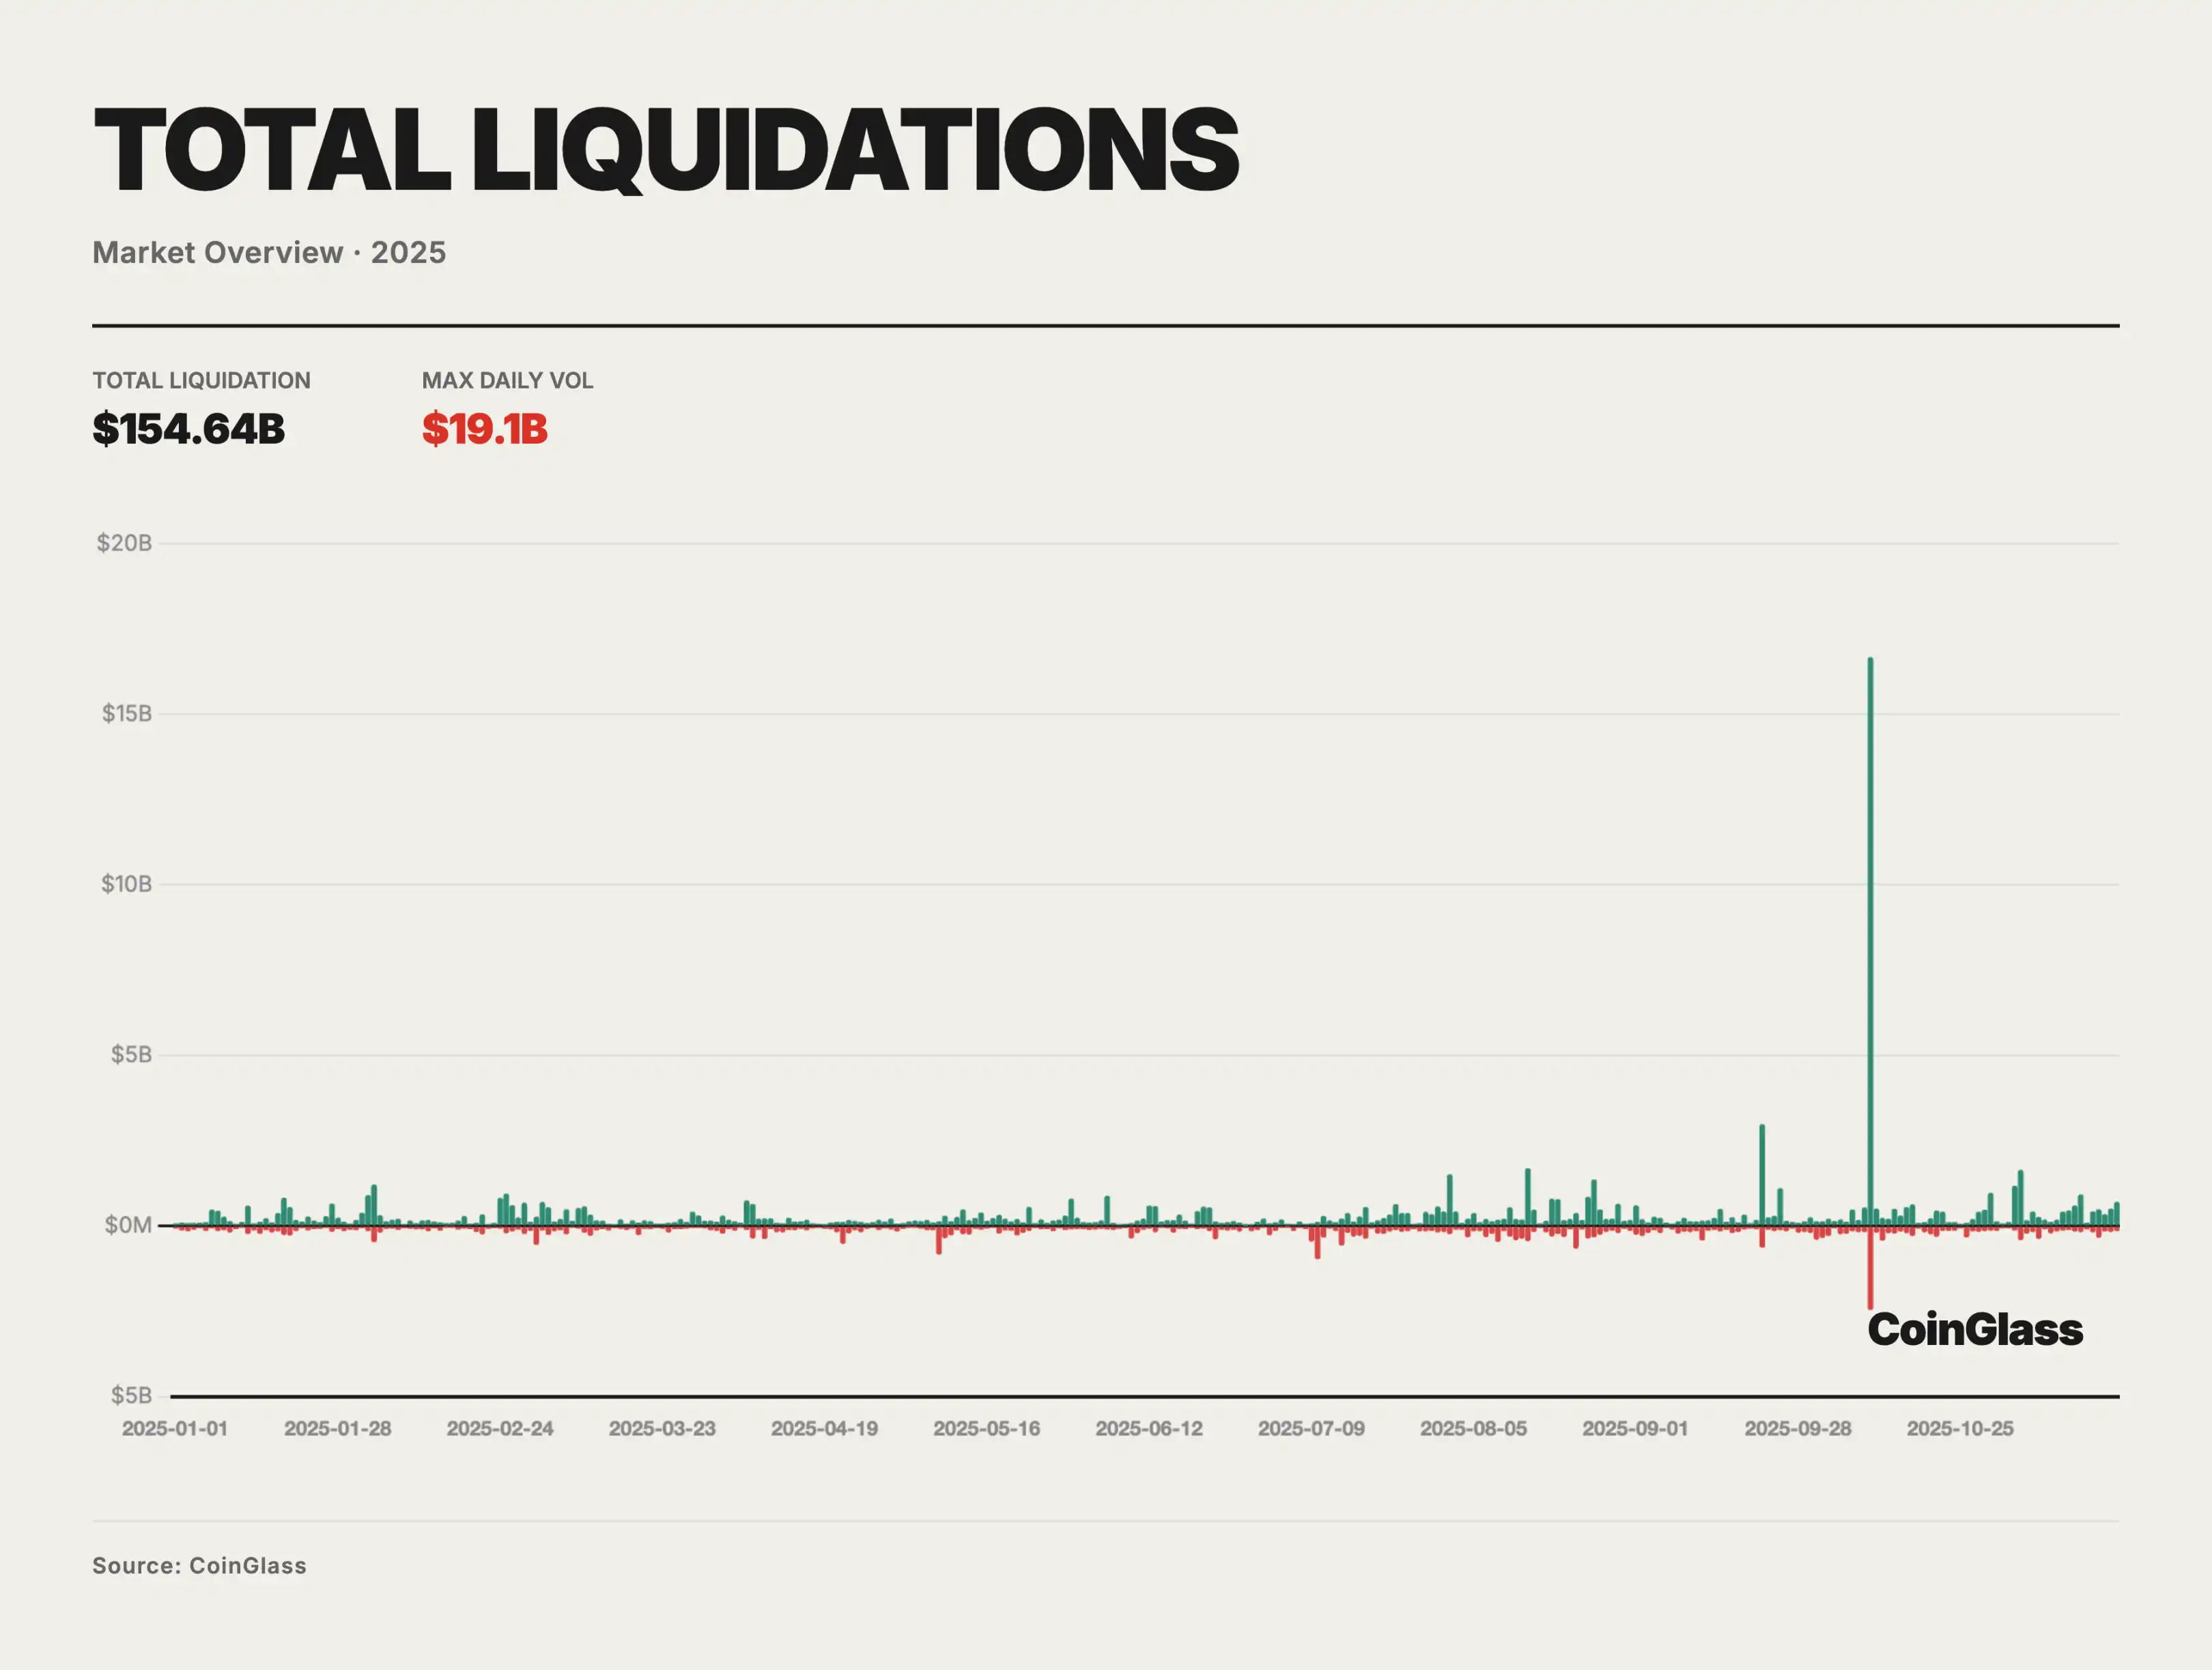
By 2025, the total nominal amount liquidated in long and short positions is around $150 billion, corresponding to a normal leverage reshuffle of approximately $4–5 billion per day. On the vast majority of trading days, the scale of liquidation due to long and short positions remains in the range of tens of millions to hundreds of millions of dollars, mainly reflecting daily margin adjustments and short-term position liquidation in a high-leverage environment, with limited long-term impact on price and structure. The truly systemic pressure is concentrated in a few extreme event windows, with the mid-October 10·10–10·11 deleveraging event being the most typical.
On October 10, 2025, the market witnessed an extreme peak in the scale of liquidations during the sample period, with long and short positions totaling over $19 billion, far exceeding the previous high points of each round of liquidation events. Combining platform disclosure rhythms and market maker feedback, the actual nominal liquidation scale may be close to $30–40 billion, several times higher than the previous cycle’s second-highest event. Structurally, on that day, liquidations were heavily skewed to the long side, with long liquidations accounting for around 85–90%, indicating that the BTC and related derivative markets were in an extremely crowded long leveraged state before the event occurred.
From a causal chain perspective, the trigger for the 10·10–10·11 event came from an exogenous macro shock. On October 10, U.S. President Trump announced a 100% tariff on Chinese imports starting from November 1 and plans to impose export controls on critical software, significantly raising the market's expectation of a new round of intense trade war, causing global risk assets to immediately shift into a pronounced risk-off mode. Prior to this, BTC had hit a historical high of around $126,000 in 2025 driven by loose expectations and risk appetite expansion, with the leverage utilization rate in the derivative market at a high level, spot and futures spreads high, and the entire system essentially in an overvalued + highly leveraged fragile state. The landing of the exogenous macro bearish news in this context became the direct trigger igniting the concentrated liquidation chain.
What truly determines the magnitude of an event's impact is the pre-existing leverage, product structure, and liquidation mechanism design. Compared to three to four years ago, the 2025 market features a higher level of open interest in perpetual contracts, more mid- to small-cap assets, and larger platforms, significantly increasing the overall nominal leverage. Meanwhile, numerous institutions employ long-short hedging, cross-asset, and cross-tenor complex strategies, presenting as "risk hedging" on the surface but inherently relying heavily on the orderly operation of liquidation engines and ADL mechanisms in extreme scenarios, where tail risks are not effectively managed. Once the liquidation and risk management mechanisms deviate from their ideal path under stress, the originally offsetting hedge legs are systemically dismantled, causing portfolios originally structured as neutral or low net exposure to involuntarily expose high directional positions.
Following the breach of a key margin threshold on October 10, the conventional per-trade liquidation logic was first triggered, leading to a mass liquidation of under-margined long positions through market price settlements, initiating the first round of cascading deleveraging. As the order book liquidity was rapidly depleted, some platforms' insurance funds struggled to fully absorb the losses, prompting the delayed activation of the automatic deleveraging (ADL) mechanism. By design, ADL is meant for forced short deleveraging in extreme scenarios when the insurance fund is insufficient to prevent a direct liquidation pressure-induced plunge to an extreme level, safeguarding the platform from insolvency as a last resort. However, in this event, the execution of ADL exhibited significant deviations in price transparency and execution path: certain positions were forcefully deleveraged at prices significantly divergent from the market price, causing bearish positions, including those of top market makers like Wintermute, to be liquidated passively at levels far from the fair price, making it nearly impossible to offset the losses through normal trading. Concurrently, ADL triggers predominantly concentrated on illiquid altcoins and long-tail contracts instead of major assets like BTC/ETH, leaving a substantial number of institutions employing structural strategies such as short BTC/long Alt exposed to rapid price declines and losing their short hedge legs within a short timeframe, leading to a sudden exposure to a significant altcoin downside. The deviation in the execution of liquidation and ADL mechanisms compounded with infrastructural issues amplified the pressure. During the extreme market conditions, several centralized platforms and on-chain channels experienced congestion in withdrawals and asset transfers, with inter-platform fund flows partially disrupted at a critical juncture, hindering the smooth execution of typical cross-exchange hedge paths, rendering market makers unable to hedge risks promptly even if willing to take on counterparty positions. In such circumstances, professional liquidity providers were compelled to retract quotes or even temporarily withdraw from the market to control risk, further relinquishing price discovery to the automation logic of liquidation engines and ADL. Simultaneously, under high load conditions, some CEX platforms faced matching and interface latency or even brief outages, compounded by the lack of explicit circuit breakers and auction mechanisms akin to traditional stock and futures markets, forcing prices to continue slipping on an order book dominated by forced liquidations, further amplifying tail-end volatility.
On the outcome front, the impact of this event on different assets and platforms was highly uneven, but we believe that the long-term impact of this event has been greatly underestimated. The maximum drawdown of mainstream assets such as BTC and ETH was roughly in the 10–15% range, while a large number of altcoins and long-tail assets experienced extreme retracements of 80% or even close to zero, reflecting that the liquidation chain and ADL execution resulted in the most severe price distortions on the least liquid targets. In comparison to the Terra/3AC period of 2022, this round of events did not trigger a large-scale institutional chain default. While market-making firms like Wintermute suffered some losses due to the ADL mechanism, their overall capital remains adequate, with risks more concentrated on specific strategies and assets rather than spreading across the entire system through complex market structures.
On-Chain Derivatives and DAT
On-Chain Derivatives
The 2025 fiscal year was not only a watershed in the history of digital assets development but also a crucial year for CME to establish its position as the global cryptocurrency pricing and risk transfer center. If 2024 was the inaugural year of spot ETFs, then 2025 was the deepening year of on-chain derivatives markets. In this year, we witnessed institutional capital shifting from mere passive allocation to actively managing through complex derivative strategies. The liquidity moat between compliant on-chain derivative markets and unregulated offshore markets was completely restructured.
The most disruptive product innovation in 2025 was undoubtedly the launch and popularization of Spot-Quoted Futures (with codes QBTC and QETH). Unlike traditional futures, these contracts aim to provide a closer anchoring to spot prices through a special settlement mechanism, significantly reducing basis risk and rollover costs.
With the launch of the CME BTC Volatility Index BVX real-time data, the market will likely see tradable volatility futures in 2026. Institutional investors will have, for the first time, a tool to hedge unknown risks directly without having to simulate through complex option combinations.
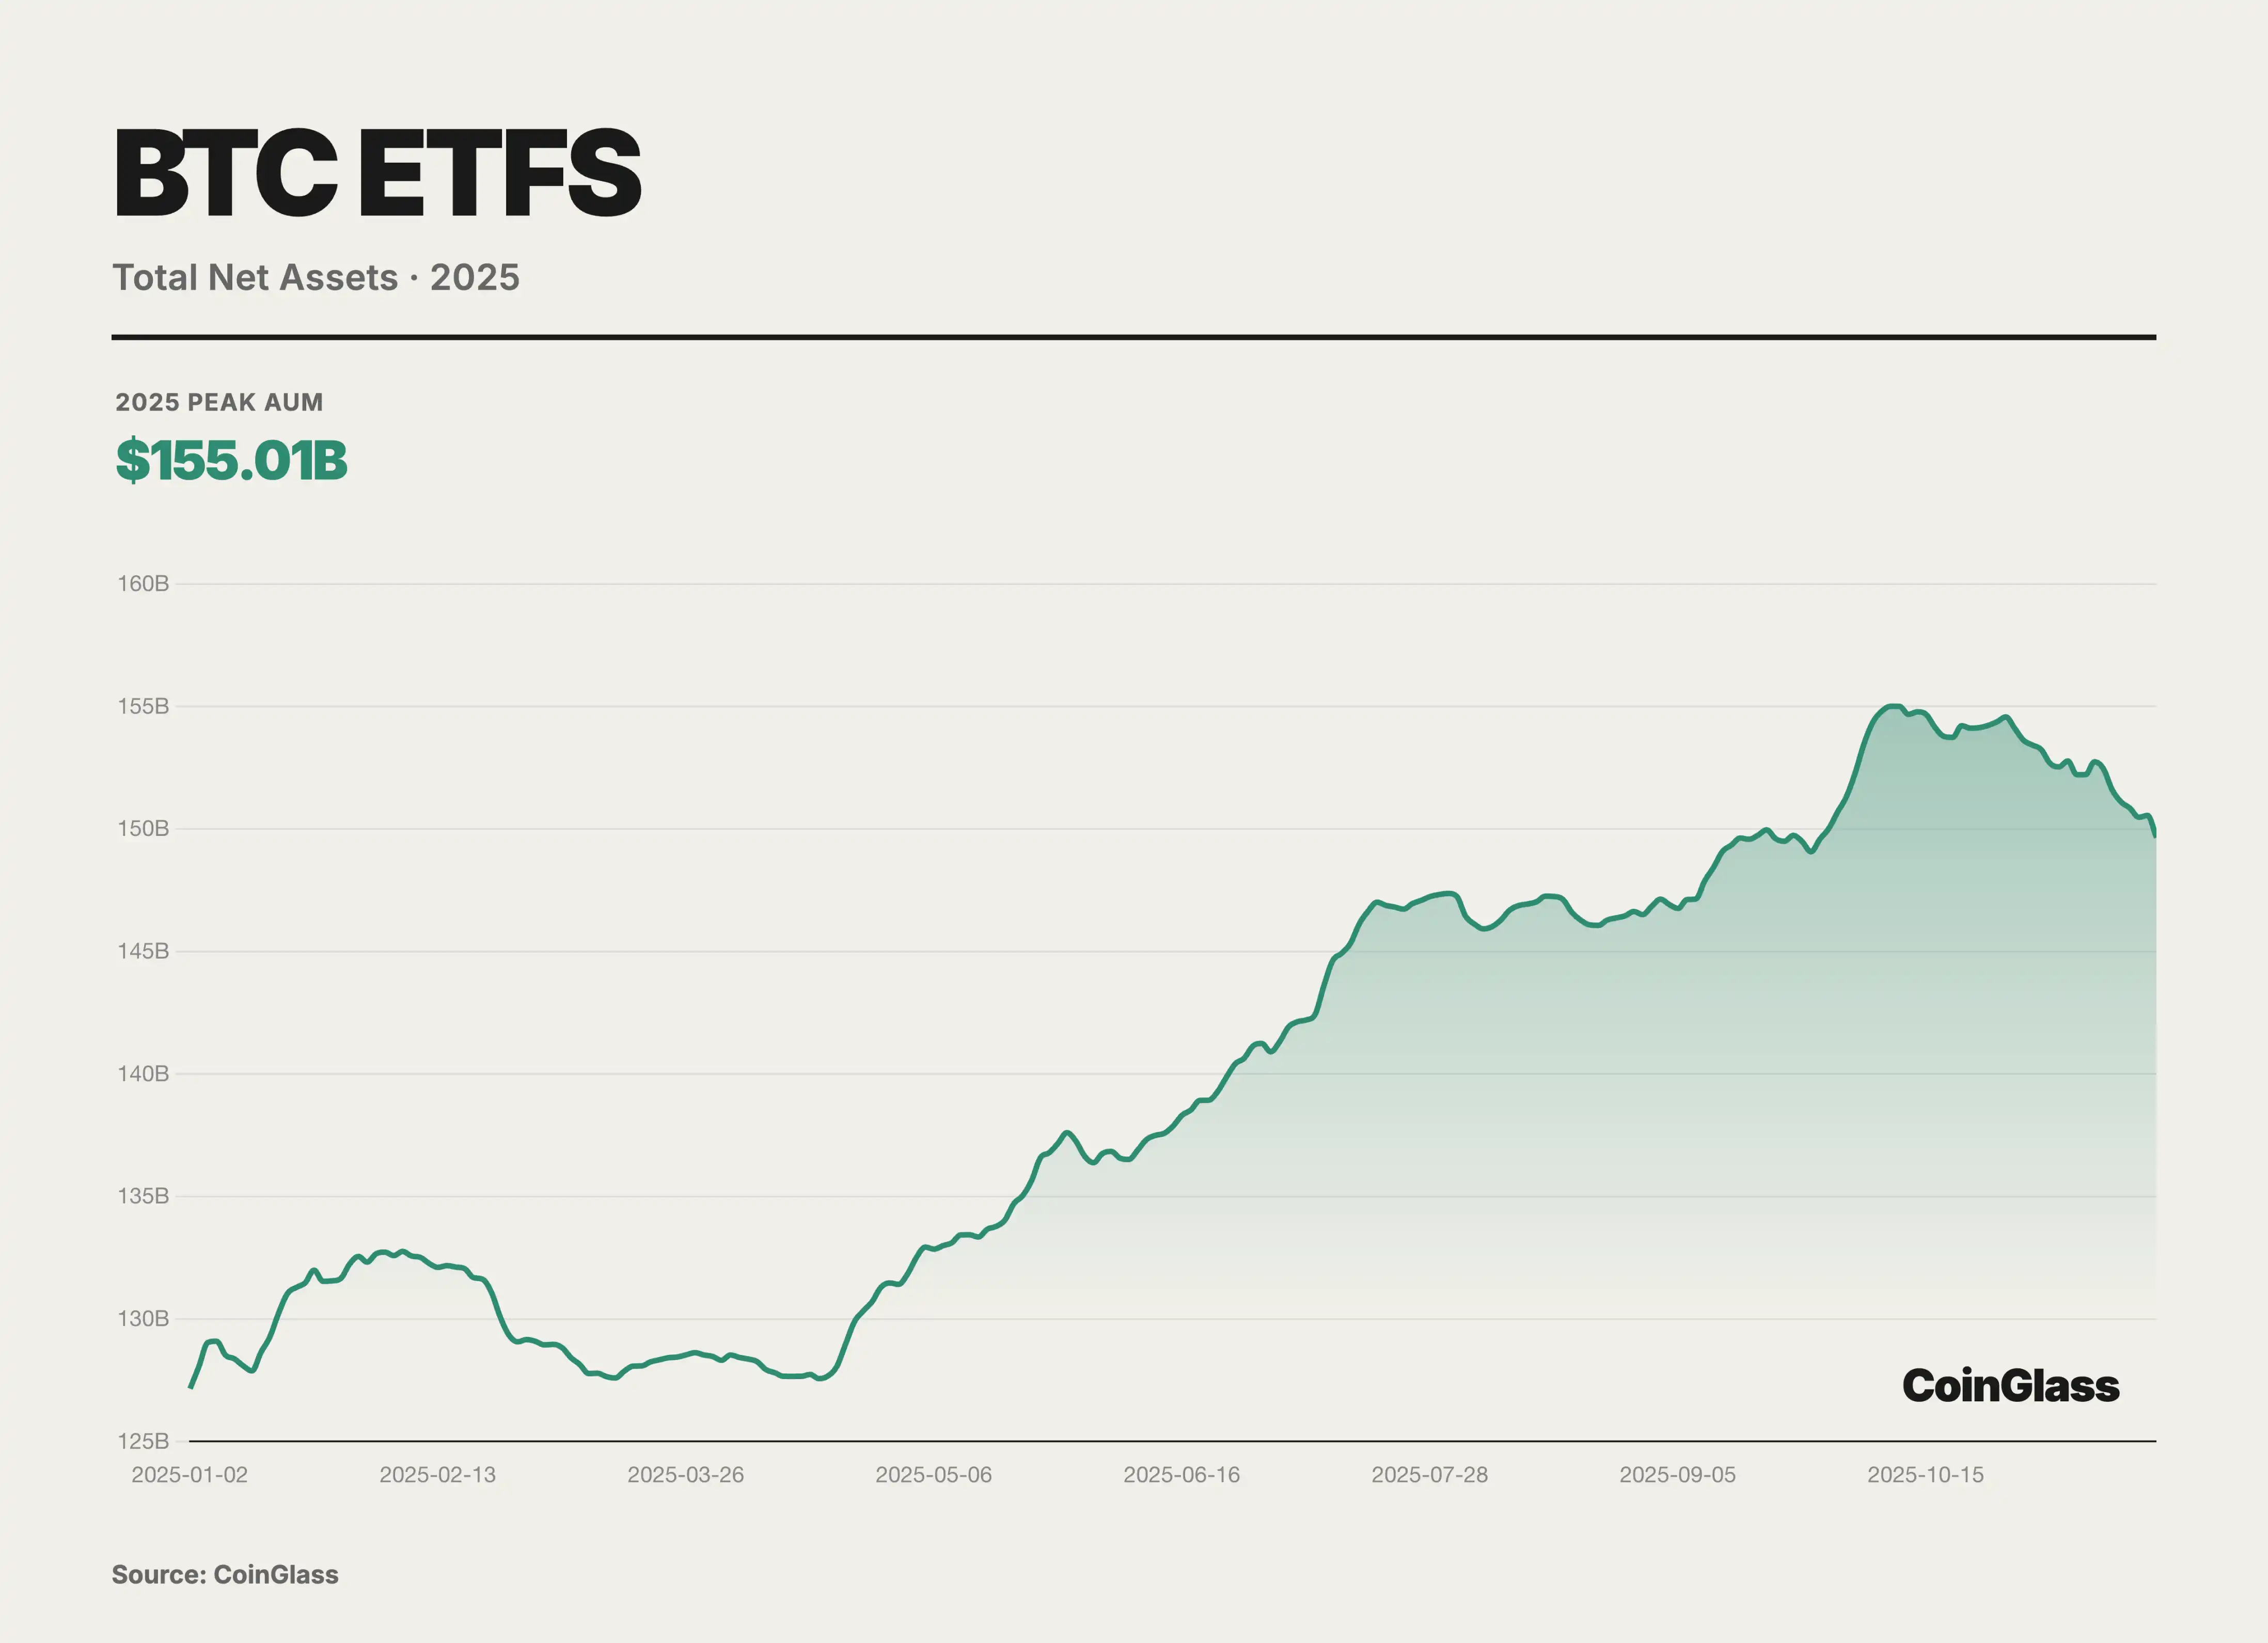
In 2025, we witnessed the normalization and scaling of basis trading. With the exponential growth of spot ETF assets under management, using CME futures for cash and carry arbitrage has not only become a mainstream strategy for hedge funds but also a vital link connecting traditional financial rates with native crypto yields.
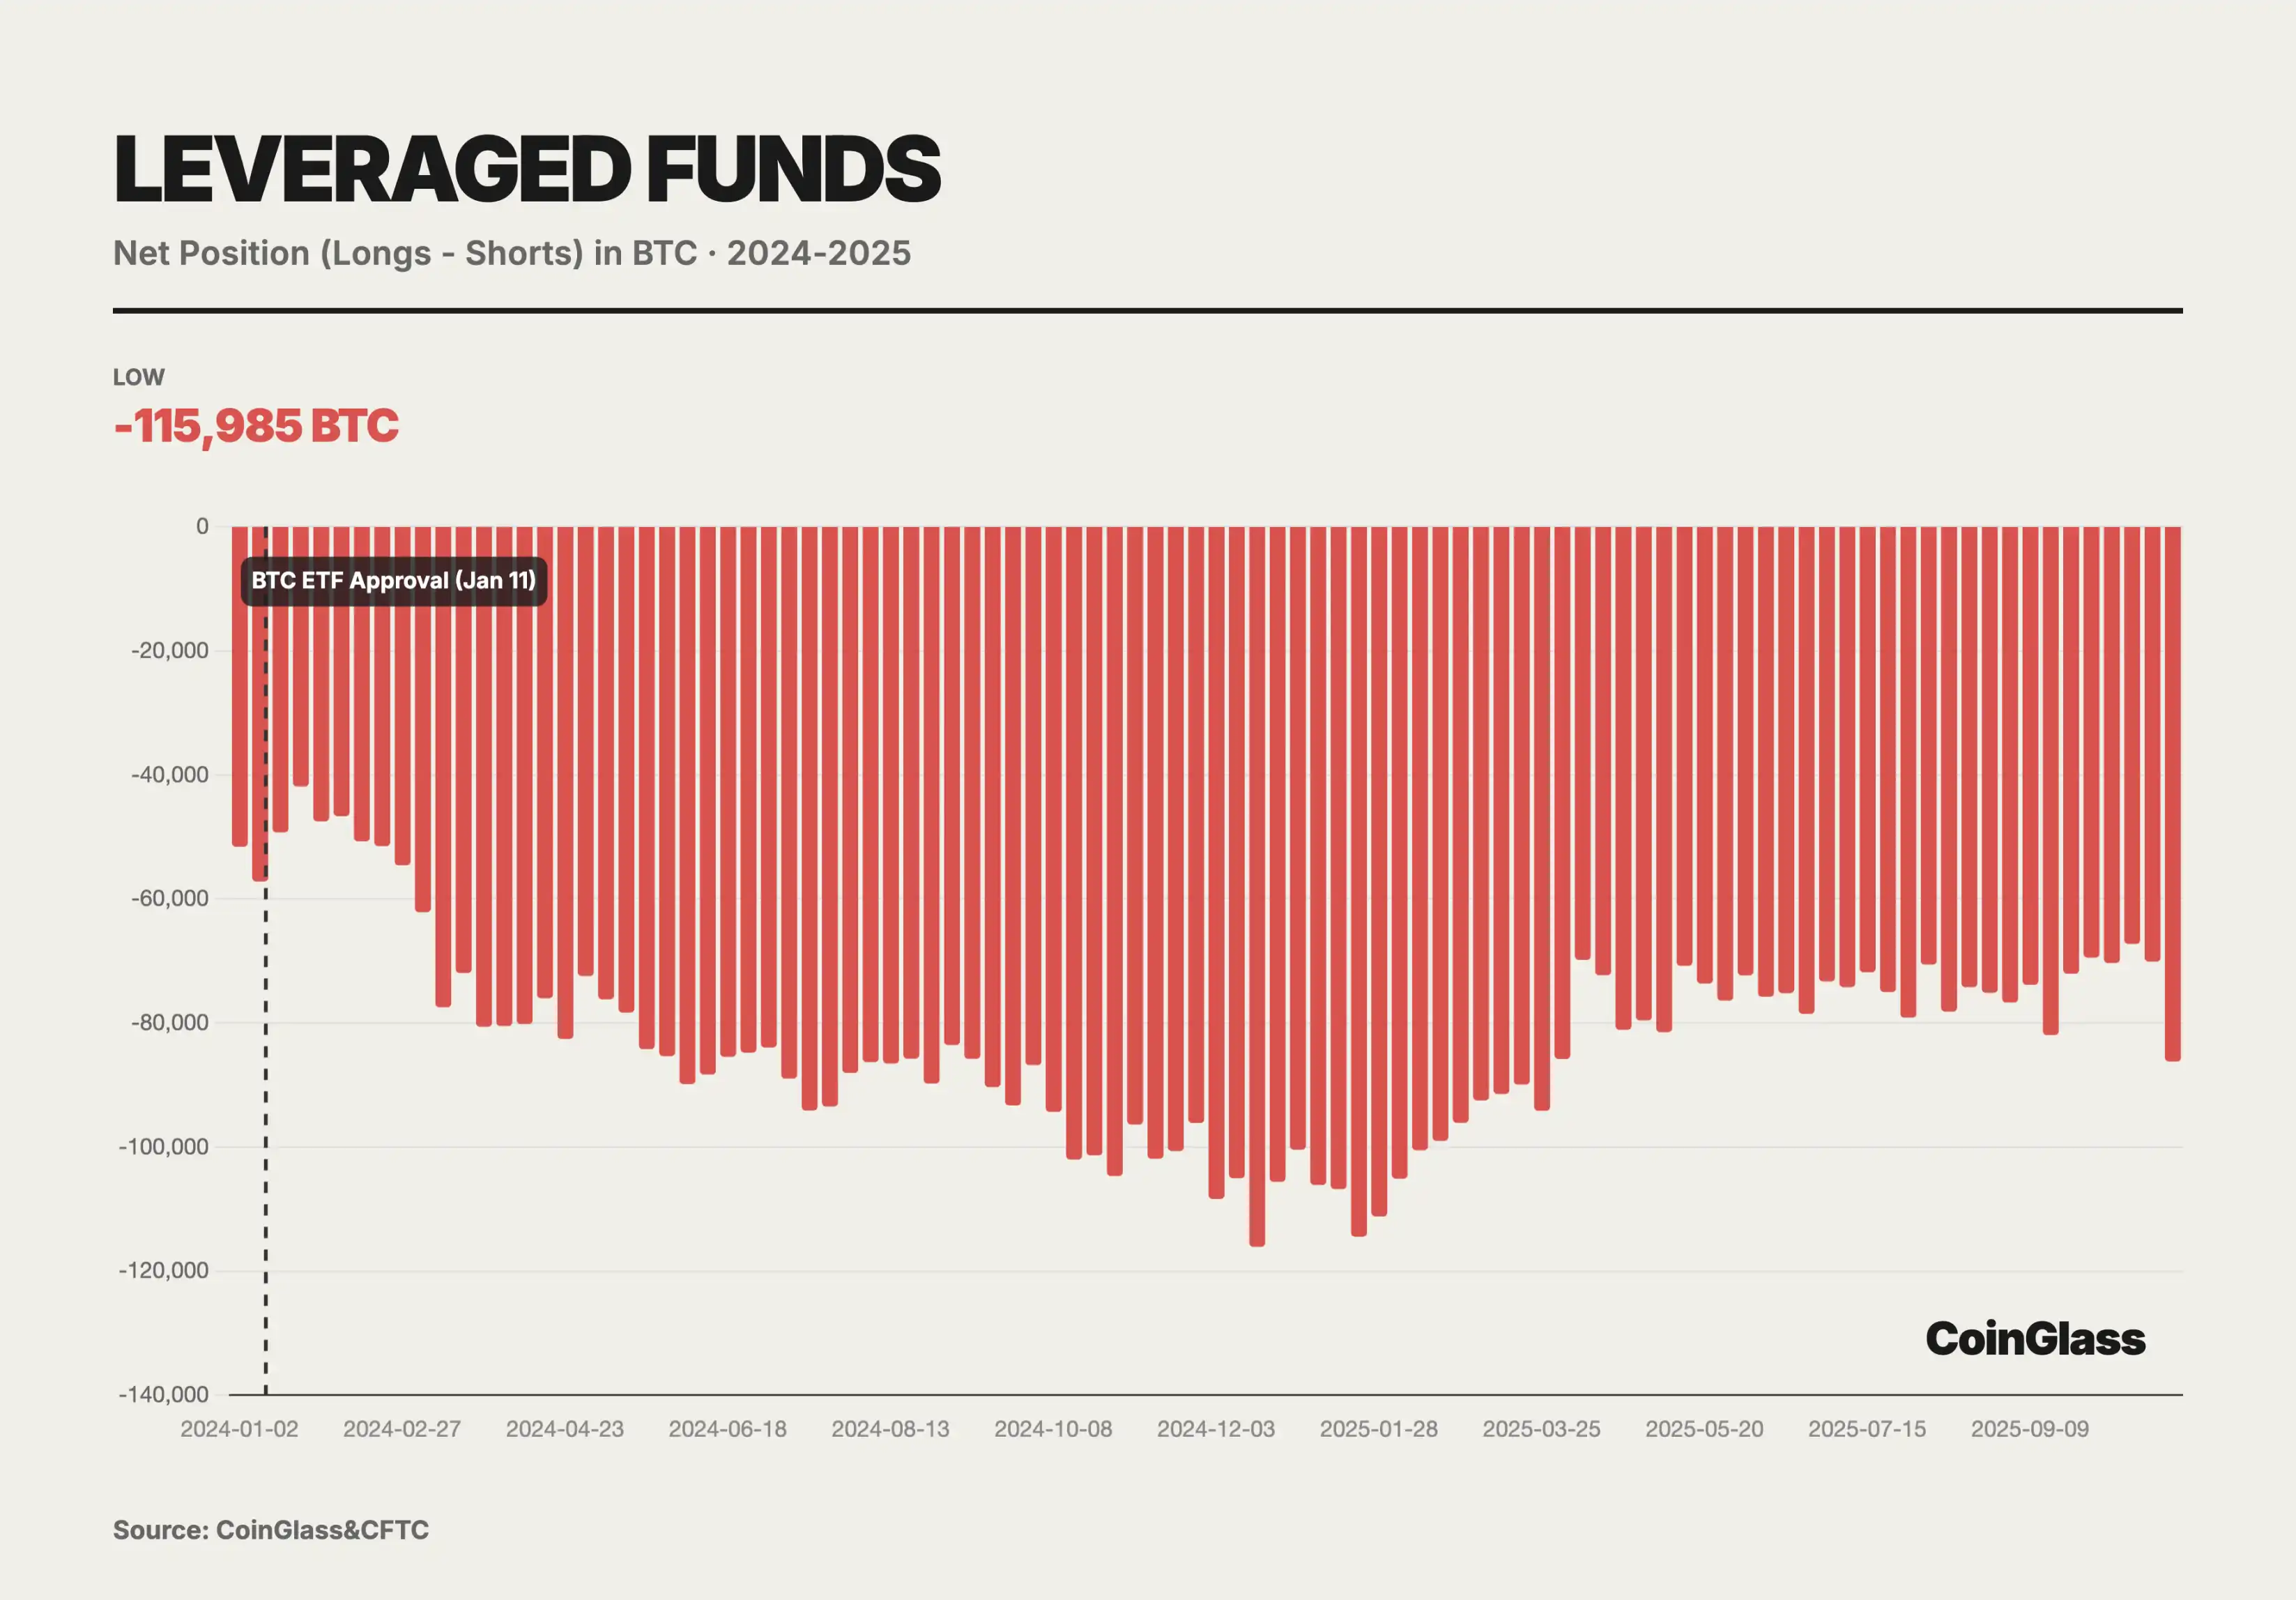
Currently, leveraged funds hold a net short position of up to 14,000 contracts. A deep dive analysis reveals that this is actually a direct derivative of basis trading. Leveraged funds buy BTC in the spot market or through ETFs while simultaneously selling an equivalent amount of futures contracts on the CME. This combination is Delta neutral and aims to earn the basis return where futures price is higher than spot price. As inflows into spot ETFs increase, the net short positions of leveraged funds also rise in sync. This demonstrates that short positions are not directional shorts but are instead to hedge long inventory from spot ETFs. At its peak, leveraged funds held a net short of 115,985 BTC, showing that these funds are the primary providers of liquidity and porters of spot ETFs.
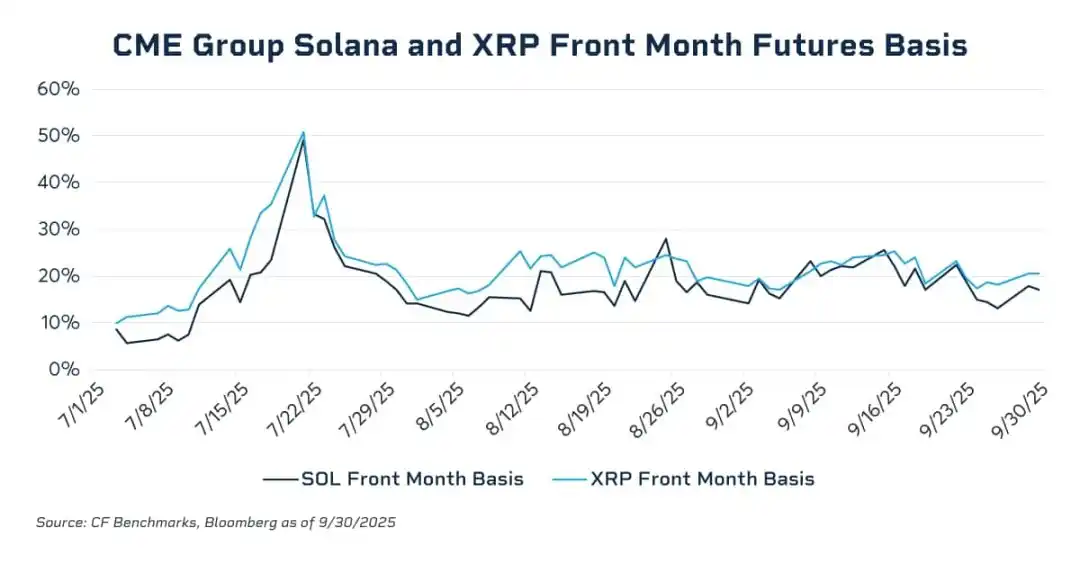
Data shows that the annualized basis of the front-month contract surged to the 20-25% range during the bull market in November 2024, but compressed to near 0 during the Q1 deleveraging period. In July 2025, the annualized basis of the SOL and XRP near-month futures contracts spiked to almost 50%, much higher than the basis levels usually seen in BTC futures, clearly exposing a lack of effective cross-market arbitrage forces in the related markets. Without highly liquid, regulated spot investment instruments, institutional funds struggle to deploy cash-and-carry trades and basis arbitrage structures at scale between futures shorts and spot longs, naturally unable to sustainably suppress the high basis premiums. With the introduction of SOL and XRP spot ETFs under a general listing regulatory framework, this structural gap is partially filled, providing the necessary spot exposure and liquidity foundation for compliant institutional capital to enter the market and compress futures basis through arbitrage. With CFTC approval for spot trading, it is highly likely that margin offsets between spot and futures will be realized by 2026. This will unleash billions of dollars in idle capital, greatly enhancing market leverage efficiency. At that time, the friction cost of basis trading will decrease to historically low levels, and the basis level may further converge to traditional commodity levels.
In November 2025, the average daily trading volume of CME's cryptocurrency segment reached a historic 424,000 contracts, with a nominal value of $13.2 billion, a 78% year-on-year increase. This data surpassed any single month's performance in 2024 and approached the levels seen during the peak of the 2021 bull market, but with a healthier composition driven more by institutional hedging and arbitrage rather than pure retail speculation.
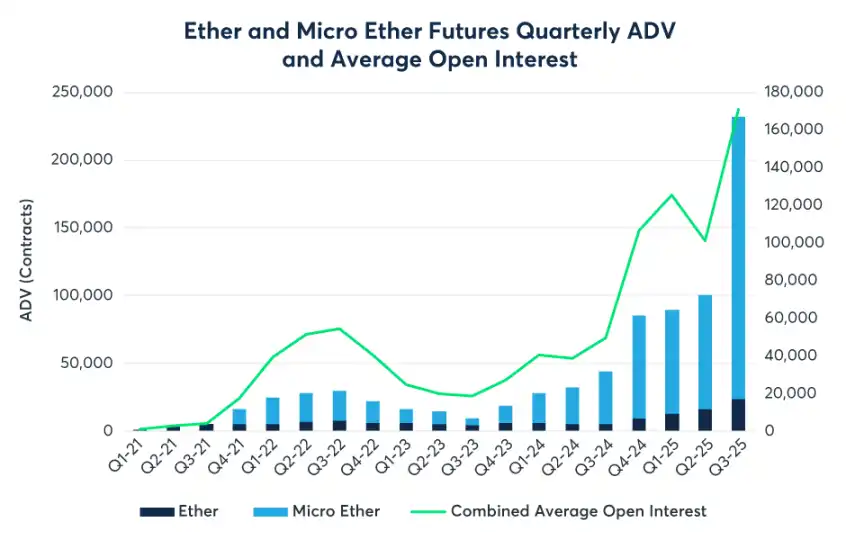
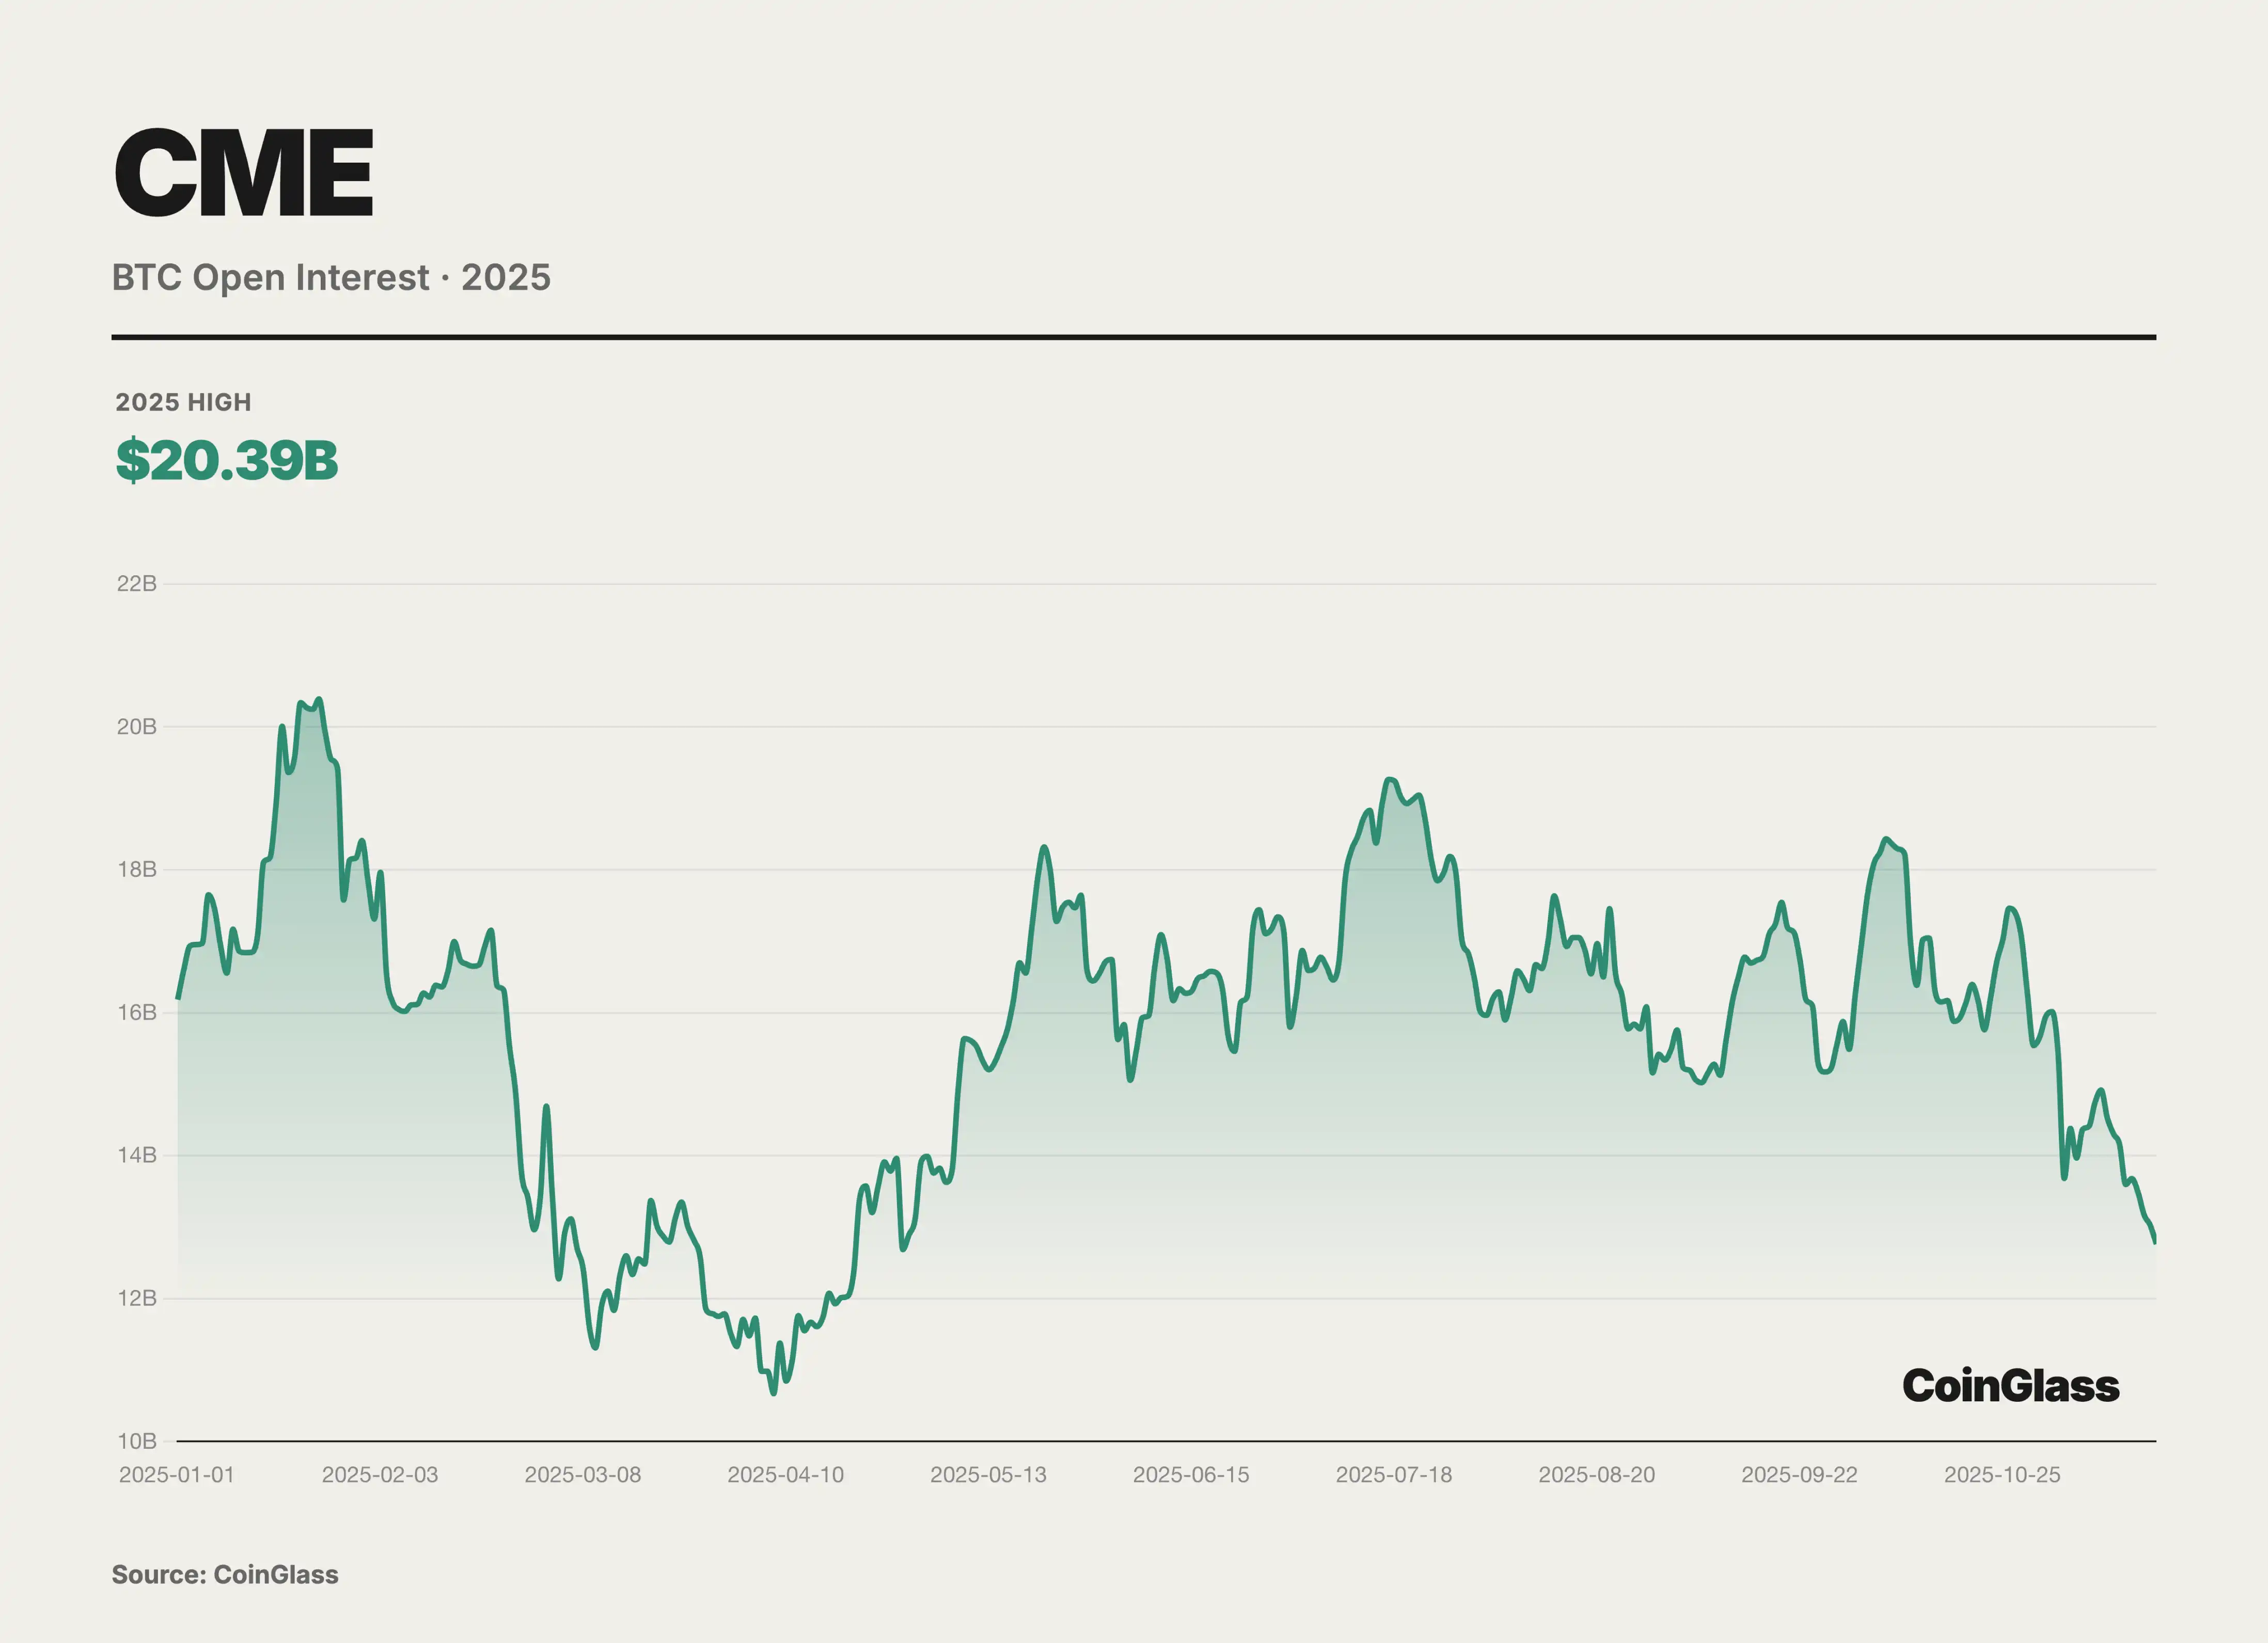
Although BTC continues to maintain an absolute advantage in nominal holdings, 2025 was a year of explosive ETH derivatives liquidity. Data shows that the third-quarter average daily trading volume of ETH futures surged by 355% year-on-year, far outpacing BTC's growth rate. The passage of the GENIUS Act in July 2025 broke through the final regulatory barrier for traditional financial institutions entering the market from a policy standpoint, directly driving the CME cryptocurrency complex to achieve a record $31.3 billion in average daily open interest in Q3. Micro contracts continue to play a key role in liquidity. The ADV of Micro ETH Futures (MET) in Q3 reached an astonishing 208,000 contracts. According to broker data, many mid-sized hedge funds and family offices prefer to use micro contracts for position adjustments to more precisely align with the scale of their spot investment portfolios, avoiding the granularity issues posed by standard contracts (5 BTC / 50 ETH).
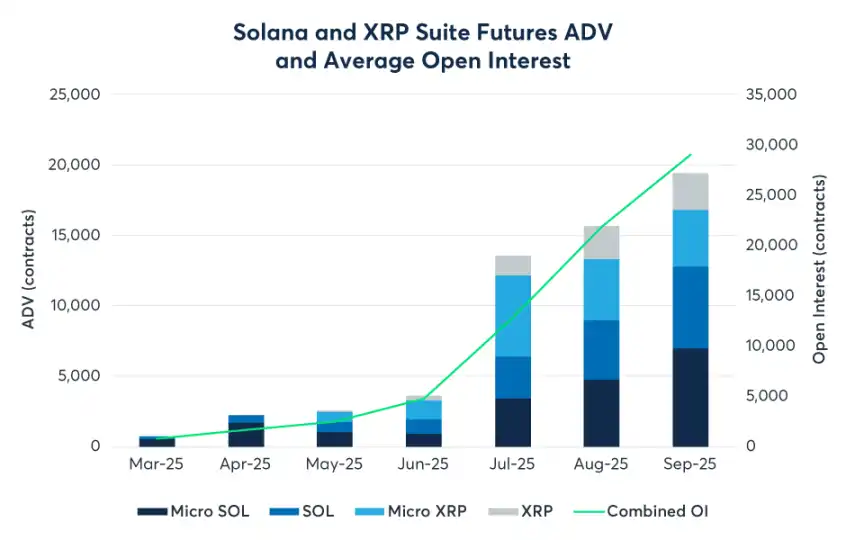
For a long time, CME has been a duopoly market for BTC and ETH. However, this duopoly was broken in 2025. With the launch of SOL and XRP futures and options, CME officially entered the era of multi-asset. SOL, as a strong competitor as the third-largest asset, has performed outstandingly since the launch of SOL futures in March. As of Q3, the total trading volume reached 730,000 contracts, with a nominal value of $340 billion. More importantly, the OI of SOL futures rapidly broke through $2.1 billion in September, setting the record for the fastest doubling of open interest in a new contract. Meanwhile, XRP futures have traded 476,000 contracts since their launch in May. The XRP options launched on October 13 became the first such CFTC-regulated product in the market. It signaled that institutional investors no longer equate cryptocurrency with BTC. For assets with different risk-return characteristics like SOL and XRP, institutions are starting to seek compliant hedging channels, foreshadowing a more active presence of multi-strategy crypto hedge funds on CME in the future.
DAT
At the beginning of the 2025 fiscal year, the update ASU 2023-08 issued by the Financial Accounting Standards Board (FASB) officially took effect, and this rule change laid the foundation for the explosive growth of the DAT sector's financial performance this year. The new standard mandates companies to use fair value measurement for specific crypto assets and directly include fair value changes in the current period's net income. Digital Asset Treasury (DAT) refers to: publicly traded companies that have systematically shifted a significant portion of their treasury reserves, far beyond daily operational needs, from cash and short-term debt to digital assets such as BTC, ETH, SOL, and more. They treat crypto assets as a core allocation on the balance sheet, not marginal speculative positions. Unlike spot ETFs, DAT is not a passive tracking tool but a corporate entity with full operational and capital operation capabilities. Company management can continuously increase the per-share amount of digital assets through value-added financing methods like convertible bonds, ATM issuance, forming the so-called DAT flywheel effect. When the stock price is at a premium to Net Asset Value (NAV), the company can issue shares to buy more digital assets, diluting equity while increasing the per-share currency holdings, thereby supporting or even amplifying the premium.
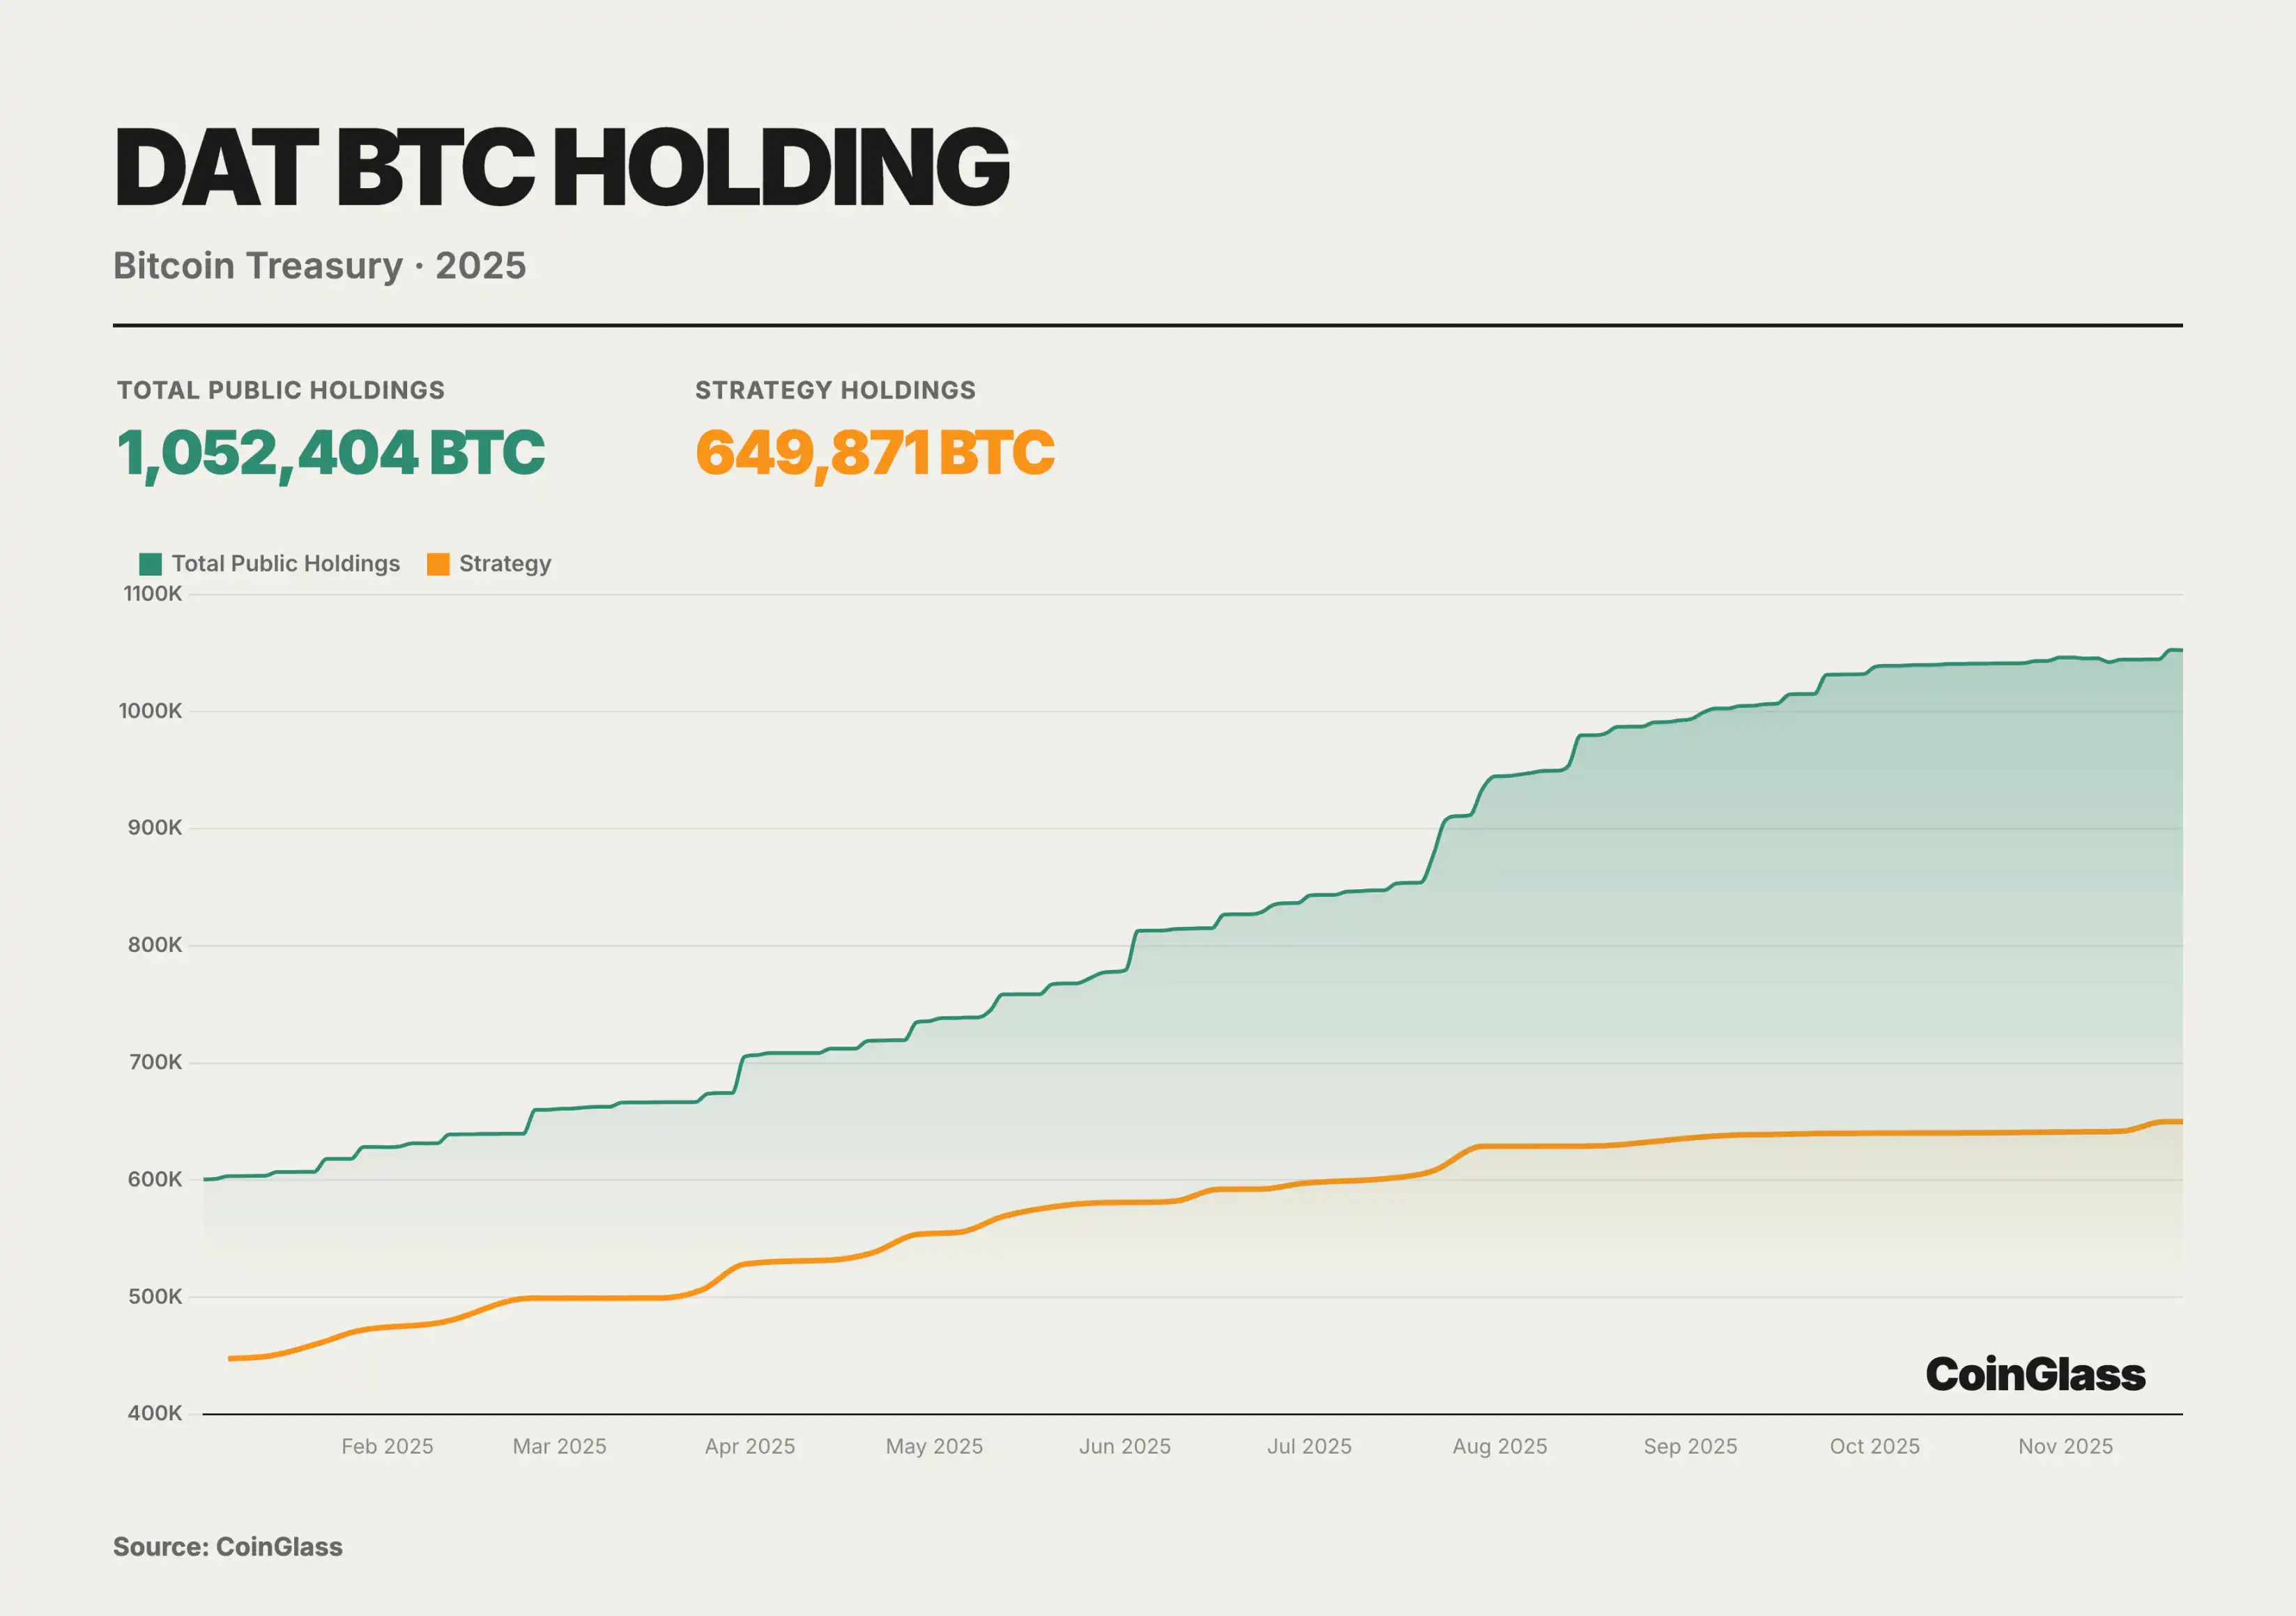
Within 2025, the BTC holdings of publicly traded companies through DAT followed an almost monotonically upward trajectory, increasing from a total of about 600,000 coins at the beginning of the year to around 1.05 million coins in November, accounting for approximately 5% of the theoretical total BTC supply; among them, Strategy A increased its holdings from about 447,000 coins to around 650,000 coins. At an absolute level, it remains the irreplaceable core of the treasury but has slipped from about 70% market share to just over 60%, with the majority of the increase coming from small and medium DAT.
In the second and third quarters, various models of DAT collective running entered the stage, pushing the total BTC holdings beyond the one million mark. By the fourth quarter, although net fund inflows plummeted from their peak and the DAT stock price premium was significantly squeezed, the curve only showed a slowing slope rather than a reversal in direction, with no systemic deleveraging or forced liquidation. The trend indicates that the so-called burst of the bubble is more of a repricing at the equity level rather than a collapse of the asset-side BTC position. DAT has transitioned from a round of thematic trading to a structural buying layer within the regulatory framework, forming a layer of BTC supply-side buffer locked in by corporate governance, accounting standards, and disclosure rules. At the same time, the industry structure has evolved from "dominance by a single whale" to "whale + long tail group," shifting the risk focus from the coin price itself to the individual DAT's funding structure, corporate governance, and regulatory impacts. The key to the DAT sector is no longer predicting the short-term price fluctuations of BTC but understanding the financing structure, derivative exposure, and macro hedging logic behind these companies. In the upcoming year 2026, as the MSCI index review approaches and a potential shift in global monetary policy looms, the volatility test that DAT companies face has only just begun.
Options Market
The core narrative of the options market this year is defined by two major milestone events, which have collectively reshaped the global digital asset pricing power logic. The first is the acquisition of the offshore options giant Deribit by the largest U.S. compliant exchange Coinbase for $29 billion, a deal that not only marks the integration of traditional compliant exchanges with native crypto liquidity but also redefines the global derivatives trading infrastructure landscape. The second is the rise of BlackRock's IBIT ETF options, which, by the end of the third quarter of 2025, surpassed the long-standing leader Deribit in open interest for the first time, signaling that traditional financial capital has officially been neck and neck with the crypto-native platforms in volatility pricing power. Prior to this, Deribit had enjoyed a near-monopoly advantage, controlling approximately 85% of the global crypto options market share by the end of 2024.
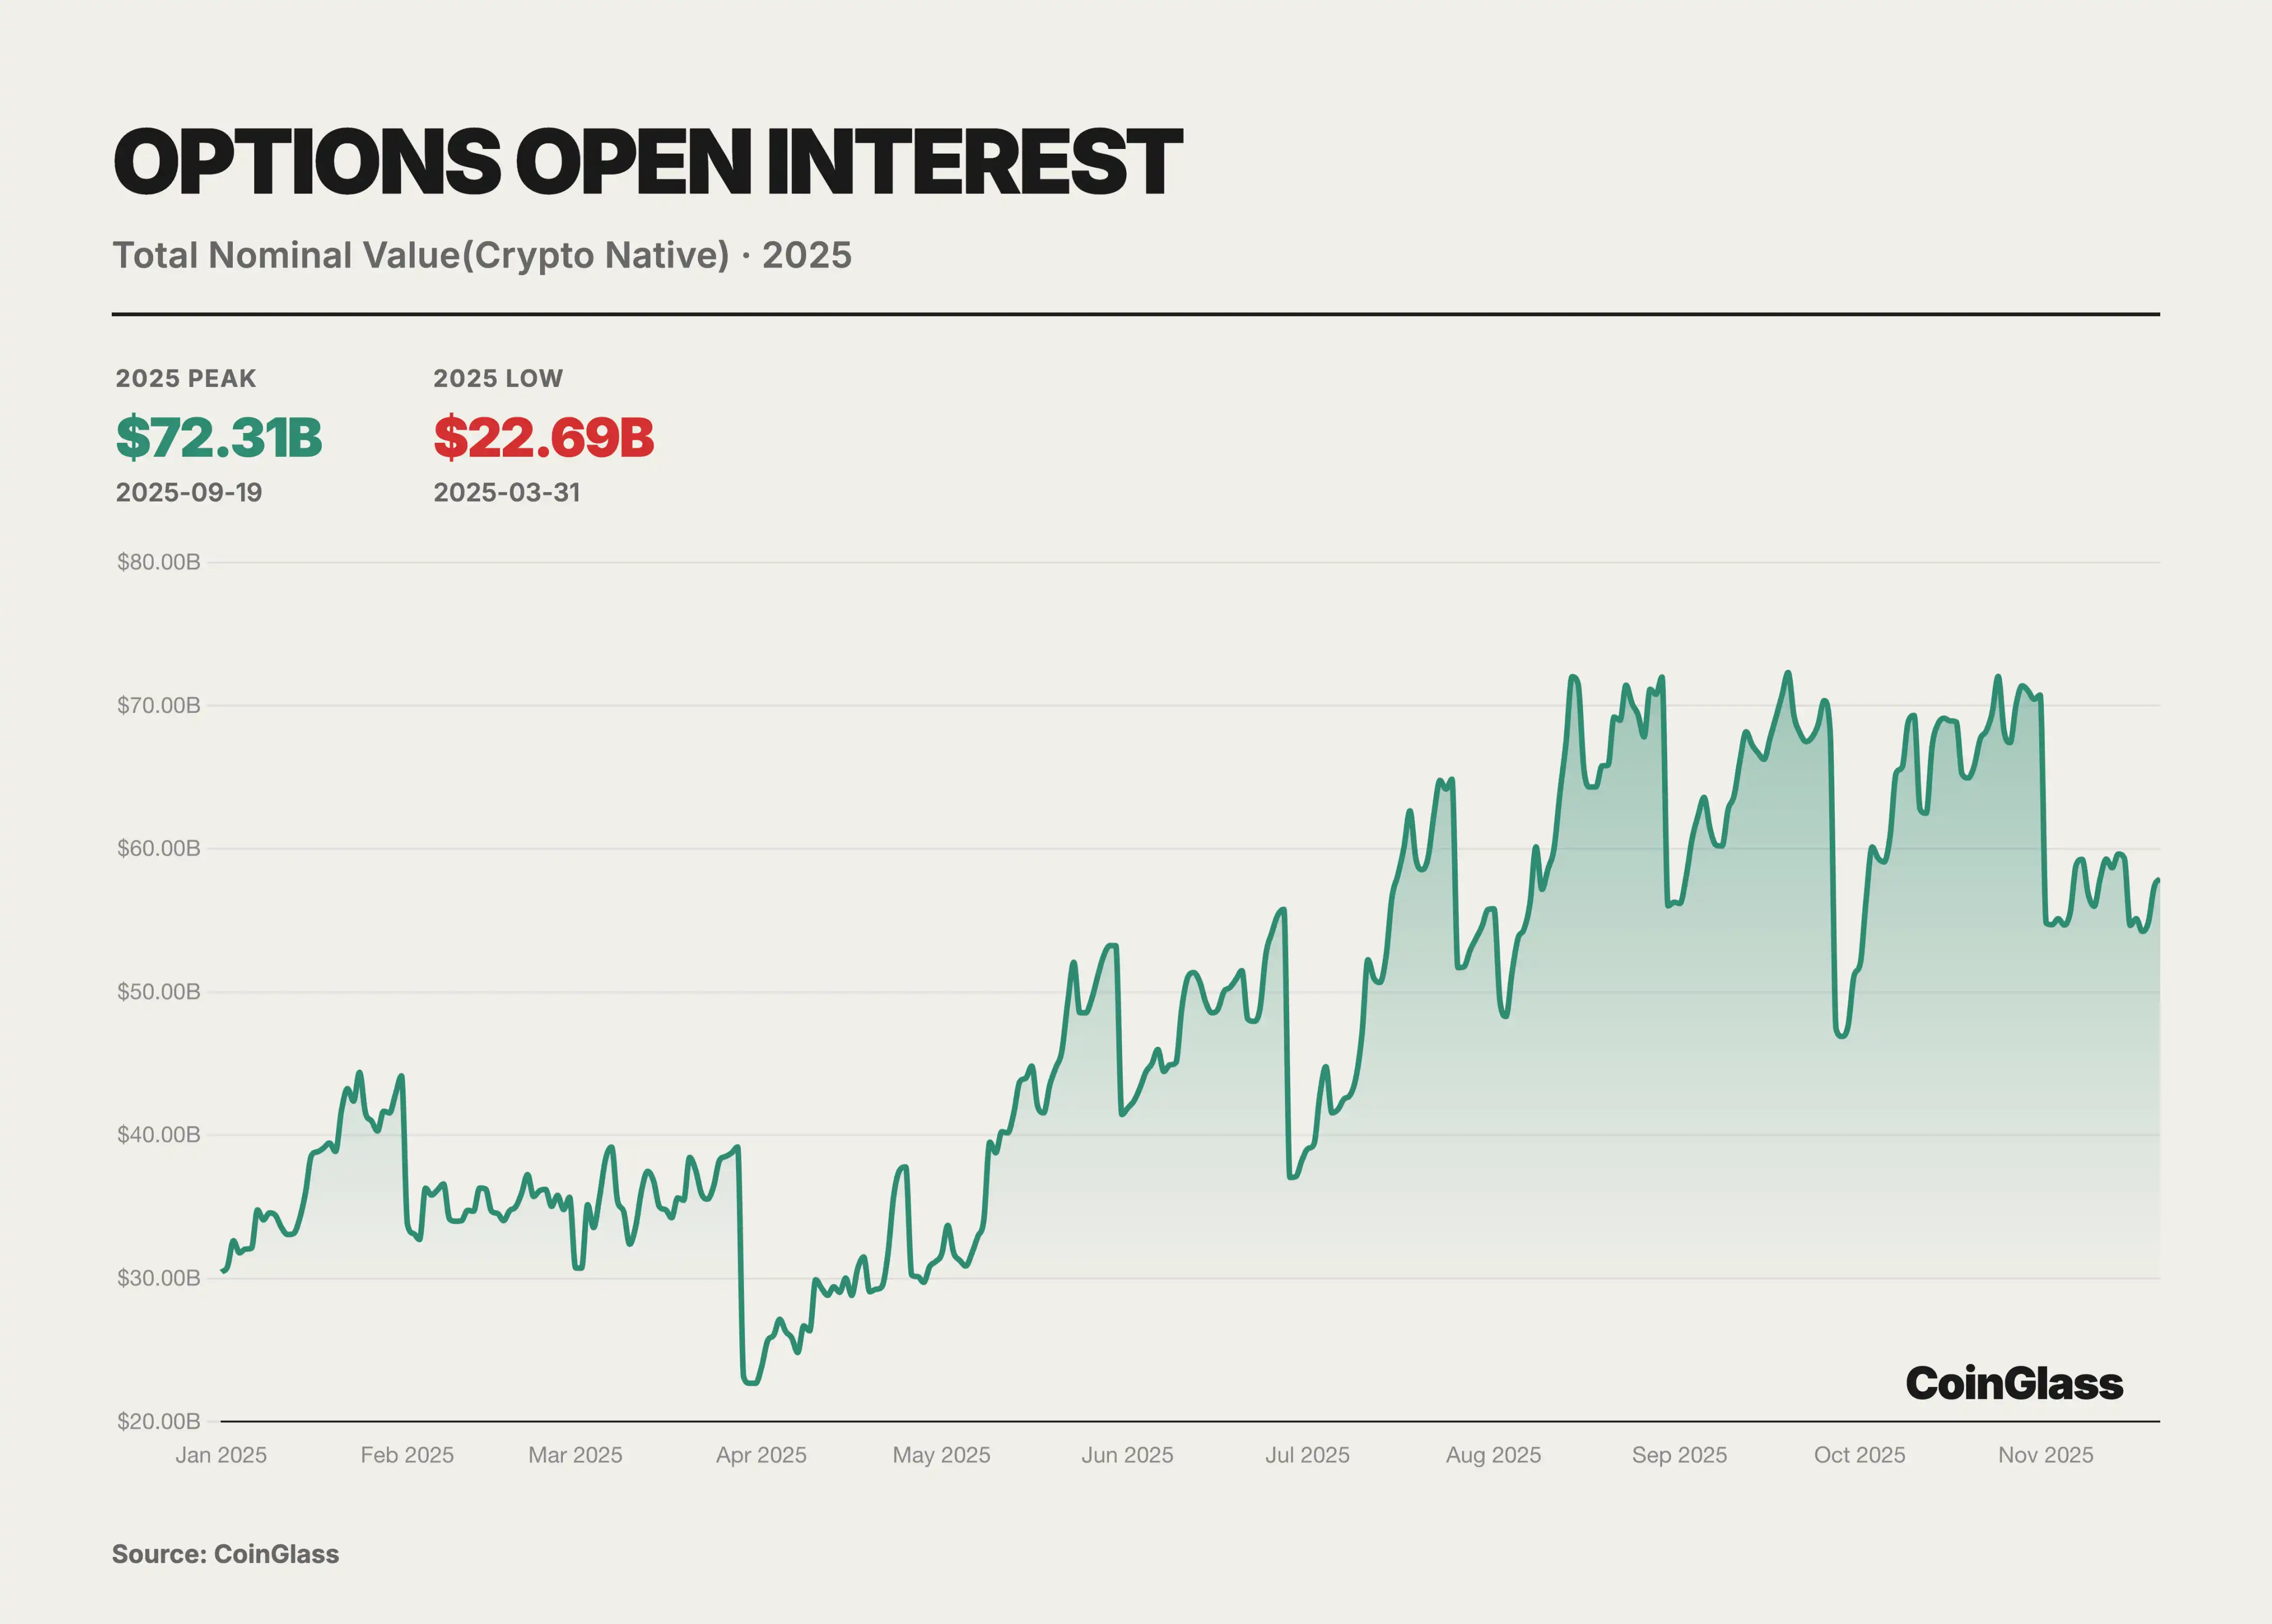
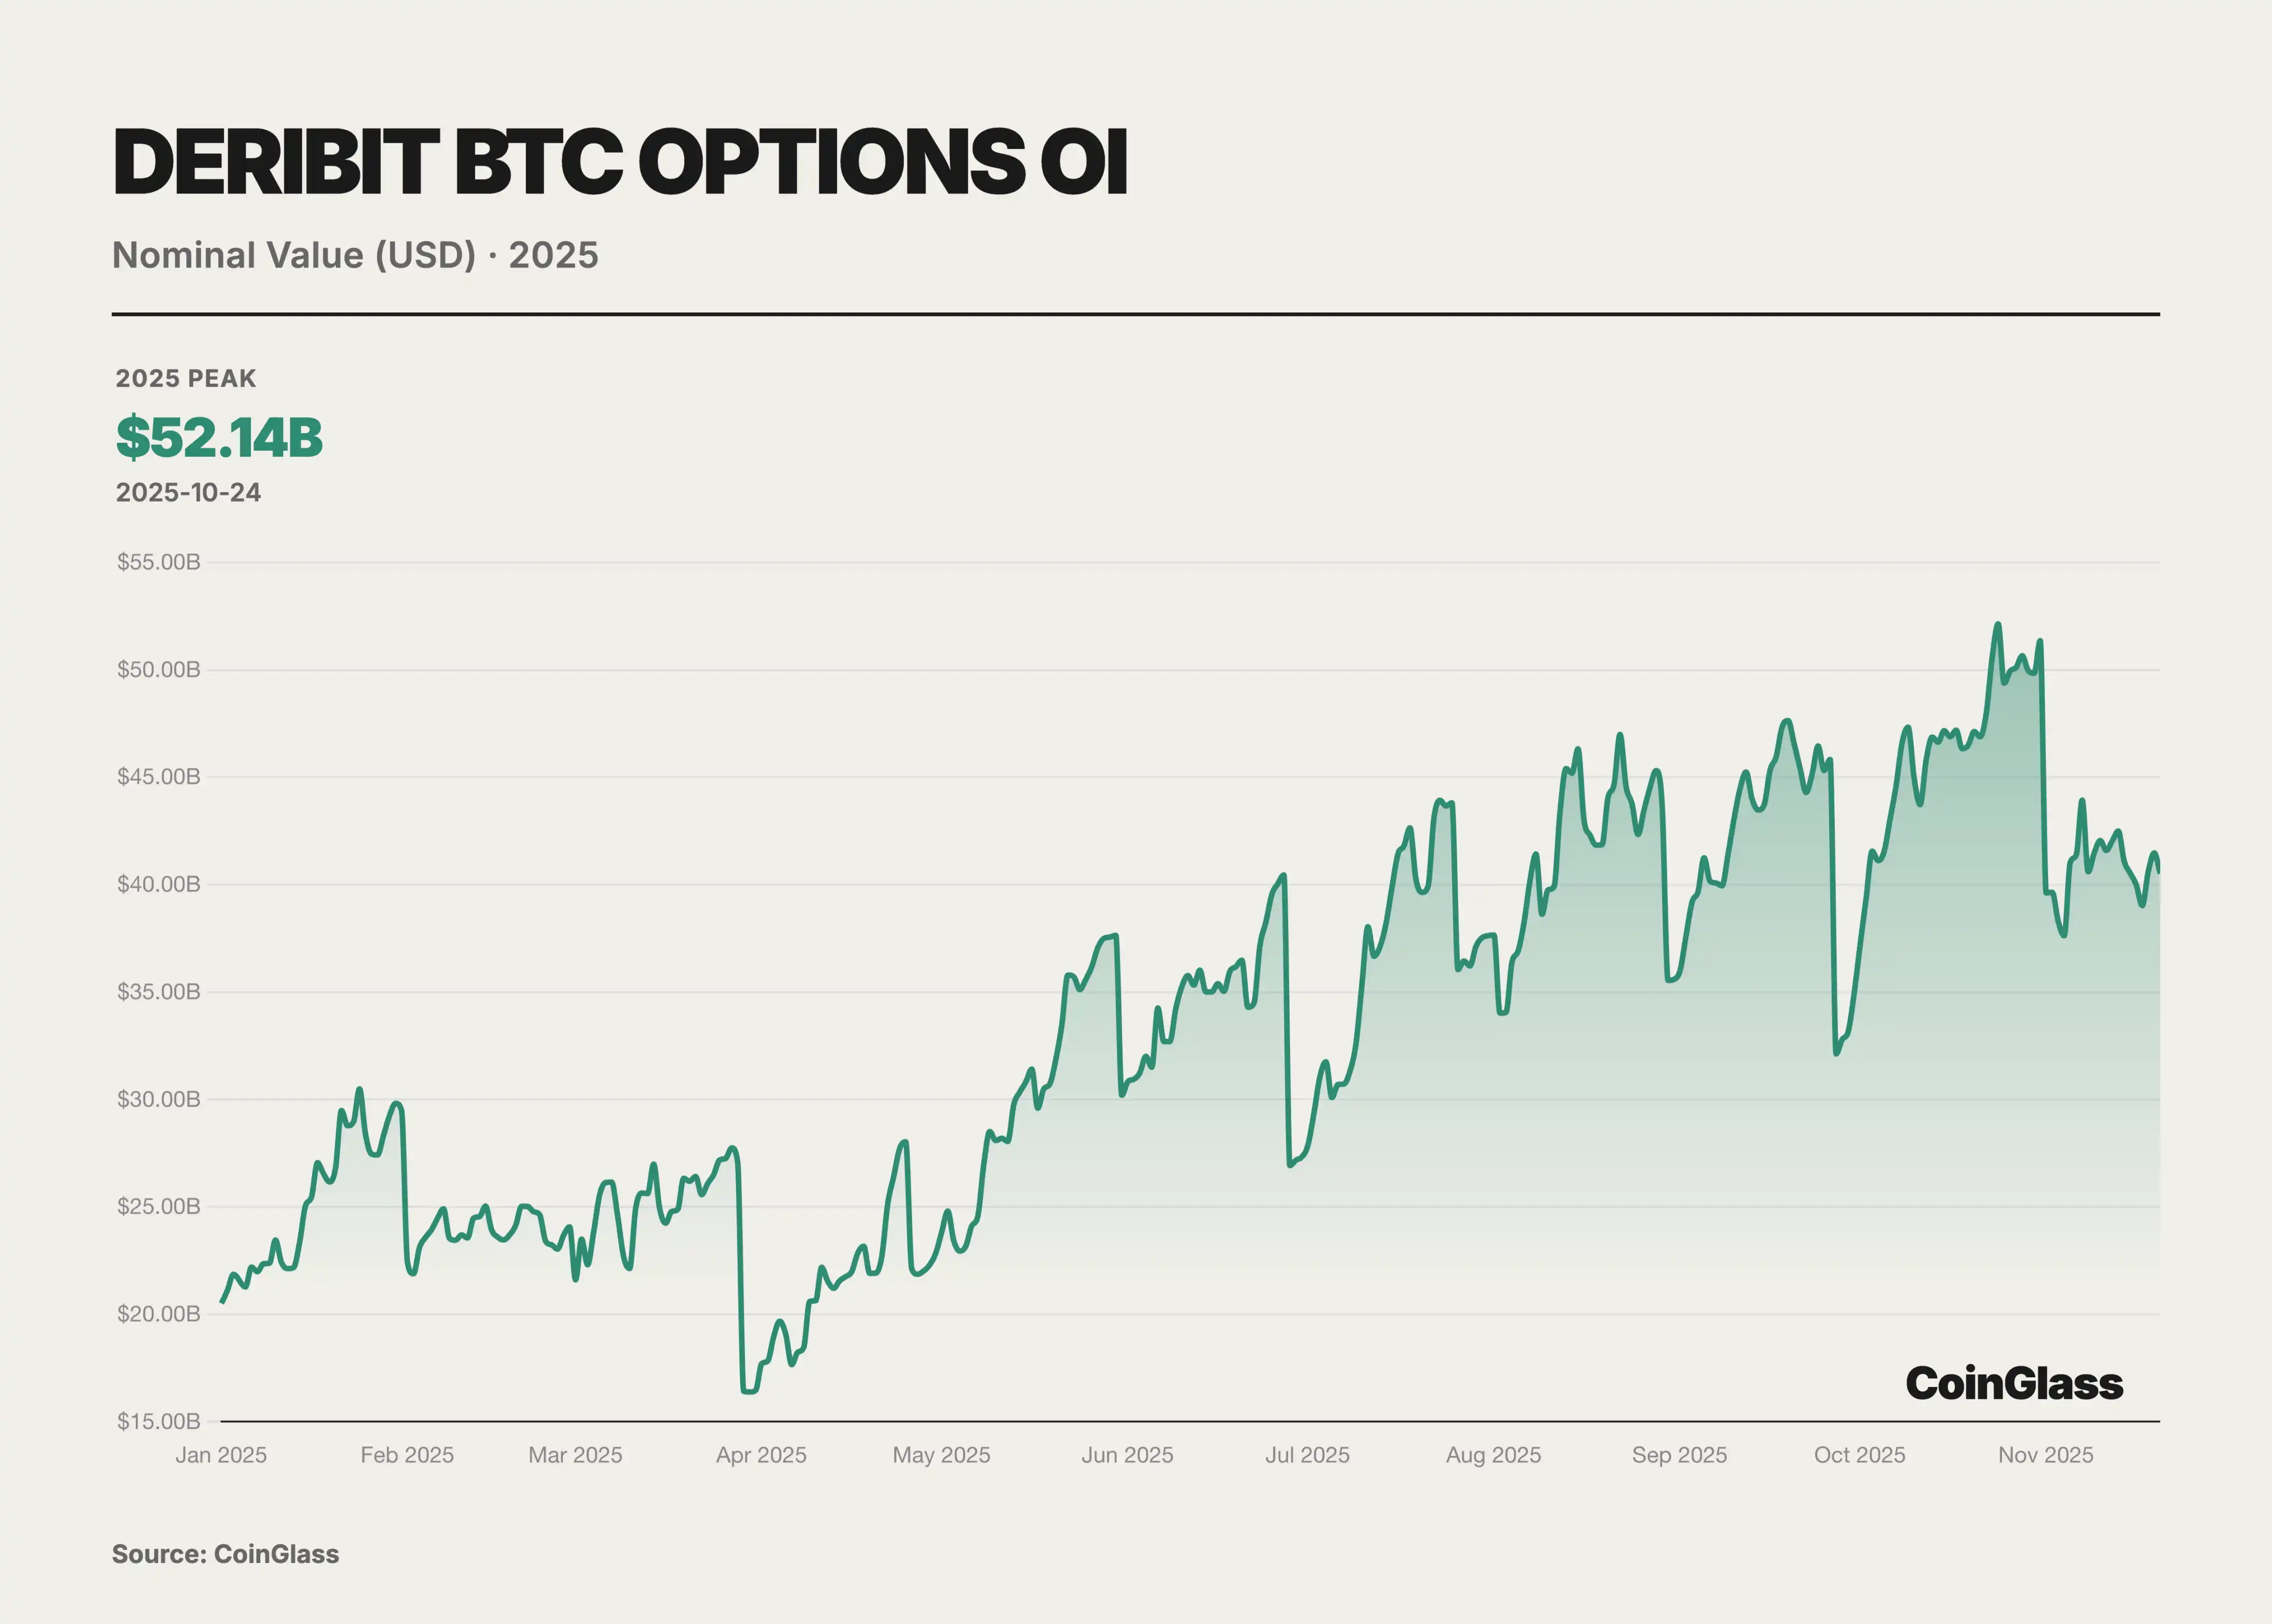
Throughout this year, the involvement of traditional financial institutions became a watershed for changes in the options market. With the evolution of the U.S. regulatory environment, several Wall Street institutions launched BTC ETFs and their options products. Particularly noteworthy is the launch of IBIT by BlackRock, which began offering options trading in November 2024 and rapidly rose to become a new giant in the BTC options market in 2025. Overall, the market structure of 2025 presents a dual-track characteristic: on the one hand, there are crypto-native platforms represented by Deribit, and on the other hand, there are traditional financial channels represented by ETF options such as IBIT.
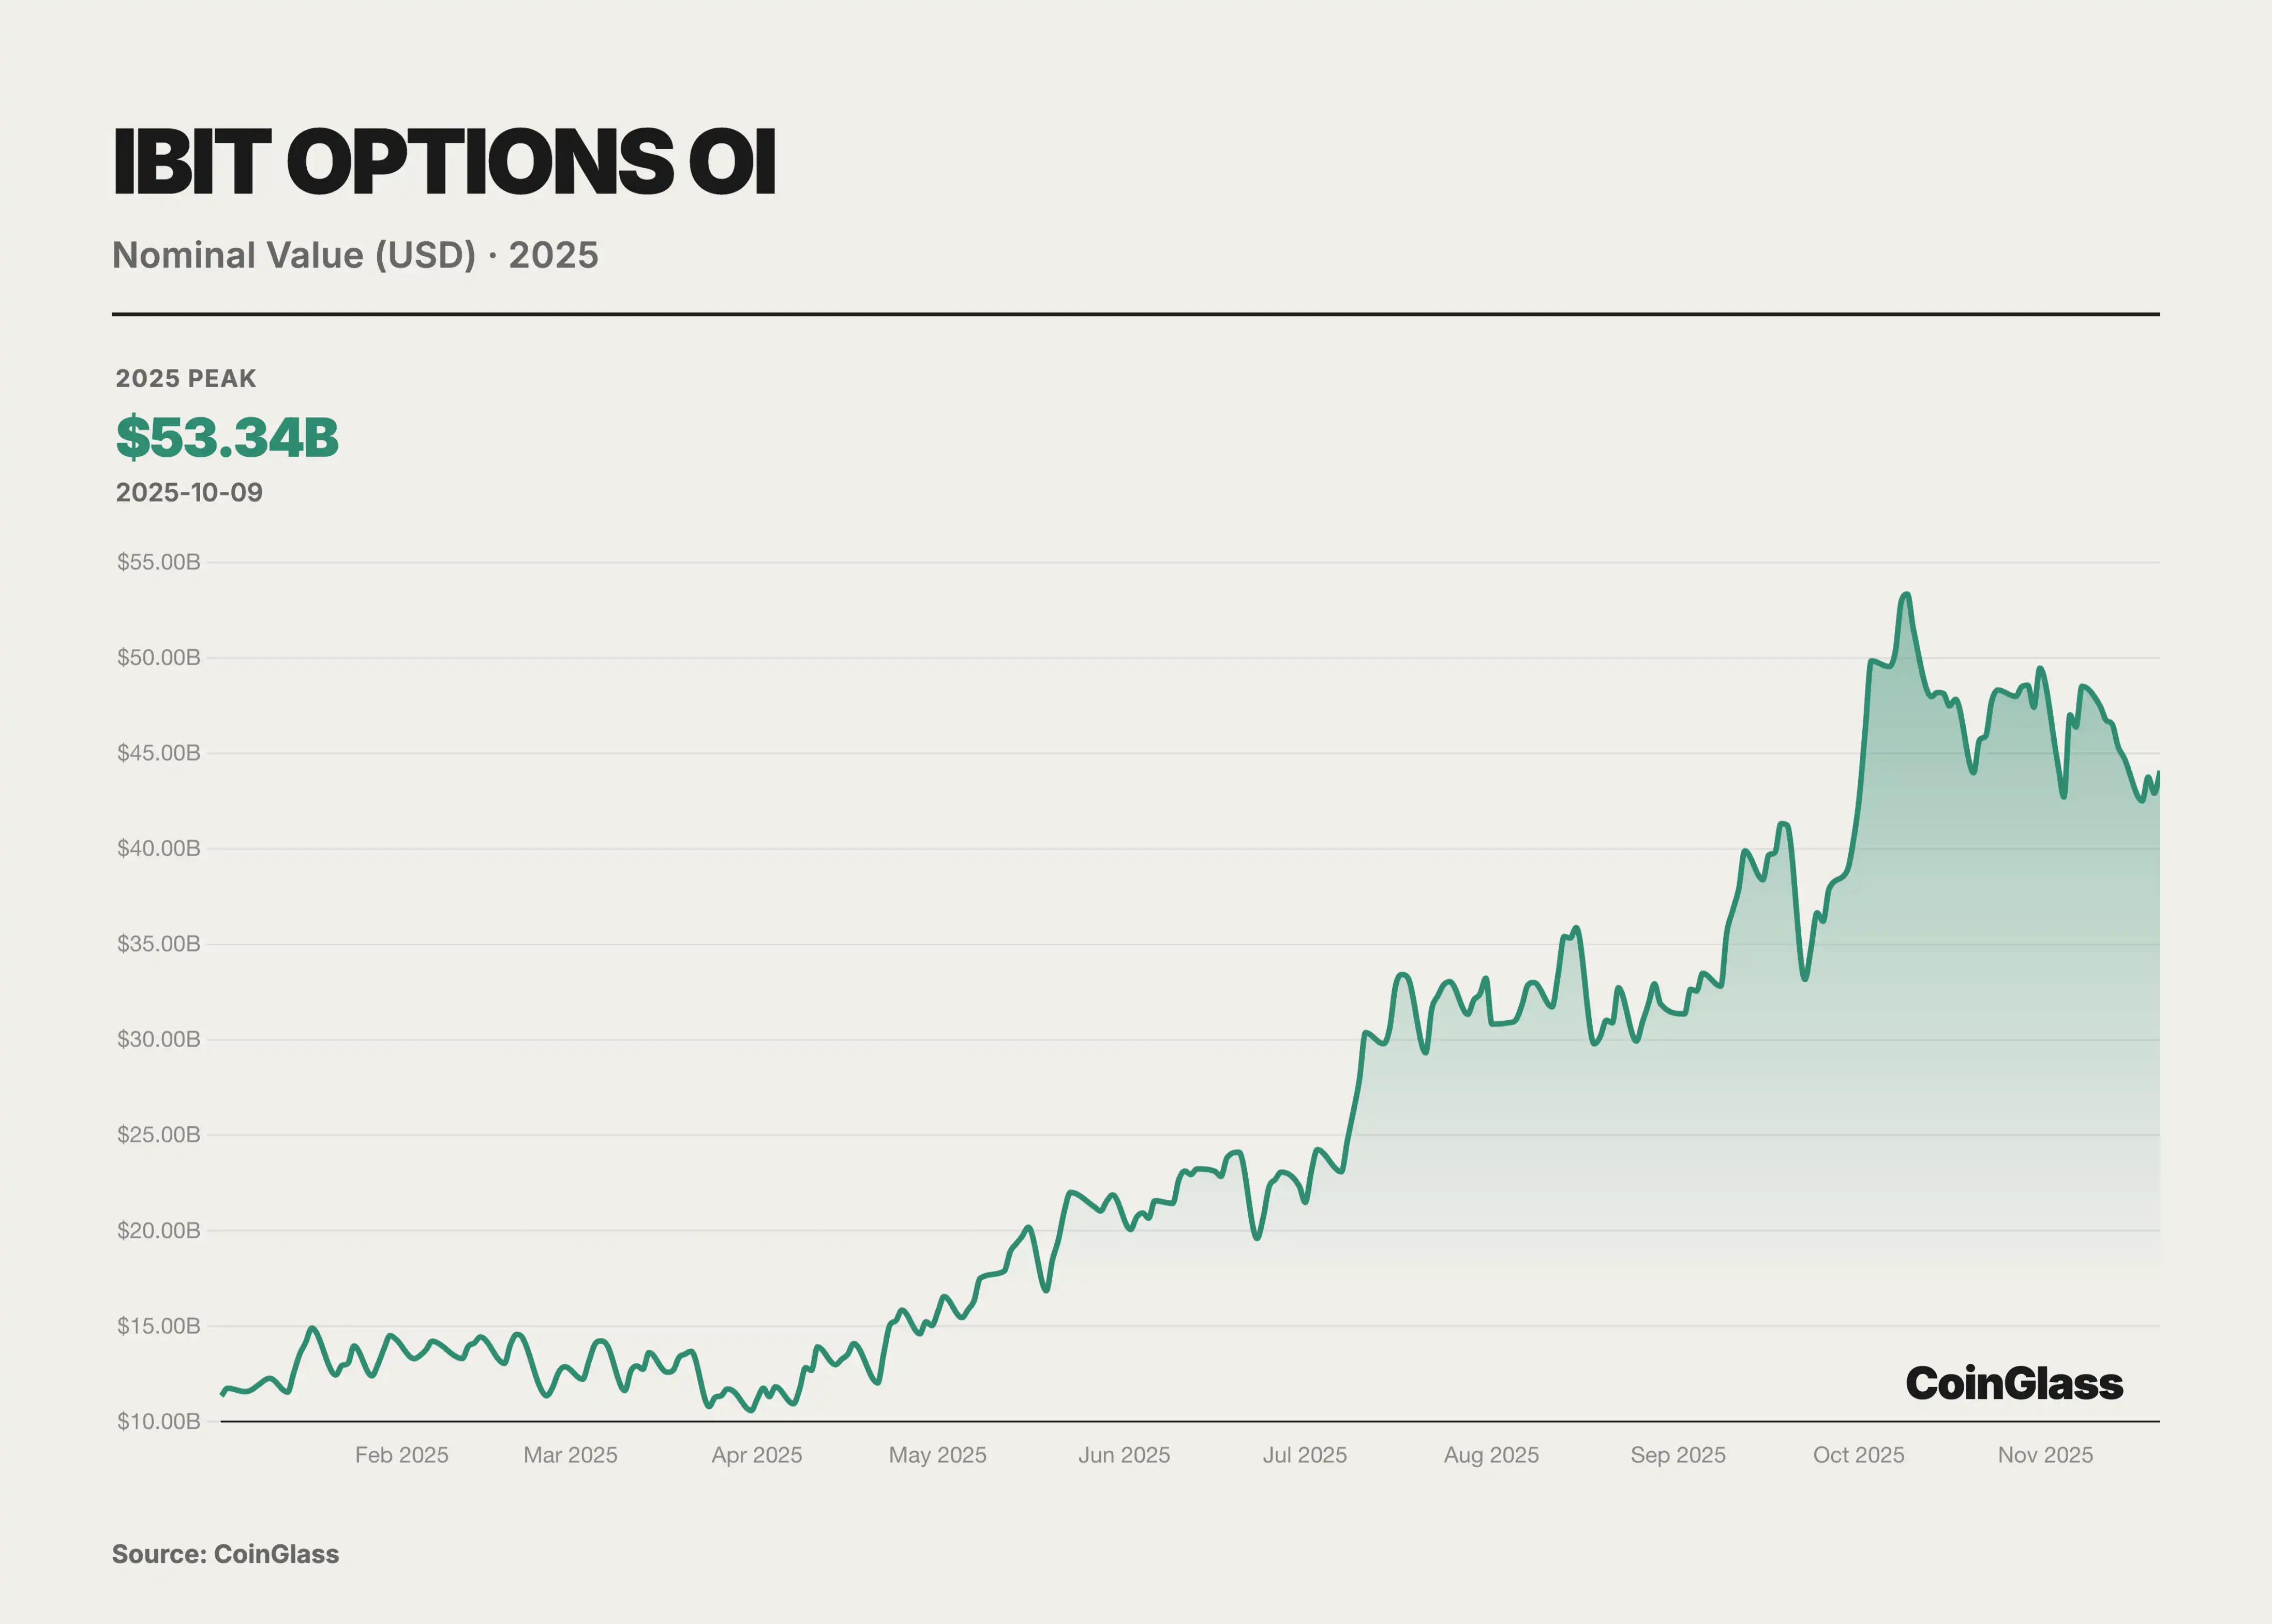
BlackRock's IBIT ETF Options Rise Strongly, Positively Challenging Deribit. IBIT, as a spot BTC ETF listed on the Nasdaq in the United States, saw a rapid increase in its open interest size less than a year after the launch of its options at the end of 2024. As of November 2025, IBIT became the world's largest BTC options trading venue, replacing Deribit's leading position held for many years. The success of IBIT options highlights the significant influence of traditional financial forces—large numbers of institutional investors previously restricted from participating in offshore platforms entered the BTC options market through IBIT, bringing massive funds and demand. The reputation and compliance framework of BlackRock and other large asset management companies behind IBIT also attracted more conservative institutions to use options for BTC risk management. By November 2025, IBIT, as the largest spot BTC ETF, had a management scale of up to $840 billion, providing ample spot support and liquidity foundation for the options market, clearly demonstrating the strong demand for spot ETF options in the market.
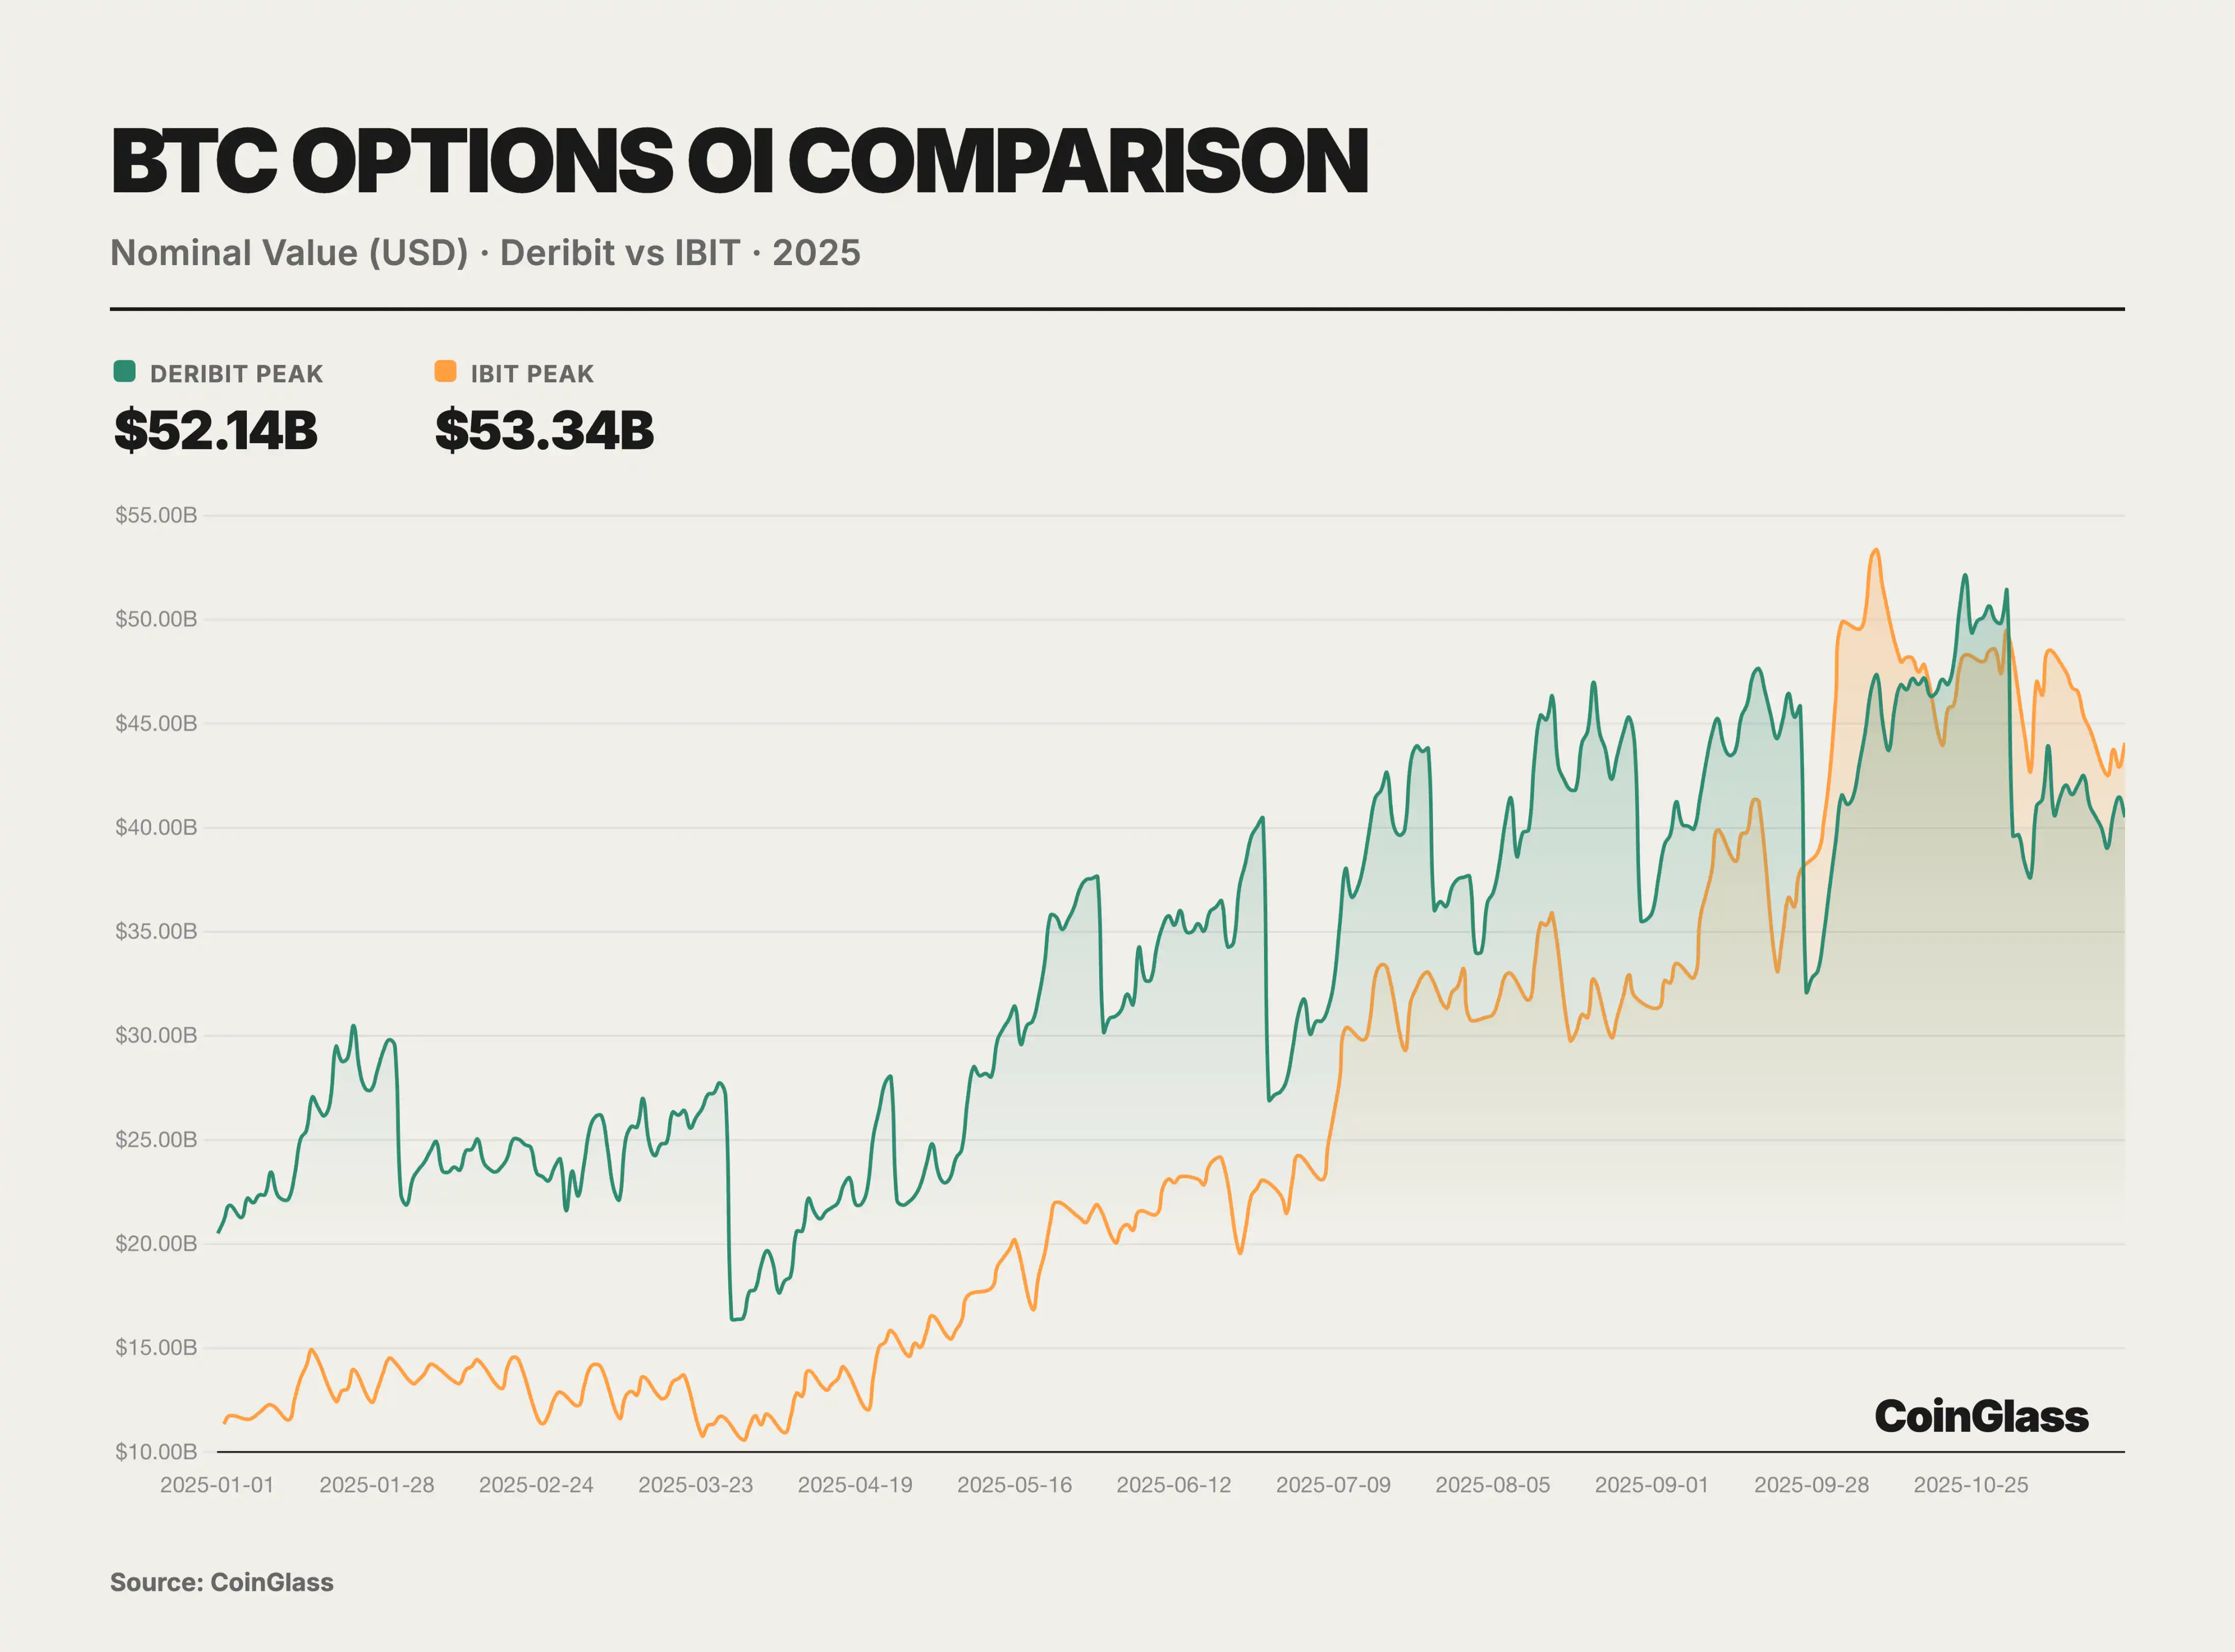
In addition to Deribit and IBIT, less than one-tenth of the BTC options market is divided among the CME exchange and a few other crypto trading platforms. The Chicago Mercantile Exchange (CME), as a traditional regulated venue, offers options trading based on BTC and ETH futures. After several years of development, although CME's market share has increased, as of the third quarter of 2025, its share in global BTC options open interest is only about 6%. This reflects that compared to more flexible native crypto platforms and ETF options, futures-based options have limited market appeal. Centralized exchanges like Binance and OKEx have also attempted to launch BTC and ETH options products in recent years, but user participation has been relatively low. The derivatives trading volume on these exchanges is mainly concentrated on perpetual contracts and futures, with the options business accounting for only a small part of their derivatives landscape. Platforms like Bybit also offer options trading settled in USDC, but their overall market share is similarly limited. Other exchanges represented by OKEx and Binance collectively contribute only about 7% of the BTC options open interest. Overall, the 2025 crypto options market shows a highly concentrated situation: native crypto platforms (led by Deribit) continue to dominate non-ETF varieties such as ETH, while traditional financial platforms (led by IBIT) have risen to the top in BTC options. In the duopoly established by both sides, the roles of other players are becoming increasingly marginalized. It is worth noting that in the ETH options market, due to the lack of a spot ETF options product similar to IBIT, Deribit remains almost the sole liquidity center for ETH options, with its ETH options market share exceeding ninety percent. This means that Deribit's dominant position in the ETH options market remained solid in 2025, while IBIT's impact was mainly seen in the BTC field. Looking ahead, with the approval of ETH spot ETF options in April 2025, it is not ruled out that ETH ETF options will also be launched subsequently and gradually participate in the competition. However, as of November 2025, the ETH options market is still dominated by native crypto exchanges, and there has been no traditional institutional-level competitor like IBIT emerging.
DeFi
PerpDEX
The year 2025 was a brilliant one for PerpDEX. The entire market saw explosive growth in trading activity, continuously breaking historical records. The monthly trading volume surpassed 12 trillion USD for the first time in October, with the total annual on-chain derivative trading volume reaching the tens of trillions of dollars. The sharp increase in trading volume and market share was the result of multiple factors such as performance breakthroughs, rising user demand, and changes in the regulatory environment. Whether retail investors, institutional trading desks, or venture capital funds, all set their sights on this thriving track in 2025.
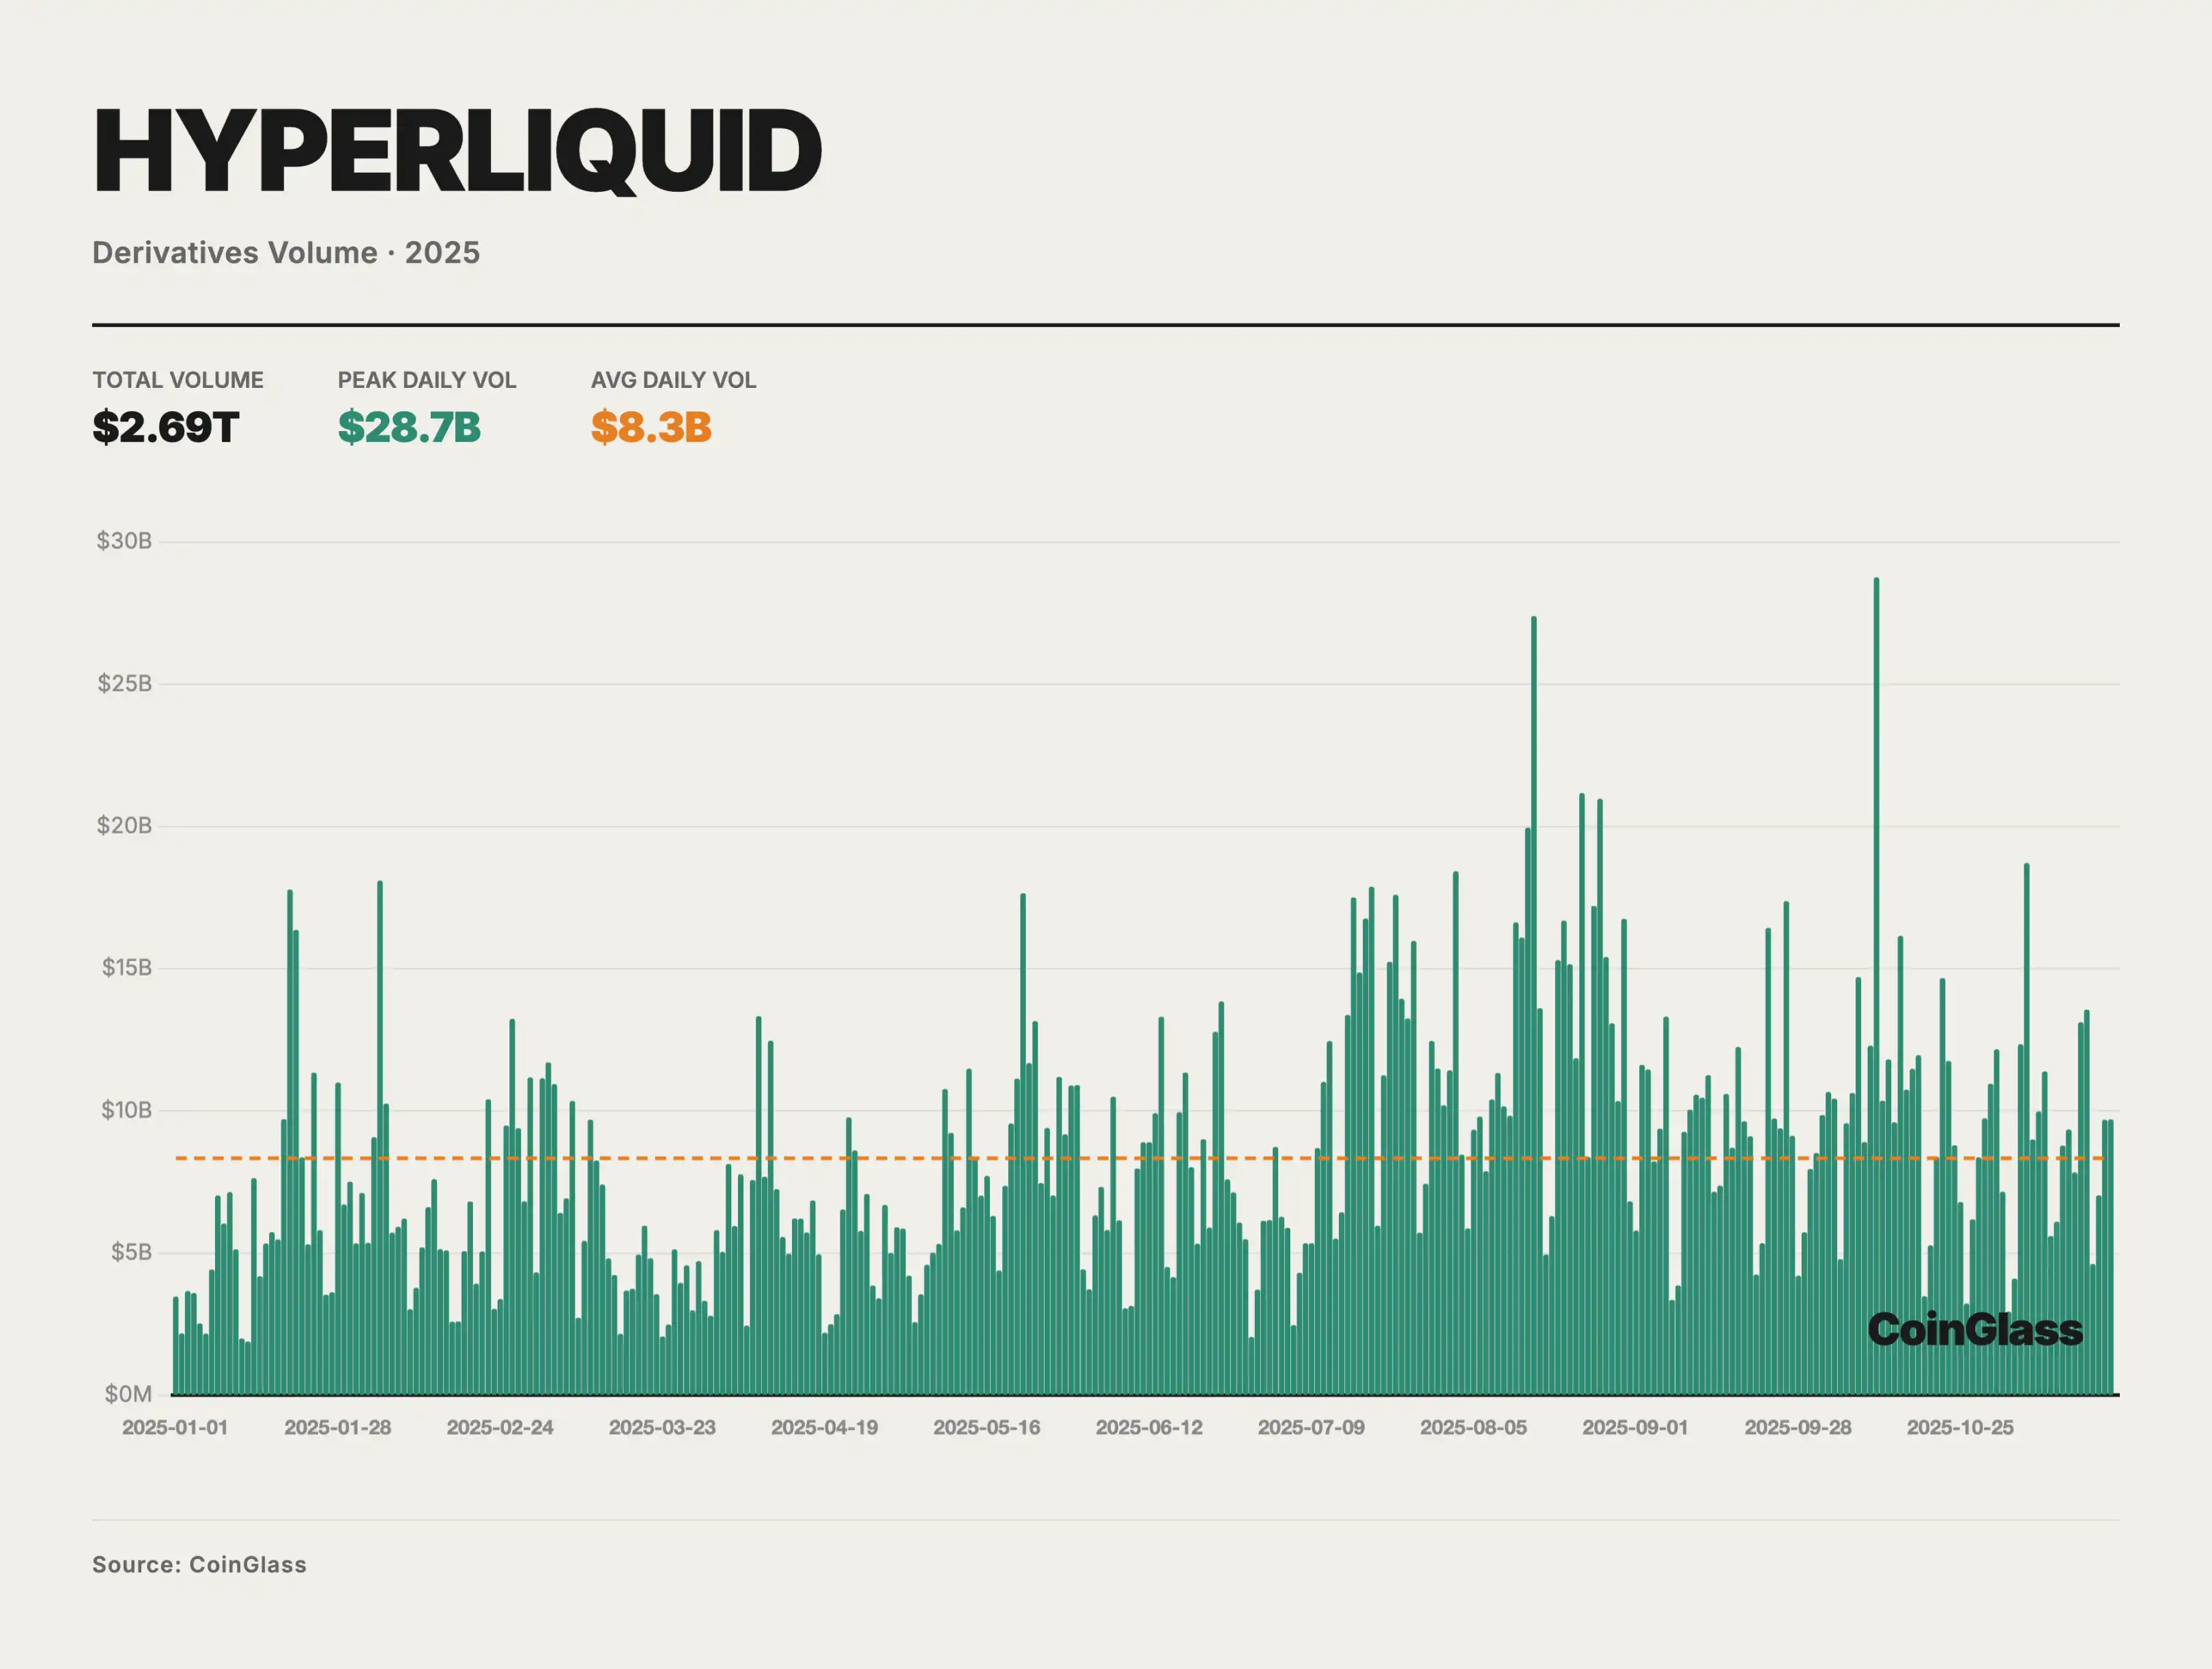
Hyperliquid emerged as the undisputed leader of the PerpDEX market in 2025. In the first half of the year, the platform nearly dominated the entire track, with a market share peaking at 70-80%. In May, Hyperliquid's on-chain perpetual contract trading volume accounted for approximately 71% of the total. This astonishing volume almost equated Hyperliquid with the PerpDEX market in the first half of 2025.
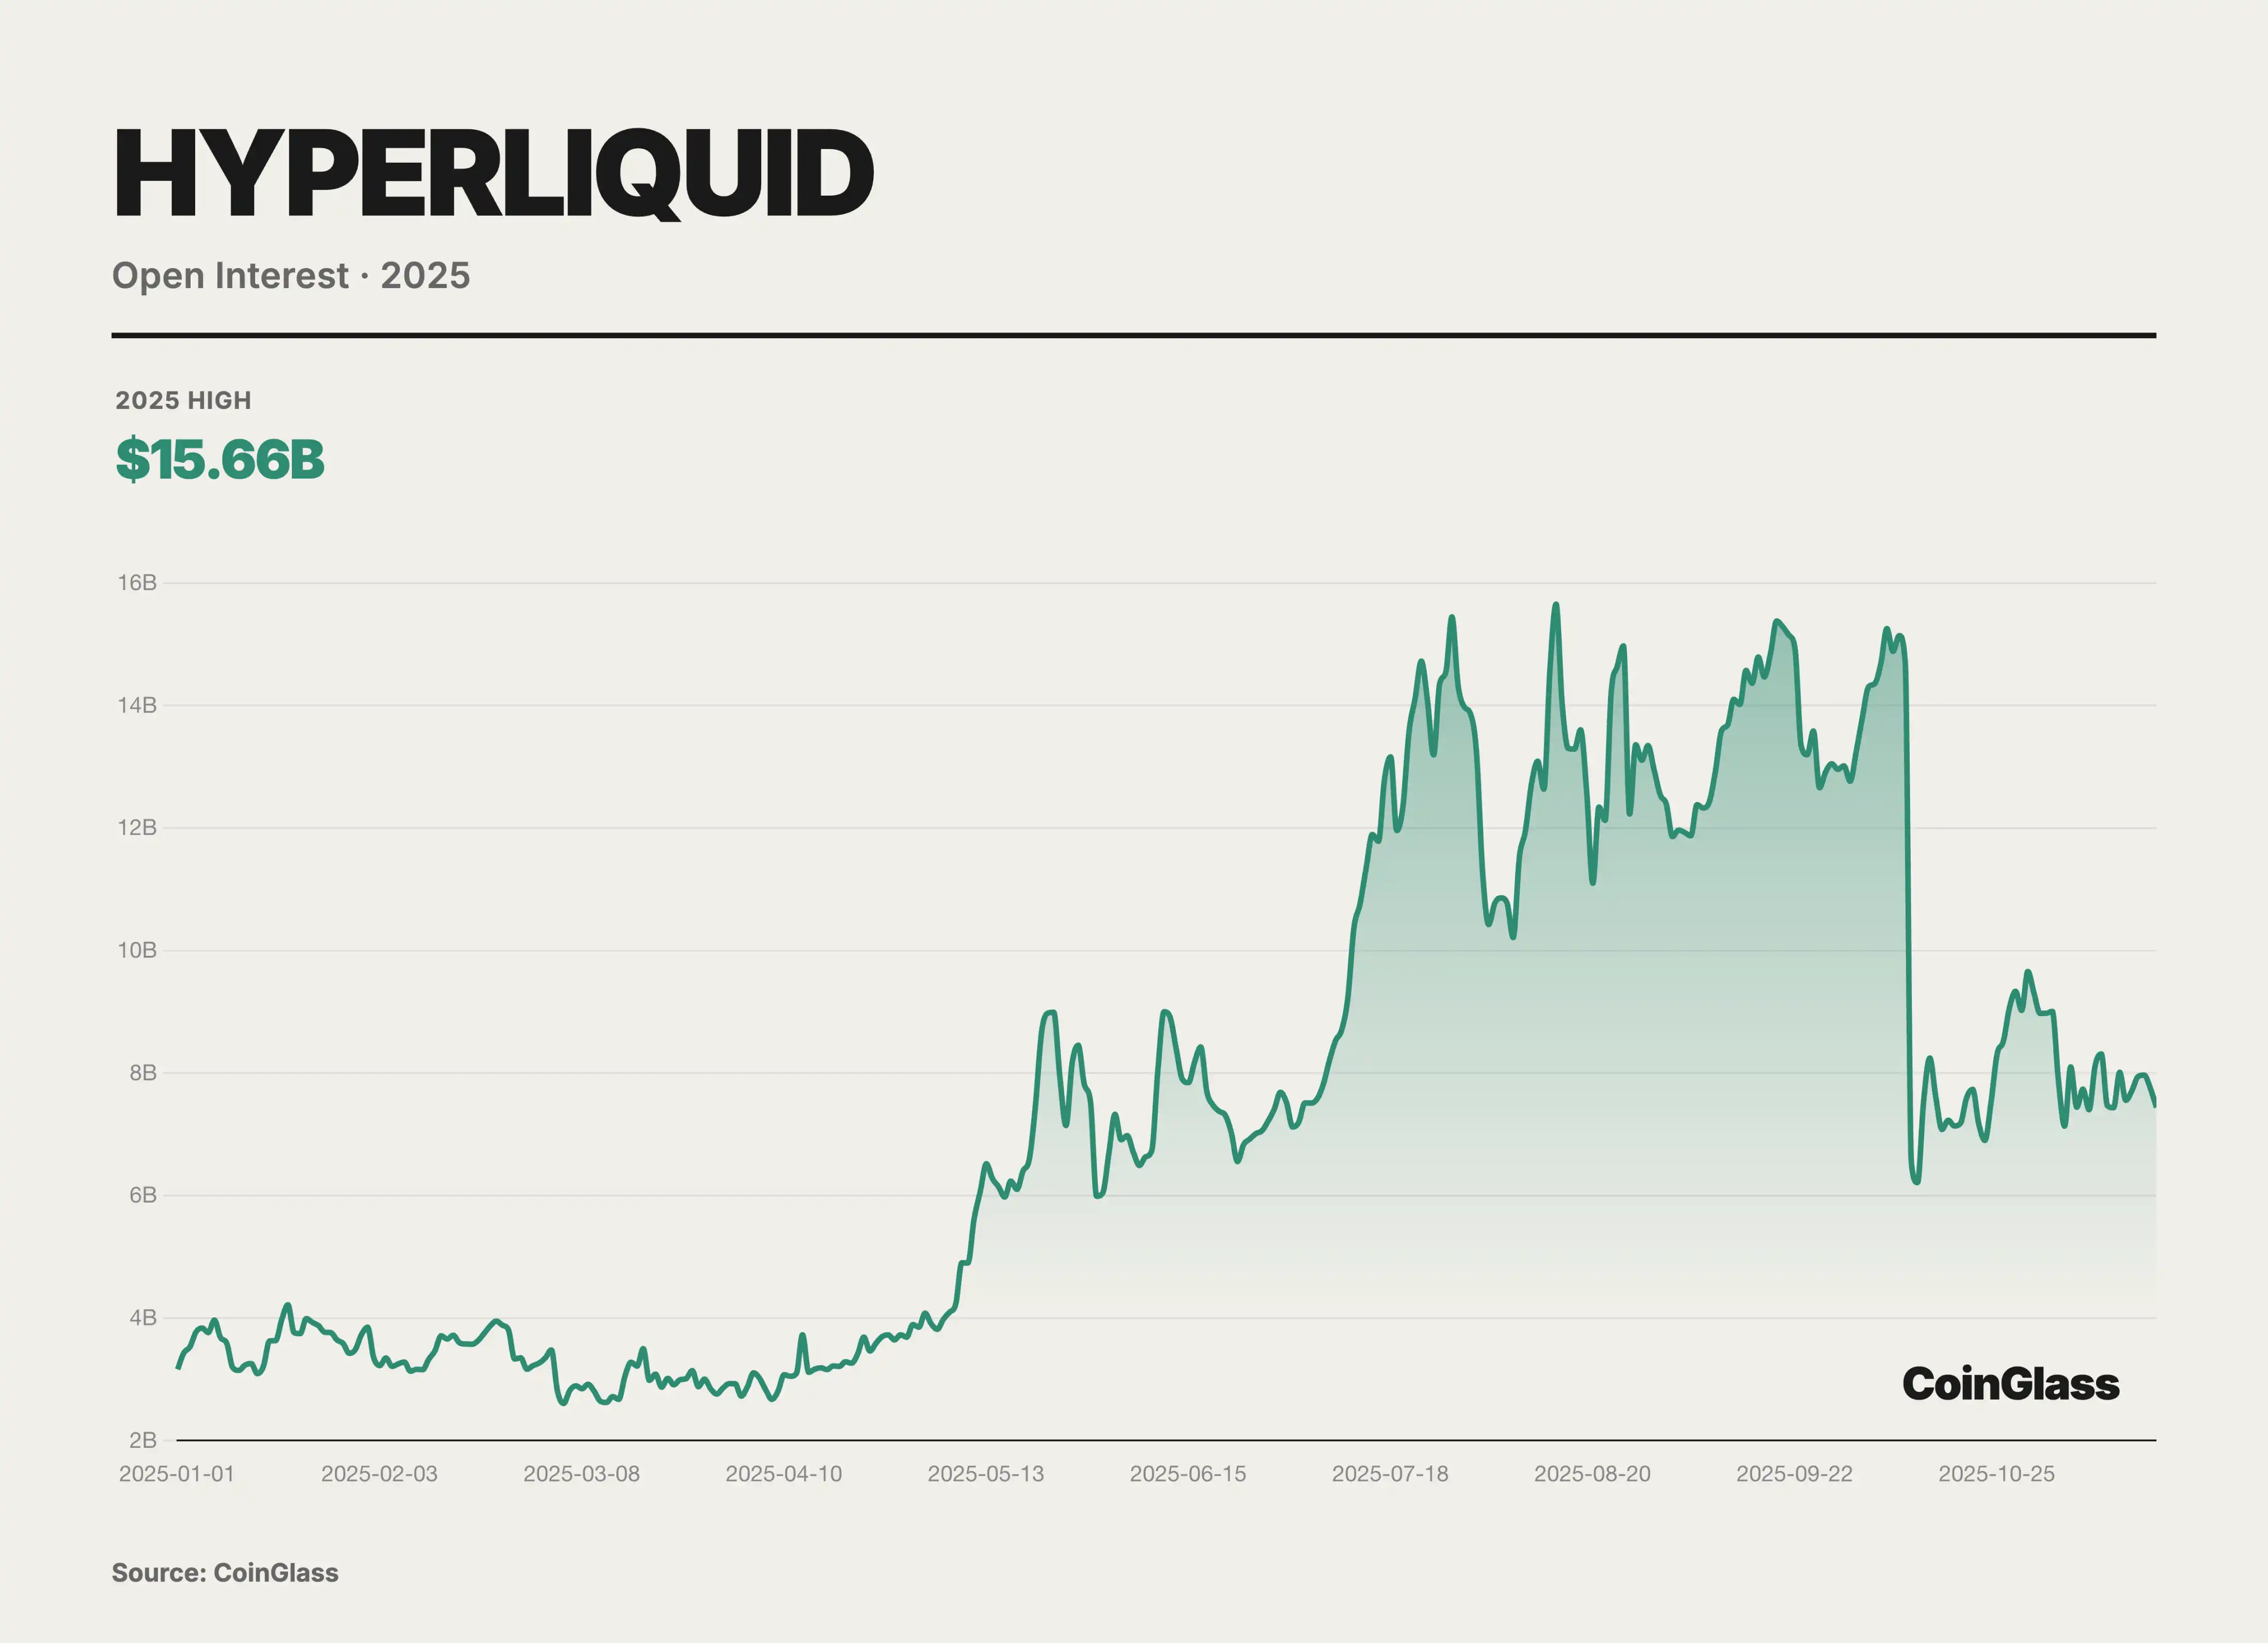
Hyperliquid not only attracted massive trading volume but also accumulated a substantial open interest size. Data from October 2025 showed that its perpetual contract open interest value reached 15 billion USD, accounting for around 63% of the total open interest of major decentralized perpetual platforms. This metric indicates that a significant amount of funds chose to stay long-term on Hyperliquid, reflecting traders' high trust in the platform's liquidity and stability.
Unlike traditional ETH L1 or general-purpose blockchains, Hyperliquid has built a custom Layer1 blockchain specifically designed for high-frequency derivative trading. The chain employs its proprietary HyperBFT consensus mechanism, capable of supporting 200,000 transactions per second, with transaction confirmation latency as low as 0.2 seconds. This performance even surpasses many centralized exchanges, making Hyperliquid the first exchange to achieve near-CEX speed and liquidity on-chain. The platform adopts a full on-chain Central Limit Order Book model, ensuring depth and quality of quotes, allowing professional traders to experience matching comparable to traditional exchanges on-chain.
Although Hyperliquid dominated the first half of 2025, with the strong entry of new participants, the PerpDEX market structure shifted from a single dominant player to multiple strong competitors in the second half of the year. As we entered the third and fourth quarters, Hyperliquid's market share saw a significant decline — dropping from around 70-80% mid-year to 30-40% by the end of the year. According to on-chain data, in November, Hyperliquid's trading volume share had dropped to approximately 20%, while newcomers like Lighter and Aster swiftly rose: Lighter captured about 27.7%, Aster 19.3%, and another dark horse, EdgeX, also reached 14.6%. This shift signifies a market once dominated solely by Hyperliquid transformed into a competitive landscape with multiple key players in a matter of months. High trading incentives, differentiated product strategies, and capital support have driven the rise of these challengers, intensifying competition in the entire PerpDEX space in the second half of 2025.
Prediction Market
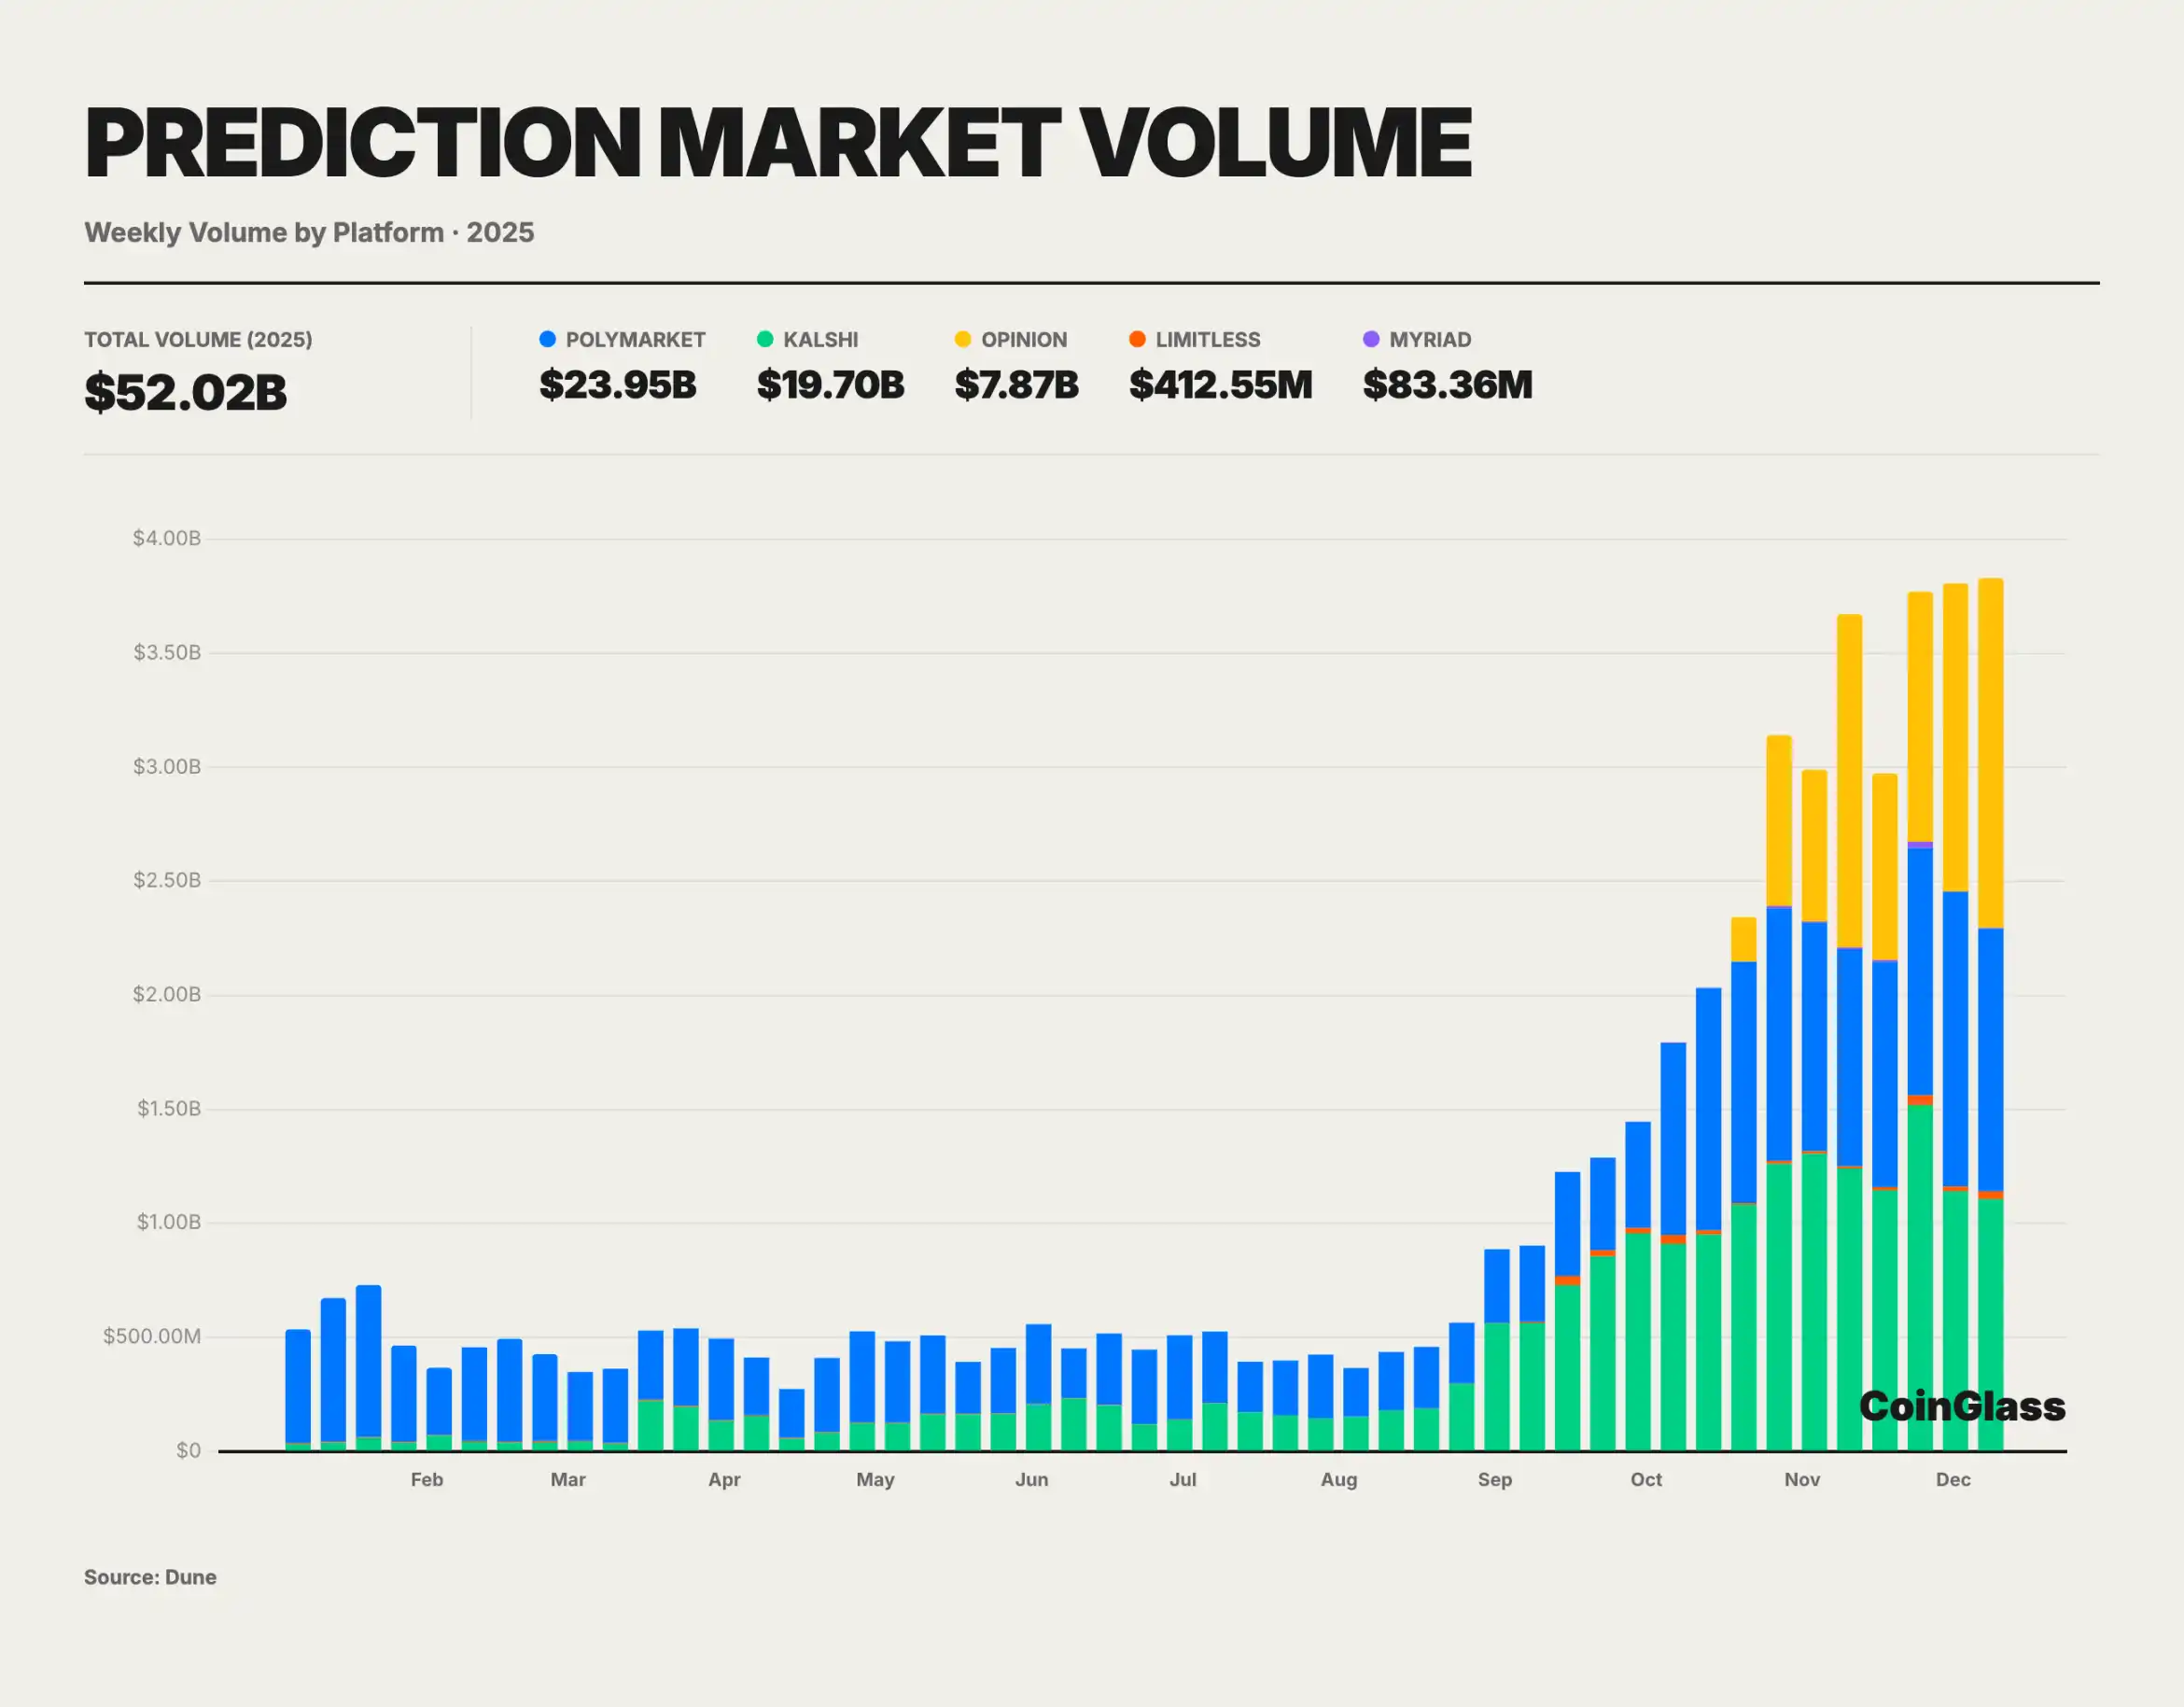
In 2025, the cryptocurrency prediction market saw explosive growth, with a total transaction volume reaching approximately $52 billion from January to November, far surpassing the peak level during the 2024 U.S. presidential election.
As the world's largest prediction market platform by trading volume, Polymarket has surpassed $23 billion in cumulative transaction volume in 2025. The platform has nearly 60,000 daily active users, almost three times more than at the beginning of the year; the estimated peak monthly active users have exceeded 450,000, demonstrating a significant increase in mainstream participation. The total number of registered trading users on the Polymarket platform is around 1.35 million, reflecting a rapid expansion of the user base over the past year. The large user base and ample liquidity have enabled the cumulative trading volume of individual contracts in multiple popular markets to reach the billion-dollar level. In highly liquid, settleable, and clearly defined event scenarios, prediction market prices are often used as a supplementary indicator. It was reported that during the November 2024 U.S. presidential election, Polymarket's daily trading volume reached nearly $400 million, accurately predicting the election results, compared to the deviation in traditional polls. This example highlights the decentralized prediction market's information aggregation ability and pricing accuracy in significant events, laying the foundation for further mainstream adoption in 2025.
Web3 Wallet
Web3 wallets, as the first point of contact connecting users to the decentralized network, underwent a fundamental rise in its strategic position in 2025. Wallets are no longer just secure containers for private keys or simple transfer tools but have evolved into on-chain traffic gateways integrating digital identity (DID), asset management, decentralized application (DApp) operating systems, and social graphs.
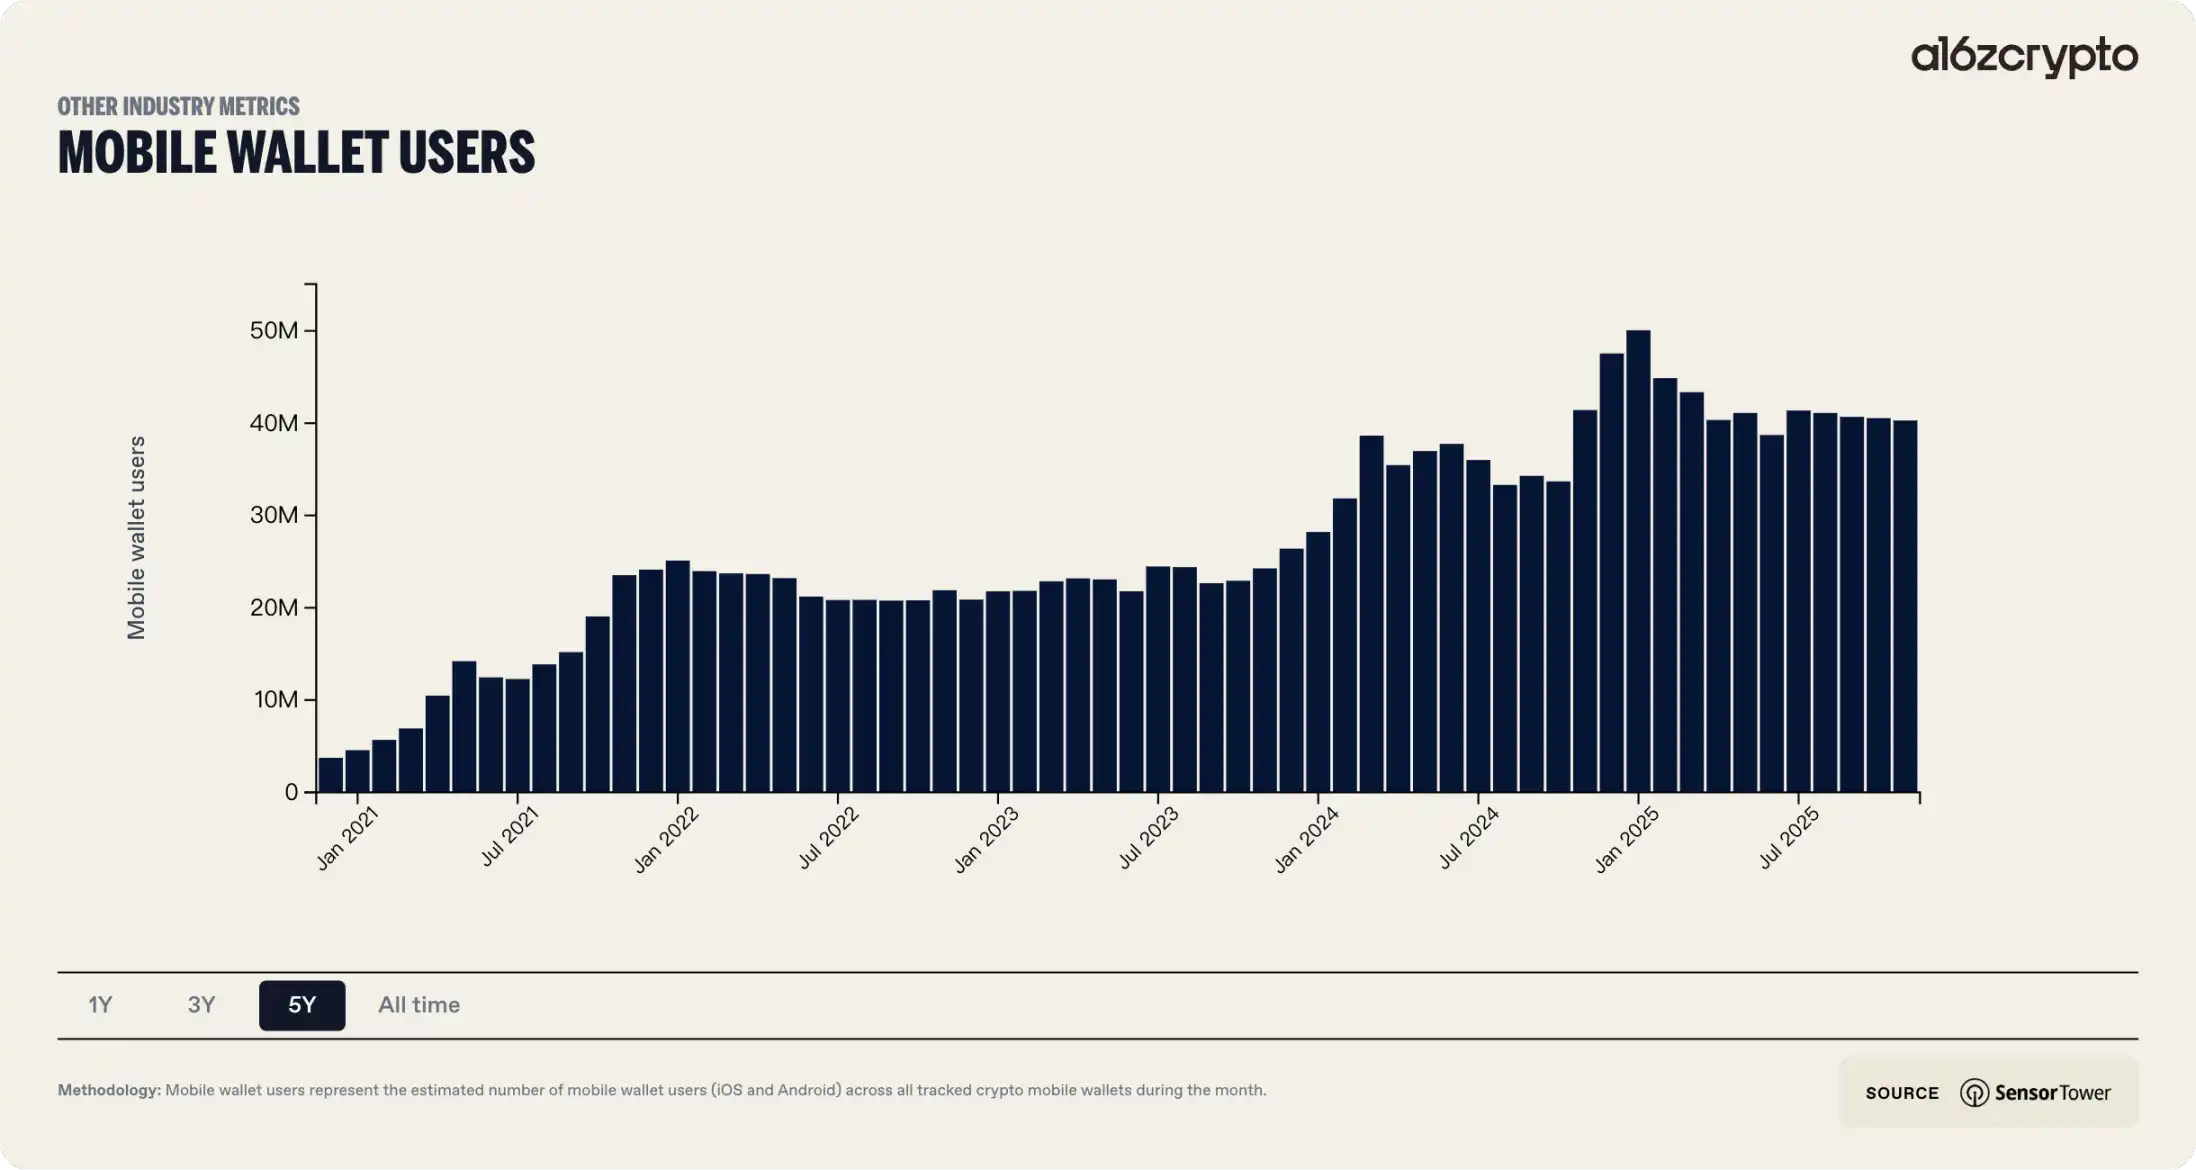
Looking back over the past five years, the form of Web3 wallets has undergone a dramatic transformation. Early wallets required users to have a high level of technical understanding, needing to manage mnemonic phrases, understand the gas fee mechanism, and manually configure the network. This high barrier to entry led to significant user churn, with data showing that over 50% of users abandoned the wallet setup process due to its complexity. The most significant industry feature this year is the widespread implementation of Account Abstraction and the standardization of Chain Abstraction technology. The integration of these two major technologies has enabled Web3 wallets to, for the first time, possess the capability to rival Web2 financial applications in user experience. The complexities of private key management, obscure gas fee mechanisms, and fragmented cross-chain liquidity are being encapsulated by intelligent backend protocols, reducing user-perceived friction to historically low levels.
Meanwhile, the entry of institutional funds has driven the upgrade of wallet security architecture. The combination of Multi-Party Computation (MPC) technology and Trusted Execution Environment (TEE) has become a standard feature of top wallets, completely transforming the fragile security model where the private key is everything.
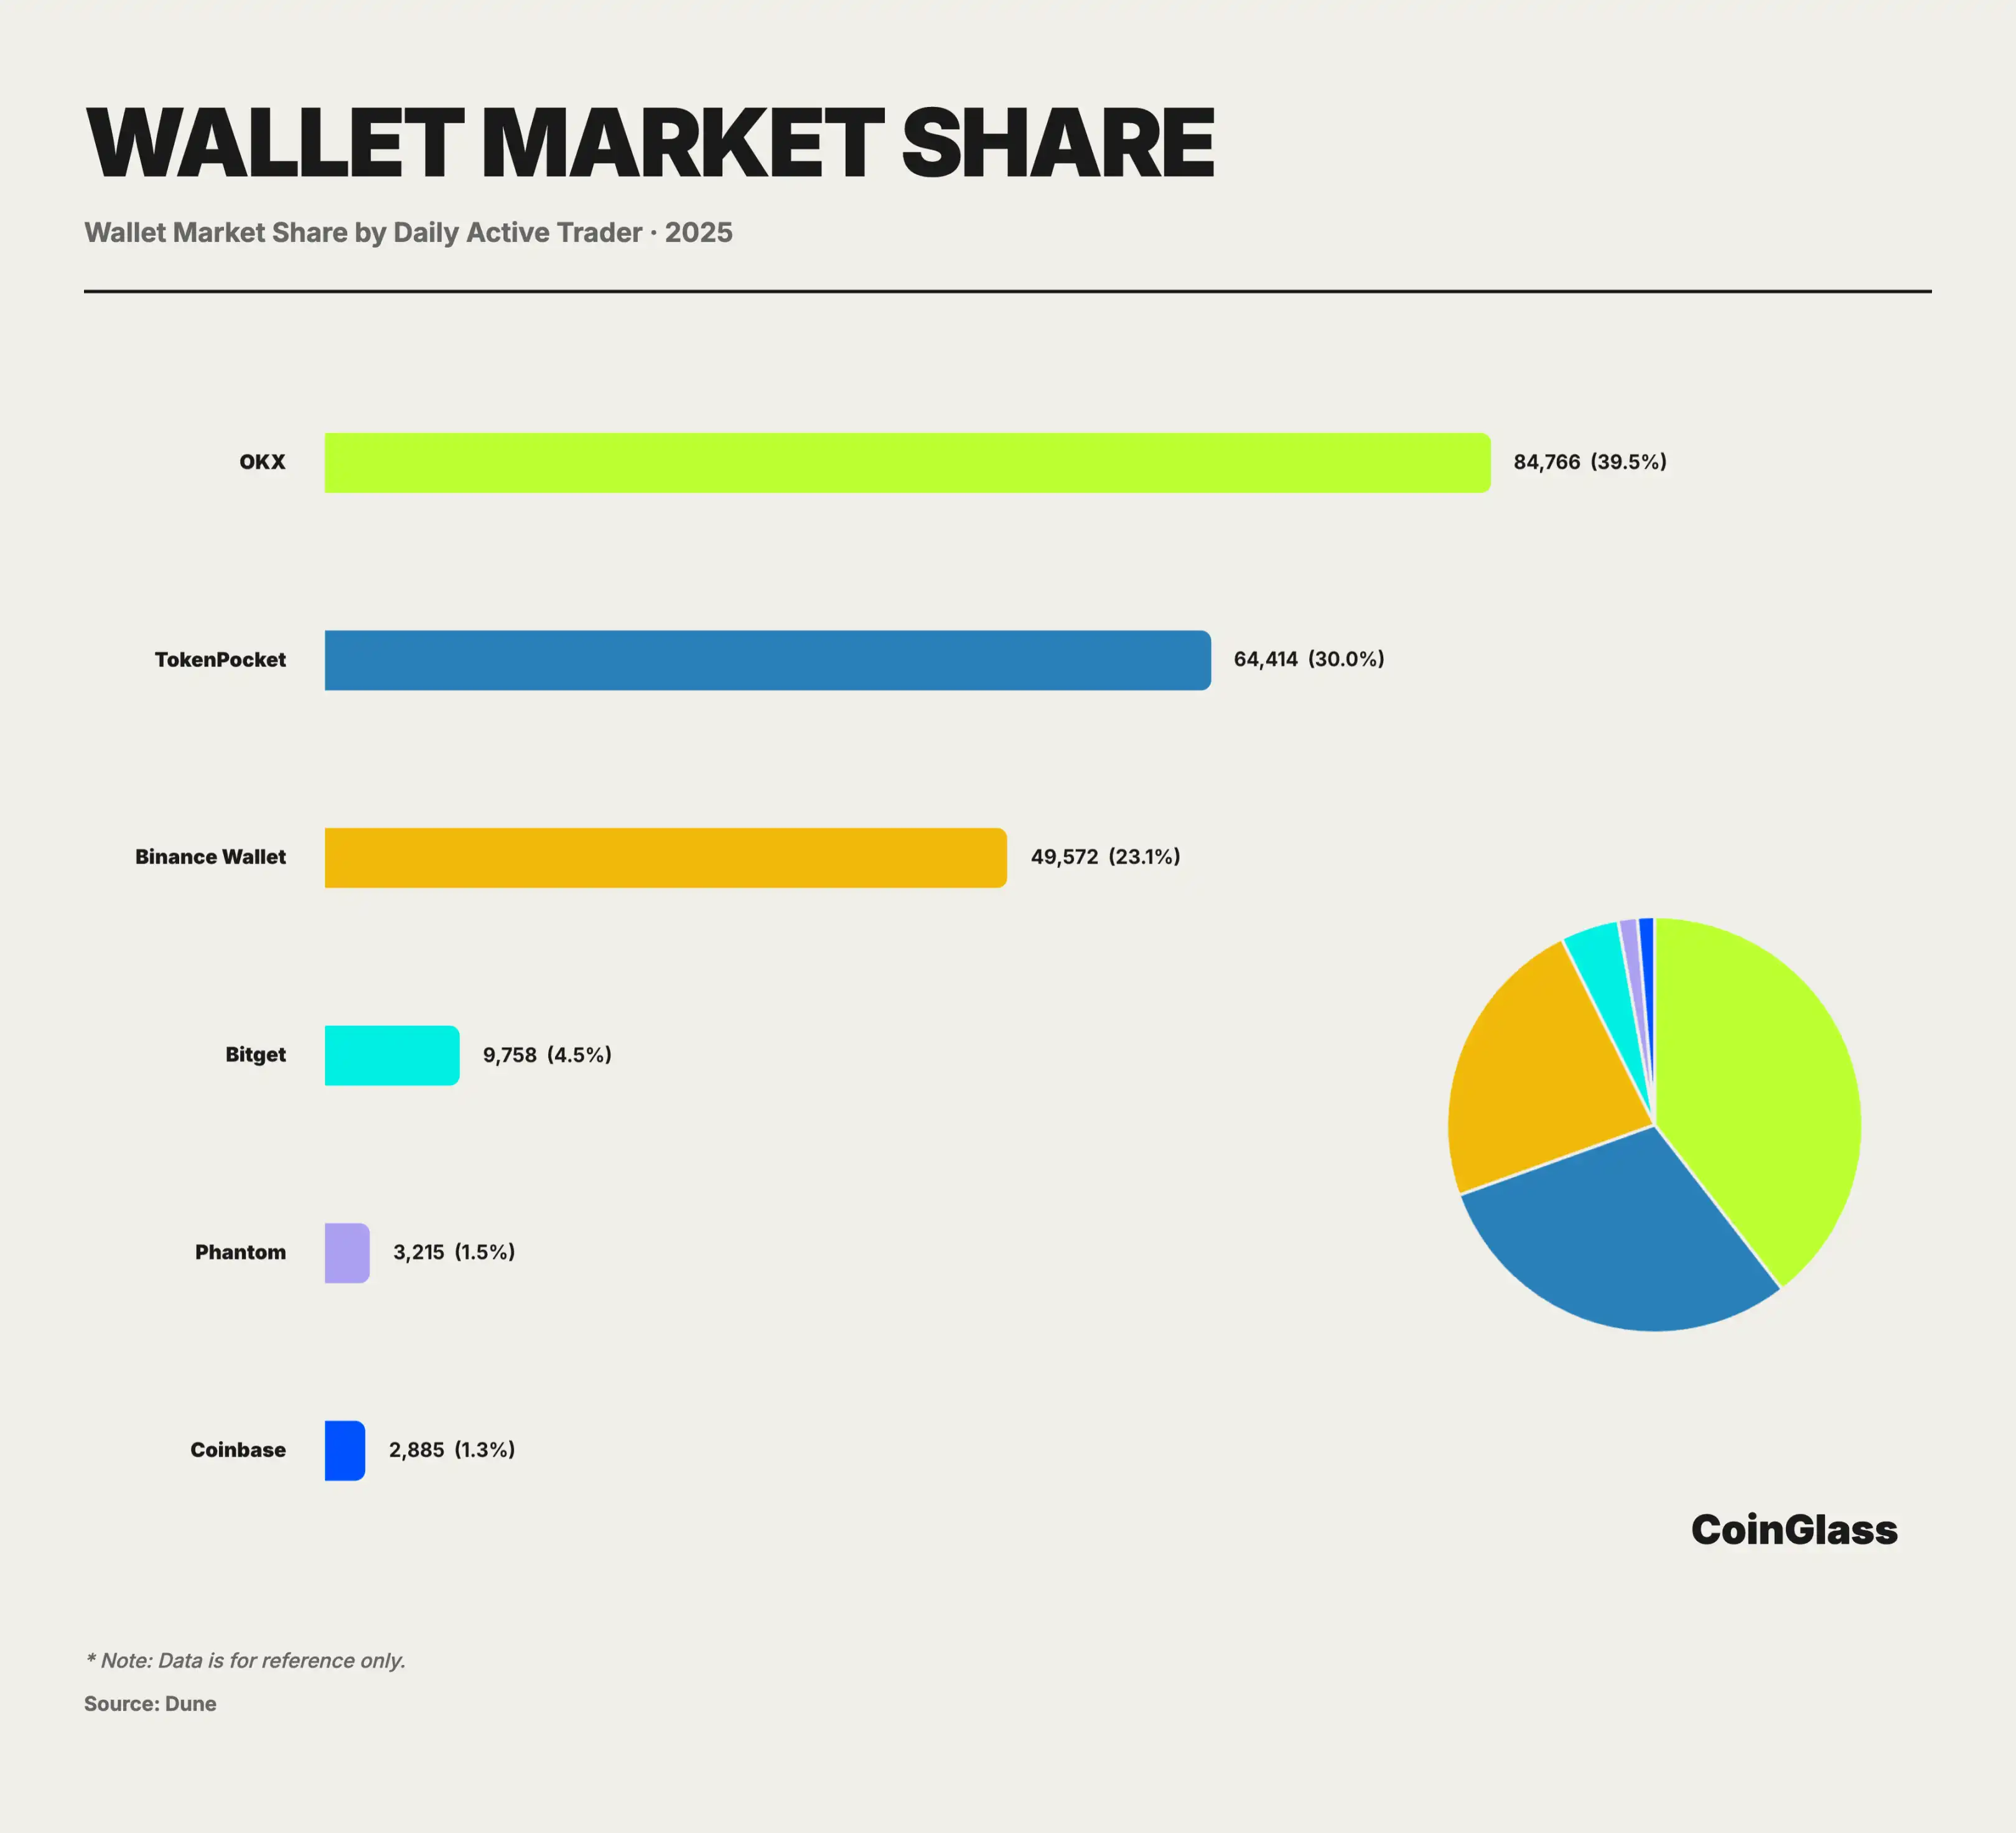
In a market landscape dominated by one superpower and multiple strong players in 2025, the OKX Web3 Wallet, with its combination of technological innovation and comprehensive ecosystem, leads the industry in both user-friendliness and functional integration. Recognized as the comprehensive frontrunner in the race, the OKX Wallet, as a super aggregator serving as a Web3 gateway, boasts over 5 million monthly active users. Its core design philosophy revolves around encapsulating complex on-chain logic behind an intuitive interface. Through a unified dashboard, users can easily manage assets distributed across 100+ blockchains without the need for manual contract additions.
Simultaneously, the OKX Web3 Wallet was one of the earliest in the industry to deeply integrate a DEX aggregator. While many other wallets were still limited to supporting swap functions on a single chain, the OKX Wallet had already achieved multi-chain transaction aggregation internally. Its built-in OKX DEX aggregator covers over 100 blockchains, automatically finding the best trading path for users through intelligent routing. Upon initiating an exchange request within the wallet, the aggregator simultaneously calls multiple DEX quotes and splits routes to ensure execution at the optimal price with the lowest slippage.
In addition to established wallets like the OKX Wallet that have long held a leading position in the industry, 2025 saw the emergence of many newcomers, such as the Binance Wallet. The rise of the Binance Wallet in 2025 was driven by Binance Alpha's growth strategy: integrating early project discovery and trading directly into the wallet, enabling users to participate in early-stage projects, airdrops, and TGE through a path similar to centralized products. The official positioning of Alpha is closer to a "pool for discovering and screening pre-listed projects," emphasizing transparency and user participation in the process. Through gamification and tokenization mechanisms, on-chain participation is transformed into more frequent trading behavior and retention. This Alpha-driven wallet growth is directly reflected in the data.
In 2025, Bitget Wallet is investing in PayFi to bridge on-chain finance with real-world consumption and advance the Wallet Card. The Gasfree GetGas covers multi-chain Gas payments and supports Google/Apple/Email social logins. It natively integrates with assets like Ondo RWA, enabling the trading of tokenized US stocks, while also offering QR code and card payments, stablecoin wealth management Plus, and focusing on the Everyday finance app.
Summary
The key theme of the 2025 crypto derivatives market is the repricing from high-leverage retail speculation to institutional capital, regulatory infrastructure, and concurrent evolution of on-chain technology. Macroeconomic liquidity determines trends, with crypto experiencing high-beta amplified volatility amid rate cut expectations and risk preference shifts, triggered by geopolitical and policy events. During the year-long deleveraging phase, an October external shock compounded with third-quarter crowded leverage led to a more than $70 billion two-day rollback of the total open interest (OI) across the network, accompanied by a peak liquidation of hundreds of billions of dollars.
Throughout the year, with a total volume of approximately $85.7 trillion on centralized exchanges (CEX), OI, depth, and custody gravitated towards the top players. Top platforms improved price discovery and execution efficiency, magnifying compliance, operational, and technical events into systemic risks. As inventory decreased and order books thinned, this centralization simultaneously amplified the upward marginal buying pressure and liquidity void during downturns. Extreme liquidations exposed the fragility of the margin-call-liquidation-insurance fund-auto-deleveraging (ADL) chain: under pressure on insurance funds and cross-platform transfers, non-transparent ADL executions and off-market price liquidations dismantled hedge legs, shifting neutral portfolios into directional risks. Risk management needs to focus on redoing stress tests around the liquidation mechanism and fund accessibility. Institutionalization became more concentrated in on-exchange derivatives and decentralized autonomous treasury (DAT): CME introduced physically settled futures to drive regulatory innovation, promoting the normalization of the basis trading, connecting ETF spot demand with futures hedging into a replicable arbitrage chain; DAT, driven by accounting and financing tools, formed an asset-liability-equilibrium-type configuration/financing loop, with buyers more "locked in," shifting the risk focus from coin price to funding structure, corporate governance, and regulatory shocks. Option market pricing power also shifted, as regulatory exchanges merged and ETF options rose, concentrating BTC volatility flow through traditional financial channels. PerpDEX on the DeFi side approached the CEX experience with a high-performance application chain and intent-centric architecture, moving towards multi-chain competition, while the prediction market and wallet's account/chain abstractions moved discovery, trading, and pre-distribution to the application layer.
In conclusion, the current derivatives market presents distinct structural opportunities and asymmetric risks: opportunities primarily lie in the low-risk basis arbitrage space that emerges after the integration of compliant spot and derivative tools (such as ETF options), and the functional replacement of traditional centralized liquidity by high-performance on-chain infrastructure (PerpDEX); meanwhile, risks are highly concentrated in the potential equity and coin price devastations that could occur due to the reversal of the financing logic in the DAT sector, as well as in the systemic liquidation risks arising from the misalignment of tail-end asset liquidity in the highly concentrated CEX clearing system. Looking ahead to 2026, as global regulatory frameworks converge rapidly and with the potential turnaround in liquidity conditions, the market's core competitiveness will focus on whether the trading infrastructure can maintain clearing resilience in an extremely congested leverage chain and whether capital can find the most efficient circulation path between compliance and decentralization.
This article is contributed and does not represent the views of BlockBeats.
Welcome to join the official BlockBeats community:
Telegram Subscription Group: https://t.me/theblockbeats
Telegram Discussion Group: https://t.me/BlockBeats_App
Official Twitter Account: https://twitter.com/BlockBeatsAsia