Week 11 On-chain data analysis: Trading volume has fallen and the derivatives model is in the extreme value area

The original title: "float the sea, immediately the kunlun | WTR 3.6"
原文作者:WatchToweR Crypto
Review of the week
This week, from February 28 to March 6, the highest was near $24,023 and the lowest was near $21,883, with a swing of about 9.8%.
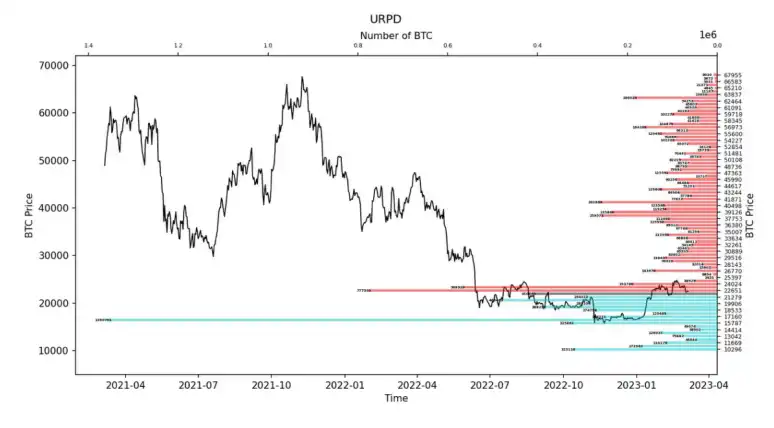
Observe the chip distribution diagram, there are a large number of chips in the vicinity of $21965, there will be some support or pressure.
• Analysis:
1. $22,500 ~ $28,000 approximately 1.79 million pieces;
2. $18,500 ~ $22,000 about 2.14 million;
• The probability of not falling below $16,500 ~ $20,500 in the short term is 70%.
The probability that the price will not exceed $24,000 ~ $26,000 in the short term is 73%.
Important information
Economic news
1. Us February ISM manufacturing PMI 47.7 vs. 48 exp. 47.4 exp.
a. The final service PMI came in at 55.1, higher than market expectations of 54.5;
b. Manufacturing price payments index 51.3 vs. 45.1 vs. 44.5;
c. The ISM index cooled again, while the price payment index remained higher than expected.
Us December S& 2. P/CS20 metropolitan home price index annualized at 4.65%, below expectations of 5.8% and below the previous reading of 6.77%.
3. Dallas Fed business activity Index for February -13.5, below expectations -9.3 and below the previous reading -8.4.
4. U.S. durable goods orders fell 4.5% in January versus 4% expected versus 5.6% last month, the biggest drop since April 2020.
5. Us consumer confidence index 102.9, 108.5 expected, 107.1 last.
6. Oil and cloth have risen this week; U.S. natural gas jumped 18% to a six-week high; European gas was down 11% for the week.
Encrypted ecomessaging
1. Cryptocurrency bank Silvergate has delayed the release of its 2022 annual report, saying it "may not be able to continue as a going concern due to significant asset sales, resulting in capital depletion and difficulties in repaying maturing loans."
a. Its parent company, SilverGate Capital Corp, announced the suspension of SEN payment network services.
2. Tether CTO: Tether has no contact with Silvergate.
3. The Federal Financial Court of Germany confirmed that the crystal orange can be tax-free after holding for 1 year.
4. Dubai Economic Free Zone, which will invest an additional $5 million to create a global hub for crystal orange and cryptocurrency.
5. Japanese regulators will lift a ban on overseas stablecoins this year.
6. SEC Chairman: "All cryptocurrencies except Bitcoin" are securities.
7. The BN spokesperson said the company has recruited more than 600 employees since the beginning of 2023 and plans to hire another 500 in the first half of the year. BN plans to increase its headcount by 15 to 30 per cent in 2023.
8. BN is in the process of applying for a cryptocurrency services licence in Singapore to move from retail customers to corporate customer services.
9. The judge overruled the SEC and other regulators' objections to BN US 'purchase of Voyager.
10. Russia's deputy energy minister has announced the large-scale opening of a sugar and orange mining center in Siberia.
Long-term insight: To look at our long-term situation; Bull/bear/structural change/neutral
Intermediate probe: To analyze what stage we are in, how long will we be in this stage, and what situation will we face
Short-term observation: used to analyze short-term market conditions; And the possibility of certain directions and certain events under certain circumstances
Long-term insight
• Weighted long-term and short-term carrying costs
• Realized capitalization model derivation
This week's in-depth analysis of market structure and operation from a cost perspective.
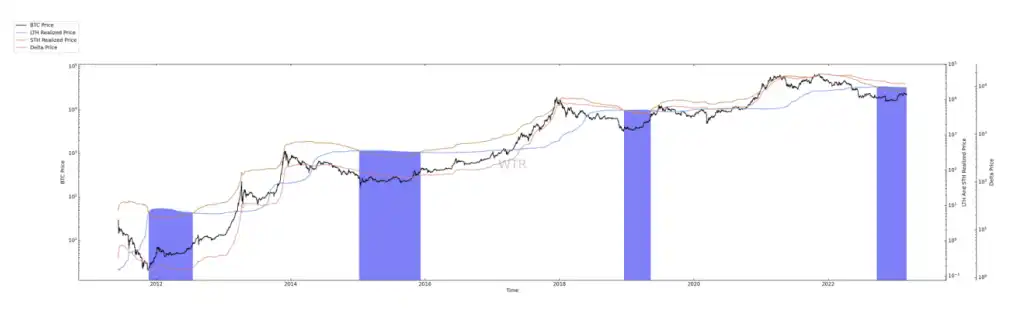
(Chart below: Weighted long-term and short-term carrying costs)
The most important game in the market lies in the psychological game, and the key of the psychological game is the anchoring effect.
The anchoring effect of capital markets is cost.
As two important players in the market: long term and short term.
The cost of both is also relatively important.
As can be seen from the chart above, when the cost of long-term participants is lower than that of short-term participants, the selling pressure of the market will usually enter a relatively low level, or the market will reach a relative time bottom.
This corresponds more to the anchoring effect, where participants are less eager to sell when they are no longer profitable and do not intend to leave the market.
At the same time, markets are dominated by short-term players.
(The figure below shows the capitalized model derivation.)
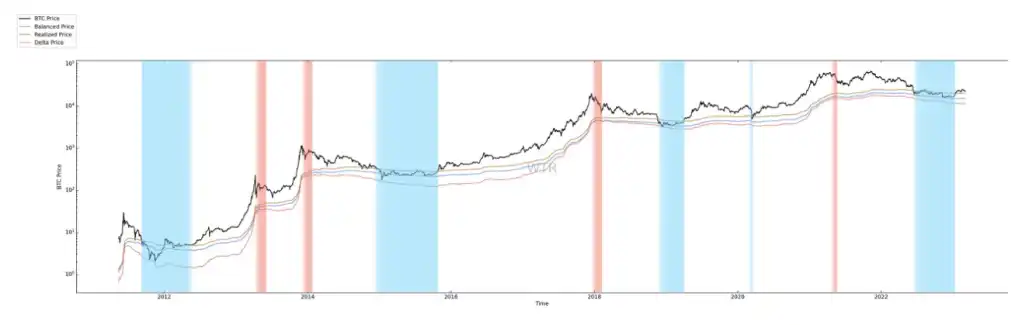
This process is abstracted from the other case, where the market has achieved an average weighting of final consumption.
Where Balanced prices (blue) are considered a relative "fair value" model.
Primarily to capture the difference between buying (cost basis) and likely selling (transfer).
The blue line has been shown to capture relatively large cycle lows many times, including this one.
It is obvious that:
• Blue areas
To achieve capitalized data below the market price.
• Red areas
To achieve capitalized data convergence and smooth slope.
It is also possible to see more deeply that the market is at a cyclical relative low when prices are below the relative capitalized cost price.
You could also look at it the other way around.
When the cost of realizing capitalization begins to converge and the upward high slope shifts to a flat slope, more may mean that the current market is relatively overweight.
May wait for the next cycle near the cost price, in the continuous continue to large holdings.
Prices are now above capitalized costs, having already hit two lows.
The cost of long-term holders is still lower than the cost of short-term holders, and the main stage of the market is still dominated by short-term.
Intermediate exploration
• Realized full status of long-term and short-term holders
• Short-term traders and high-weight sellers
• Profit and loss status of long - and short-term chips to the trading platform
• Options infrastructure
(See chart below for realized cash positions for long-term and short-term holders)
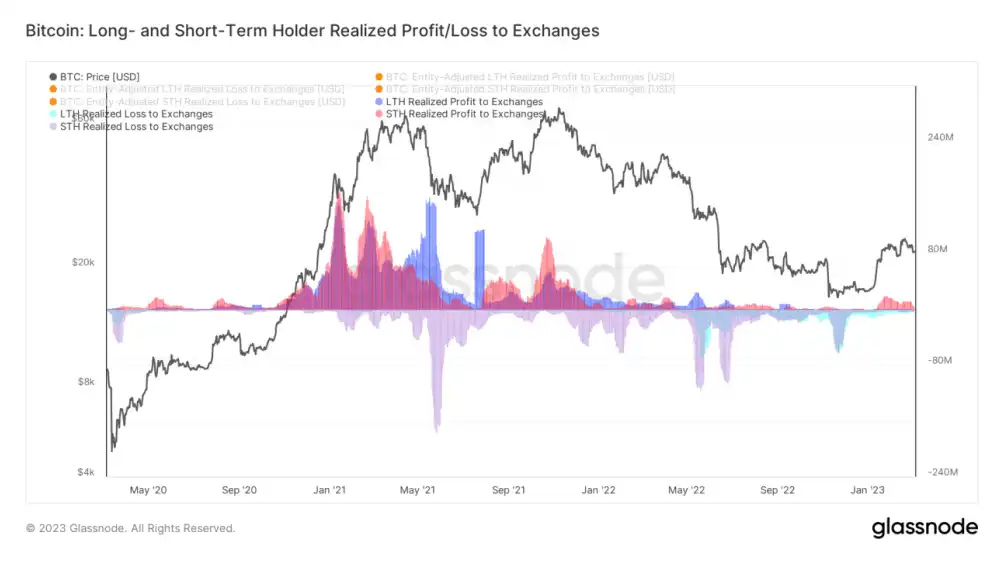
The significance of short-term chips to liquidity has been emphasized frequently in previous weekly reports. This time, we continue the topic and explore the significance of short-term chips.
As can be seen from the above data:
1. The limit point of filling loss chips of short-term traders may indicate the stage bottom area, which may be followed by consolidation and depressed wandering and turbulence;
2. If we carefully observe the behavior track of loss-making chips in the market, we will find that in the process of gradually converging at the bottom, there may also be "panic again" selling. If short-term chips supplying market liquidity are too low, the confidence of the market will be affected.
3. At the same time, the market has a certain acceptance limit for the profit-taking of short-term chips. Combined with the report of the previous few weeks, the proportion of short-term profit chips reached 97.5%, if the market lacks the supply of incremental funds, there is a greater probability of entering the state of correction.
4. Long-term profit chips can take profits very quickly at the end of a bull market, and the upside of the market depends on the amount of short-term money invested.
5. At present, there has been a certain degree of profit-taking of short-term chips, but because the profit-taking of short-term chips is only a small part of selling pressure, their generalization to the market needs to go through a more complex conduction. At the same time, from the observation, the short-term chip profit taking in the "neutral" market did not cause a big wave.
6. From a strategic point of view, the current up and down state depends on the strength of the bulls and bears. The recent observation is that derivatives have a high sensitivity in the stock market.
(Chart below short traders and high weight selling pressure)
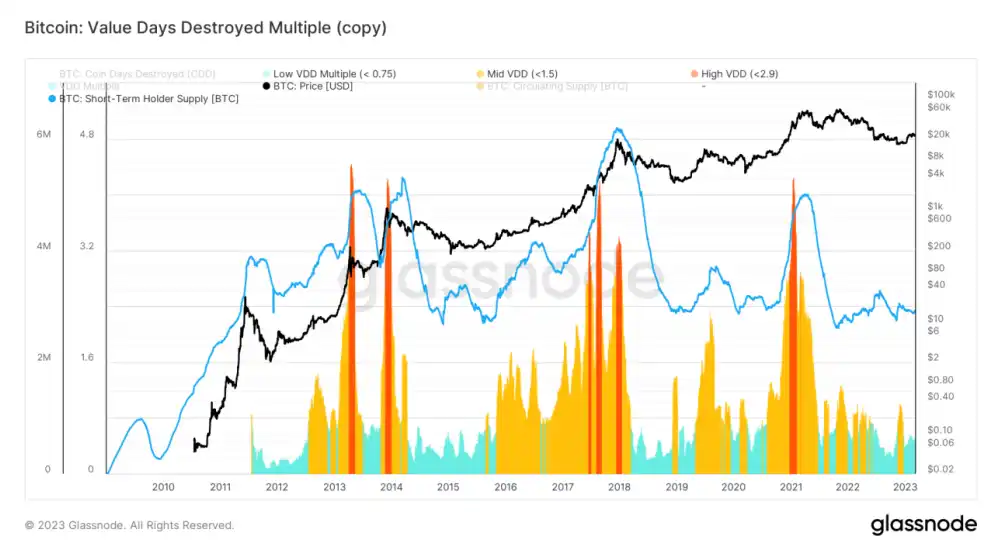
Short-term traders have rallied slightly, and the current market for short-term chips has not changed much, although the supply of new liquidity is weak, but not worse is probably a good thing.
(The following figure shows the profit and loss charging status of long-term and short-term chips to the trading platform)
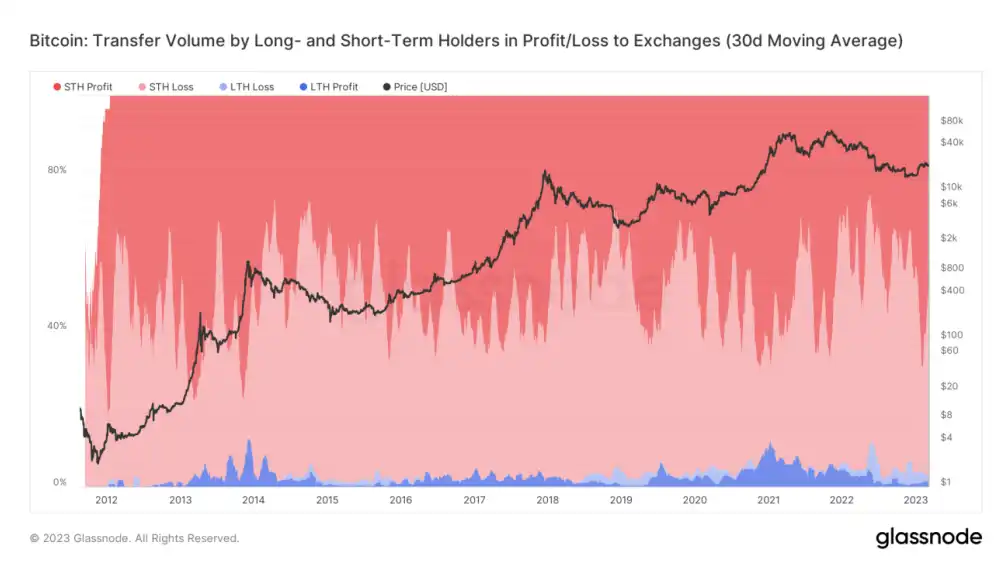
It is obvious to note that the selling pressure of short-term profit chips is gradually converging, and the current resistance effect may be gradually weakening.
In the process of gradual convergence, may be accompanied by consolidation and shock, the stock market in the game will be more anxious.
Continuation of the liquidity problem, analysis of the derivatives structure on the market impact.
(Option infrastructure below)
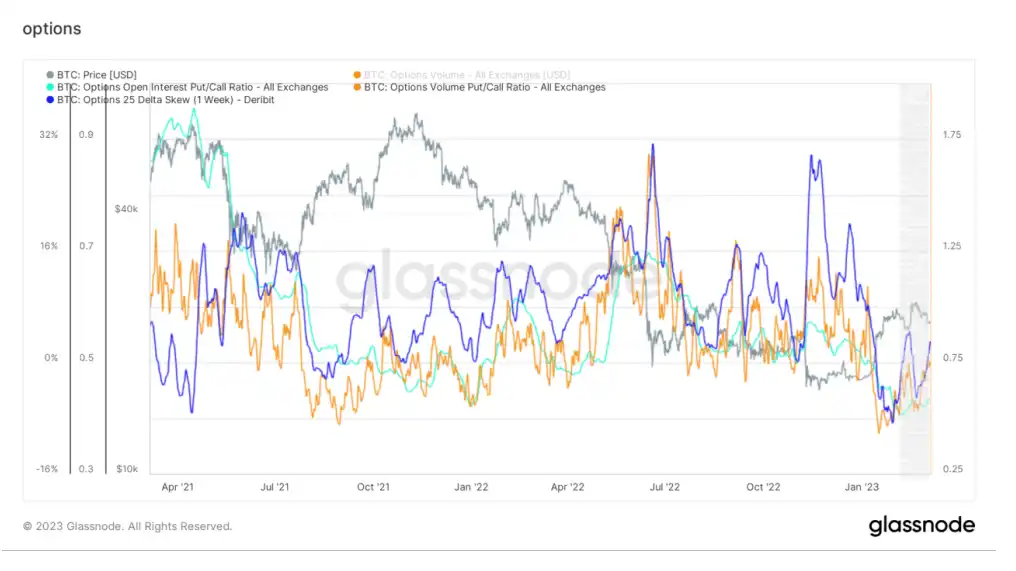
Blue line: Option implied volatility over 1 week
Yellow line: bearish/bullish ratio
Light blue line: bearish bullish position ratio
The 1-week implied volatility of options is rising, and there may be some volatility in the near term.
But given that derivatives can move markets relatively quickly, it is possible that major forces have yet to emerge when the market is unaffected.
The historical structure shows that the squeeze may occur when the put is falling, corresponding to the call is rising, because the speed is relatively rapid, so may react at the relatively subtle inflection point.
Of course, if you lock in the ratio of bullish to bearish options volume, you might see more clarity.
This week's exploration of derivatives structures is preliminary, with more to come.
Short-term observation
• Derivatives risk factor
• Option intent to volume ratio
• Derivatives volume
• Implied volatility of options
• Transfer of earnings and losses
• Add addresses and active addresses
• Crystal orange trading platform net position
• Net position of aunt trading platform
• High weight dump pressure
• State of global purchasing power
• Net position on stablecoin trading platform
• Off-chain trading platform data
Derivative rating: Risk is starting to digest, but it still takes time.
(The figure below shows derivative risk coefficient)
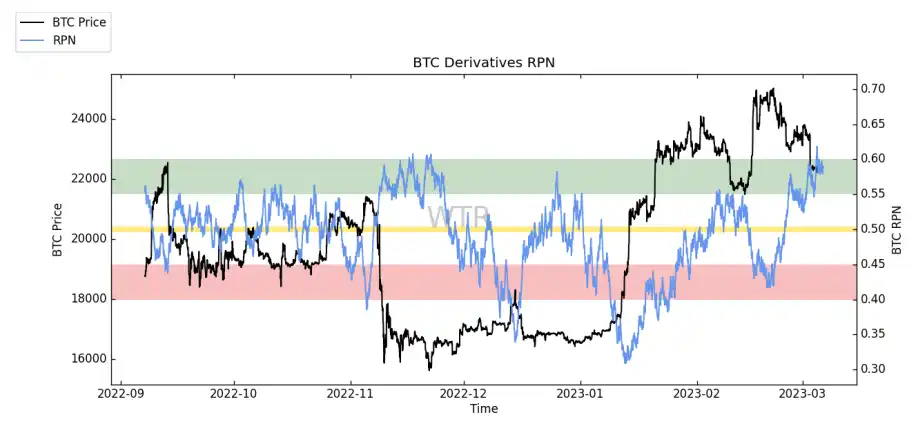
Over the past week, the derivatives risk coefficient has been oscillating in the upper extreme range.
From the perspective of risk coefficient of derivatives:
At present, the risk coefficient of derivatives has been in the extreme value area for a long time, and there may be a risk of downward swing at any time. At that time, there may be large fluctuations in the subsequent market, which should be taken precautions.
(Option intent to volume ratio below)
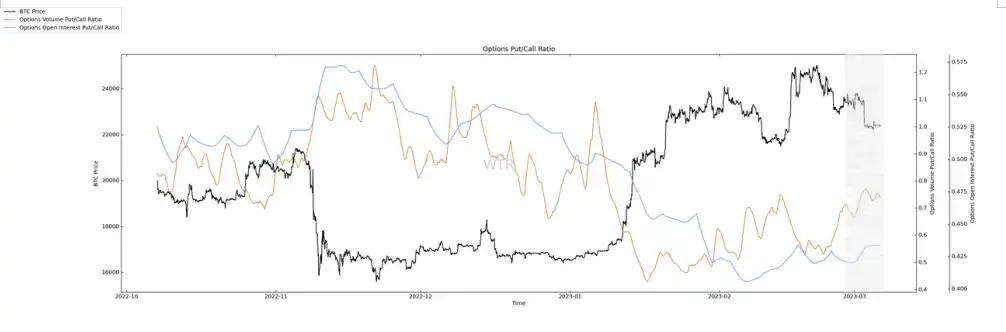
Along with the small correction of the market, the proportion of put options increased a little. Overall, the intent transaction ratio of options did not change much, but the trading volume increased.
(Chart below derivatives volume)
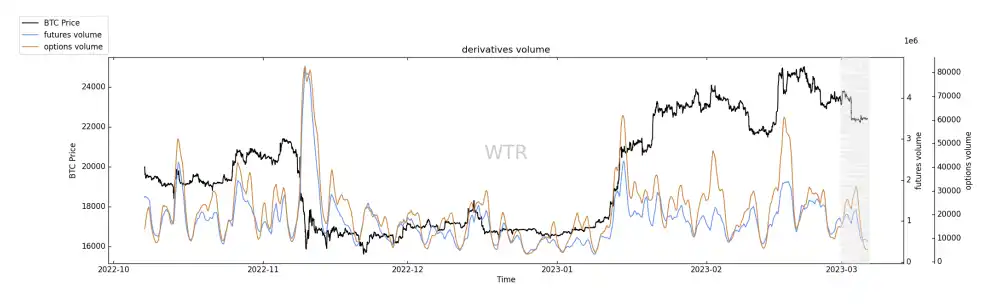
The overall volume of derivatives showed a large and rapid decline, indicating that the current level of derivatives traders bias to wait and see.
(Chart below shows options implied volatility)
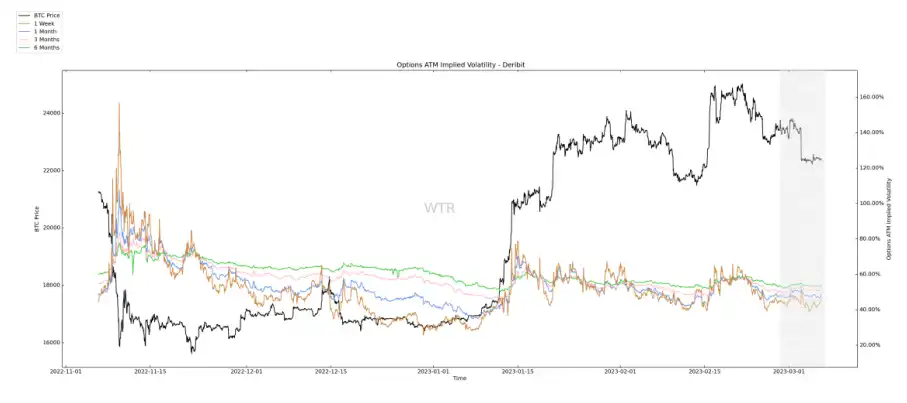
The implied volatility of options did not fluctuate significantly. Option traders in the current market are less active and less willing to bet.
Emotional state rating: flat overall
(The figure below shows the transfer of profit and loss)
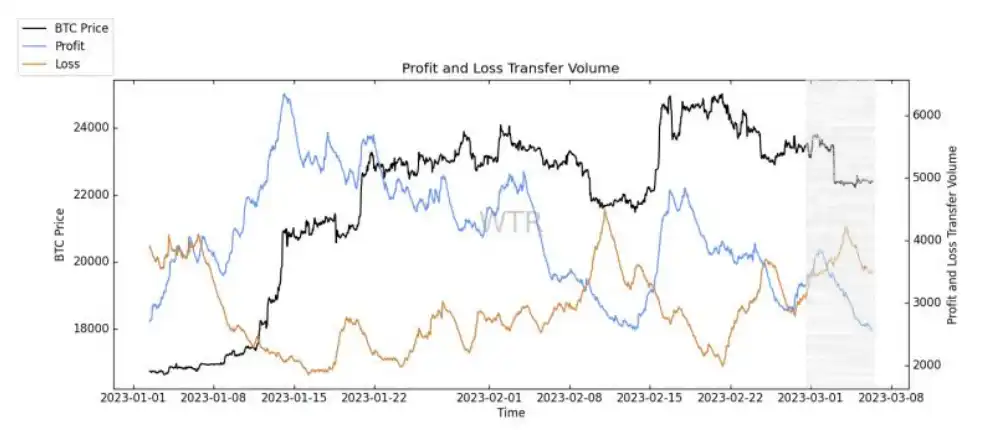
In the past two weeks, in the process of price correction, the selling of loss chips is more active, and the selling intention of profit chips in the past two days is relatively continued to decline, but there is also a reversal trend.
From the perspective of profit and loss transfer:
Along with the price decline, profit chips also did not show the tendency to settle profits early, but the willingness to sell continued to decline.
This is a relatively flat signal for the afternoon.
(New address and active address below)
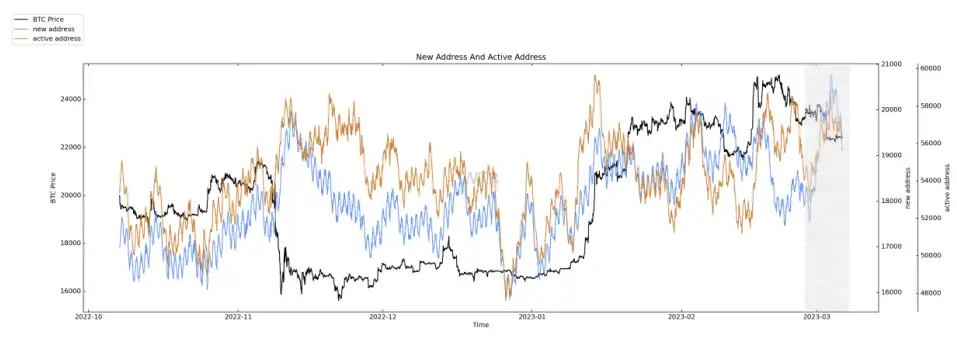
The rapid increase of new and active addresses indicates the high level of activity on the current market chain.
Spot and pressure structure rating: Accumulated chips reduced, slightly lower selling pressure.
(Chart below shows net position of Crystal orange trading platform)
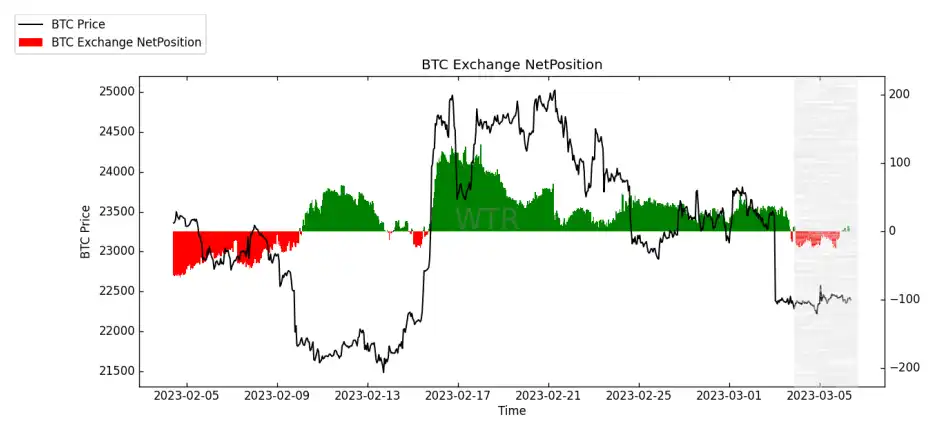
The net position accumulation of crystal orange trading platform continues to decrease, and there are a few inflow signals at present, indicating that the market will face certain small pressure at present.
(Chart below shows net position of e-Pacific trading platform)
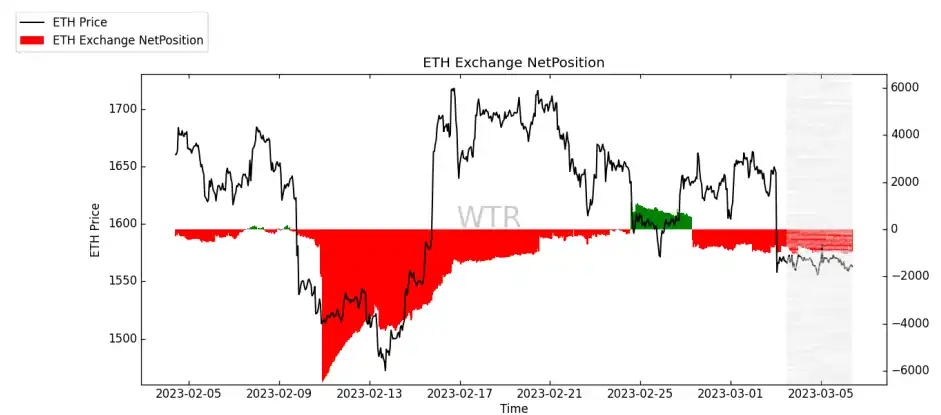
E too is currently in a relatively stable state of small continuous outflow.
Trading platform floor potential selling pressure continued outflow is a more positive signal.
(High weight throw pressure below)
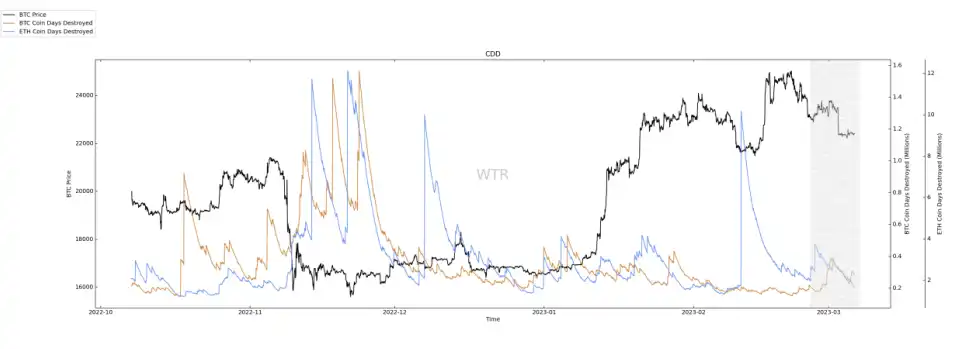
At present, the high weight selling pressure of E Tai and crystal orange is in a calm state.
Purchasing power rating: global purchasing power loss, stablecoin purchasing power increase.
(Chart below shows the state of global purchasing power)
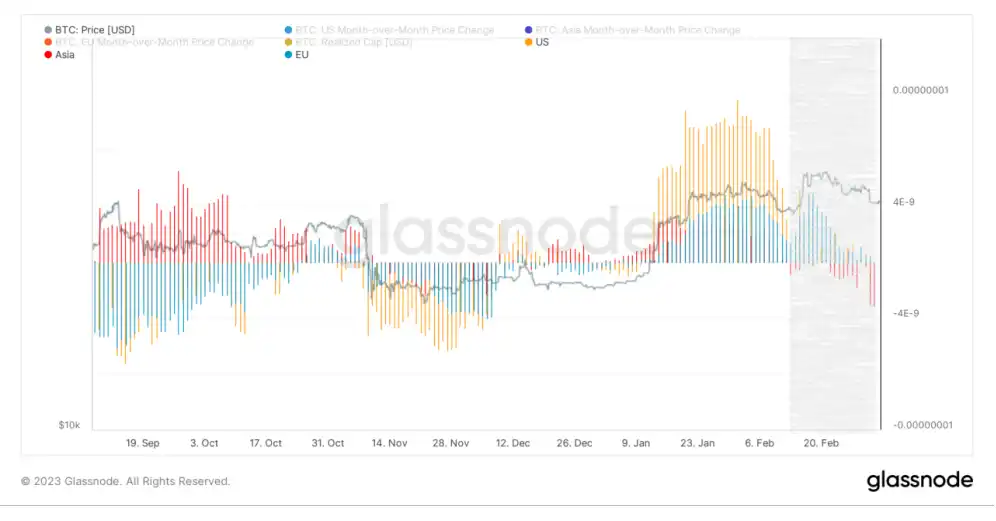
Along with the price correction, the global level of purchasing power continues to lose, with Asia the biggest loss of purchasing power.
Judging from the ongoing loss of global purchasing power, the subsequent market recovery may be a little weak.
(Chart below shows USDC trading platform net position)
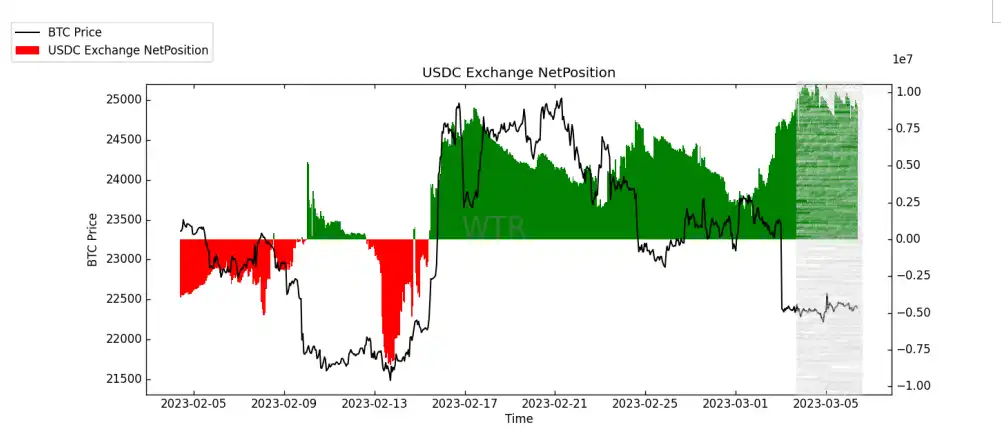
USDC continued to flow into the accumulation state, through the observation of the crystal orange trading platform net position comparison found that USDC last week has a relatively clear sign of the end.
Generally speaking, the increased purchasing power of stablecoin is positive for the pressure ability and price rise in the future market.
(Chart below shows USDT trading platform net position)
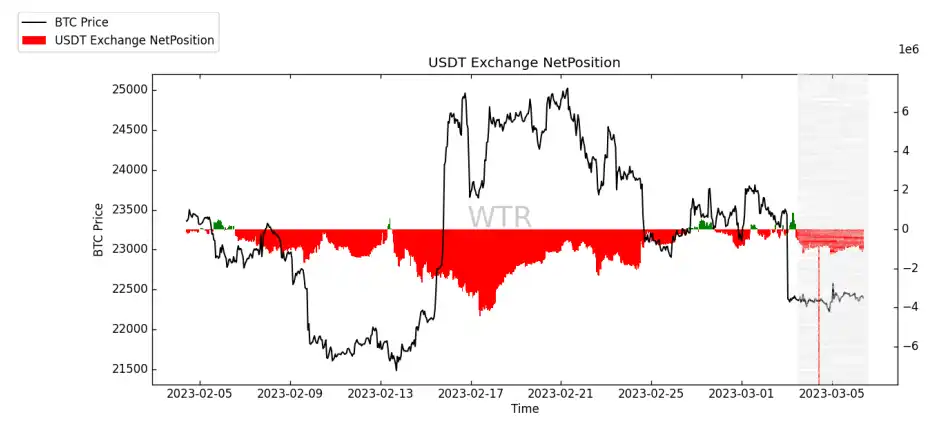
After a brief period of inflows last week, USDT trading platform net positions have turned into outflows.
Down chain trading data rating: Buy interest around 21500 -- 22000, sell interest around 22800.
(Figure below shows data from Coinbase chain)
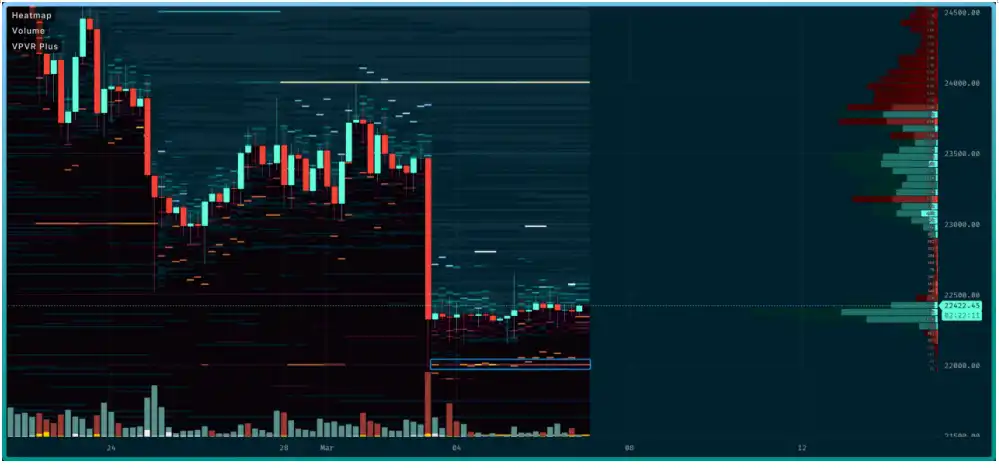
There is a willingness to buy at 22,000
(Figure below shows data under Binance chain)
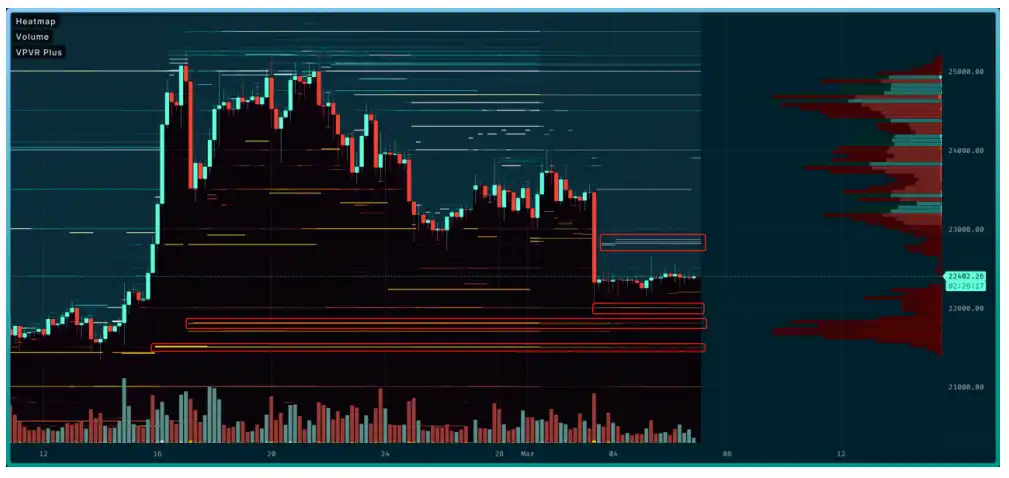
21500, 21800, 22000 price is willing to buy; There is selling appetite near 22800
(The figure below shows data under Bitfinex chain)
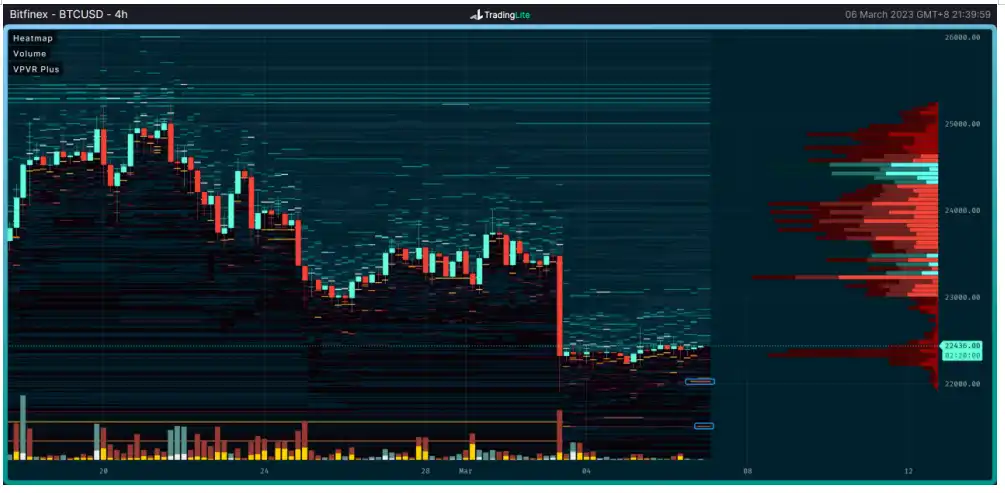
22020, 21500 price is willing to buy
Summary of the week:

Summary of message surface:
1. This week's data ranged from cooling to higher than expected, with market forecasts for the end point of rate hikes reaching 5.5%, ahead of where Fed officials had been expecting them to end.
2. There was the first hint of a pause in the Fed's rate hike over the weekend, but the market remains cautious ahead of Powell's upcoming monetary strategy on March 7 and 8, with eyes on the Fed chairman's testimony next week.
3. Although the discussion of the end point of interest rate hike appears anxious, when the news of stopping interest rate hike is put on the stage, the market begins to get ready and eager to try.
4. Focus on whether the March 10 non-farm data and March 14 February CPI data are positive.
The current wave of Open Ai's GPT is not yet a huge revolution and complete disruption, but more of an industry enhancement.
This enhancement also takes a little bit of time to slowly push in, which is to slowly land the dedicated AI.
Now, large general purpose AI is still some way off.
Then came the wave of AR and Web3, but it is impossible to determine which of the two will arrive sooner.
Among them, the interactive revolution brought by AR wave is huge;
The wave of Web3 cannot be separated from the DAO's new organizational model.
On the other hand, when it comes to the new energy batteries that so many people are talking about, the transition from liquid to solid state battery industry will take at least five to 12 years.
The explosion, revolution and disruption of every industry are accompanied by great opportunities;
One is the opportunity to build, the other is the big dividend of investment.
The era is now on the eve of the explosion of dedicated artificial intelligence;
Data + algorithm will be a powerful means of production in the future. Web3 and AR can redefine production relations and modes of production.
But the speed may not be what many people think.
Physical construction of AI machines and physical objects, because under the realistic physical rules, raw material quantity, processing speed, production cost, supply chain cluster constraints, output will not get extremely exaggerated expansion, the total production is limited for a period of time.
But the transmission and use of knowledge is to some extent cheaper.
So while cheap knowledge/brain workers are easier to replace, cheap manual labor is slower to be fully covered.
Each wave of science and technology will bring profound cultural paradigm changes. In the future, with successive waves, more cultures will have new changes and transfers.
In the new paradigm shift, the old part of the paradigm idea appears more cramped.
Technology develops not in a continuous and linear way, but through a series of "paradigm shifts".
To see or not to see, to do or not to do, to participate or not to participate.
Can't stop a new paradigm shift from changing everything to a new look.
Long-term insight on the chain:
1. The most important game in the market is psychological game, and the key of psychological game is anchoring effect, such as cost;
2. At present, the price is higher than the capitalized cost and has hit two lows before;
3. The cost of long-term holders is still lower than that of short-term holders, and the main stage of the market is still dominated by short-term.
• Market tone setting:
Shock;
If you play the game recently, you can pay attention to the status of the short-term players.
Mid-chain probe:
1. Short-term traders gradually converge selling pressure in the market;
2. The selling pressure of the market is not the main body, and the strength of liquidity will determine the main tone of the market;
3. When the volatility of options rises, it may be a precursor to the stock market;
• Market tone setting:
Neutral, fluctuating
As things stand, major market participants are not showing big moves, and higher volatility in derivatives could be a harbinger of volatility to come.
Policy suggestion: The oscillating strategy may be suitable. Note the disk change node.
Short-term observations on the chain:
1. The derivative risk decreased slightly, and the derivative model was in the extreme value region;
2. Trading volume has fallen;
3. The overall mood of the market is flat;
4. The trading platform data showed that the accumulation of chips decreased and the selling pressure was slightly lower;
5. Loss of global purchasing power and increase of stablecoin purchasing power;
6. Purchasing power has gone into negative territory in other continents except Europe;
7. The off-chain trading data shows that there is buying intention near 21500 -- 22000, and selling intention near 22800.
8. The probability of not falling below $16,500 ~ $20,500 in the short term is 70%;
9. 73% probability that the price will not exceed $24,000 to $26,000 in the short term.
• Market tone setting:
The overall pressure level of the market is not high, neutral sentiment, good activity, capacity to undertake slightly increased.
Strategy suggestion:
Relative shock strategy is better.
Risk warning:
The above are market discussion and exploration, and do not have directional opinions on investment; Please treat carefully and prevent the market black swan risk.
This article is from submission and does not represent the views of BlockBeats.
Welcome to join the official BlockBeats community:
Telegram Subscription Group: https://t.me/theblockbeats
Telegram Discussion Group: https://t.me/BlockBeats_App
Official Twitter Account: https://twitter.com/BlockBeatsAsia

 Related Articles