The fourth week on the chain data analysis: the market slightly rational, the overall derivatives are relatively depressed

The original title: "noon dream qianshan mountain, window Yin an arrow | WTR 1.30"
原文作者: WatchToweR Crypto
Review of the week
This week, from January 24 to January 30, the highest was near $23,962 and the lowest was near $22,450, with a swing of about 6.7%.
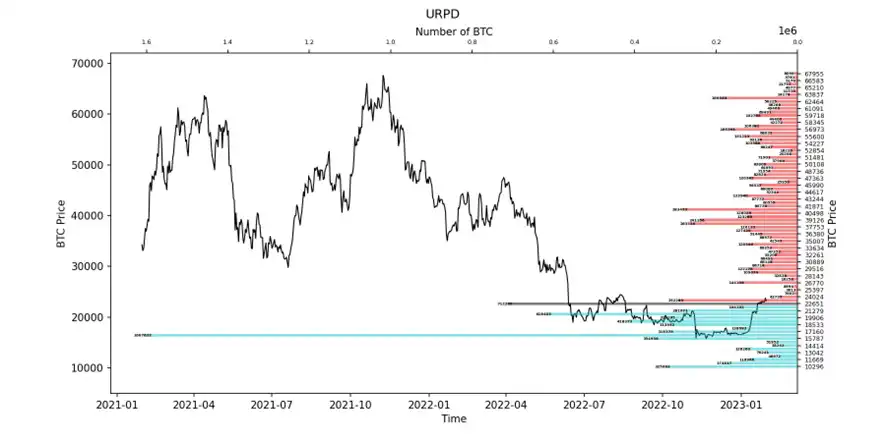
Observe the chip distribution chart, there are a lot of chips traded around $22651, there will be some support or pressure.
• Analysis:
1. 23000 ~ 28000 about 550,000 pieces;
2. About 2.81 million from 18,500 to 22,500;
• The probability of not breaking 16500~20500 in the short term is 71%.
Important information
Economic news
• United States
1. Us Markit PMI in January:
a. Preliminary manufacturing PMI 46.8 vs. 46.2 expected Dec.
b. The preliminary composite PMI was 46.6, compared with 45 before December.
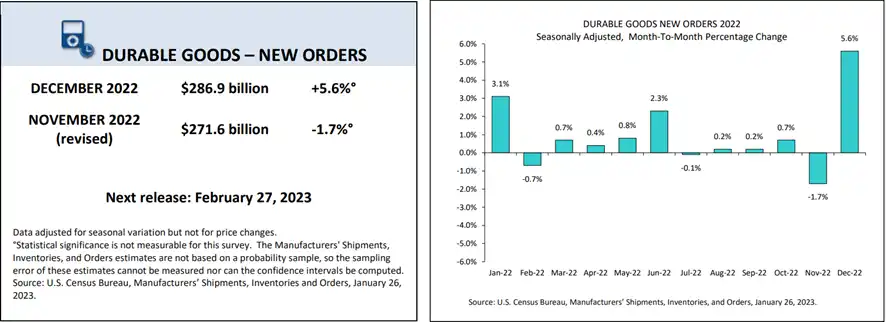
2. December US durable goods orders data:
a. Month-on-month growth of 5.6%. Excluding transport orders, they fell 0.1 per cent. Excluding defence orders, growth was 6.3 per cent.
(Photo credit: Census)
1. Us real GDP grew 2.9% q/q in Q4, vs. 2.6% exp. Vs. 3.2% exp.
a. Personal consumption, which accounts for about 68% of GDP, grew 2.1% vs. 2.5% exp. & 2.3% exp.
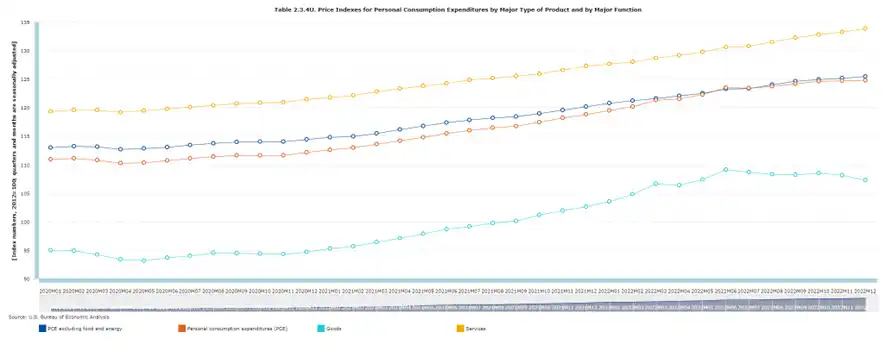
2. The PCE price index data for December 2022 are as follows:
a. The PCE price index increased by 0.1% month-on-month in December, compared with 0.1% before, and increased by 5% year on year, compared with 5.5% before;
b. The changes of PCE price index, core PCE price index and goods and services index in 2022 are as follows:
(Photo credit: BEA)
1. The University of Michigan Consumer Sentiment Index was 64.9 in January from 64.6 in January and 59.7 in December.
• Eurozone
1. This week's S&P Global (S& P Global), the PMI for the euro zone in January:
a. Preliminary composite PMI of 50.2, expected 49.8, the previous 49.3, is the first time above 50 growth or contraction since June;
b. Preliminary manufacturing PMI was 48.5 vs. expected 48.8 vs. previous 47.8;
c. Services PMI flash 50.7, above the expansion/contraction line for the first time since August last year, 50.2 expected versus 49.8 previously.
• Other
1. Gold prices have been volatile this week.
2. Crude oil prices fell slightly this week.
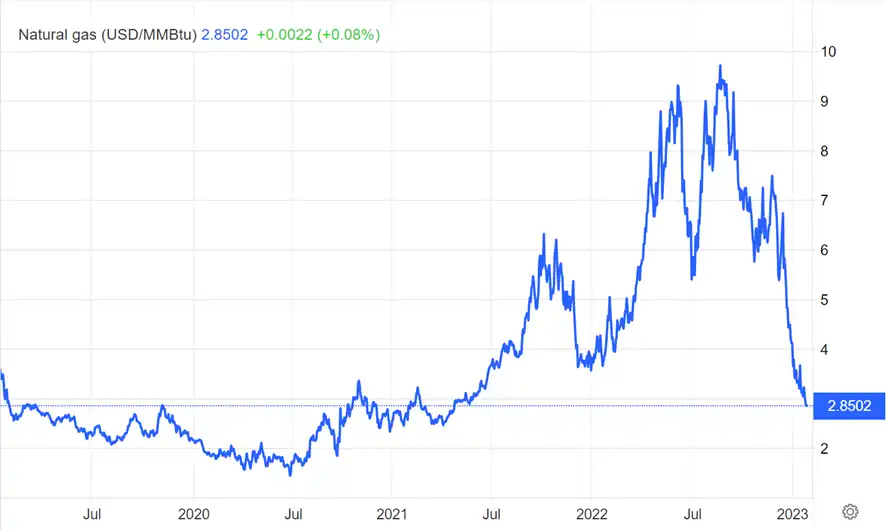
3. Natural gas futures continued their volatile decline this week, hitting lows not seen since mid-2021.
Encrypted ecomessaging
1. Head of Digital Assets Committee: One of the first tasks of the newly formed House Subcommittee on Digital Assets, Financial Technology and Inclusion is to legislate for stablecoin.
2. Arizona Senator Wendy Rogers has proposed a bill that would make crystal orange legal tender in the state, giving it the same status as the U.S. dollar if passed through flatbread.
3. The French National Assembly, voted in favor of relaxing licensing requirements for encryption companies. The European Union plans to enact a digital euro bill and a metaverse policy in May.
4. Japan's Financial Services Agency (FSA) : It is working on lifting the ban on domestic distribution of stablecoins and plans to allow certain stablecoins into the market by June at the latest.
5. Global rating agency Moody's is developing a Stablecoin scoring system that will include an analysis of about 20 stablecoins based on the quality of proof of reserves supporting Stablecoins.
6. Goldman Sachs: The Rock Orange will be the world's best performing asset in 2023, putting it at the top of the investment list, ahead of gold, energy, the S&P 500, real estate, the Nasdaq 100, and the 10-year Treasury.
7. BN CZ: Several failed cryptocurrency projects last year hindered the growth of the cryptocurrency industry in the short term, but we have seen a recovery.
8. Tesla reported that it did not sell any crystal oranges in the fourth quarter and that it had digital holdings valued at $184 million.
Long-term insight: To look at our long-term situation; Bull/bear/structural change/neutral
Intermediate probe: To analyze what stage we are in, how long will we be in this stage, and what situation will we face
Short-term observation: used to analyze short-term market conditions; And the possibility of certain directions and certain events under certain circumstances
Long-term insight
• On-chain Delta differential pricing model
• Participant positions in different cycle periods
• Price chip structure distribution
This week is mainly about bear market pricing research and discussion.
(Chart below shows the on-chain Delta differential pricing model)
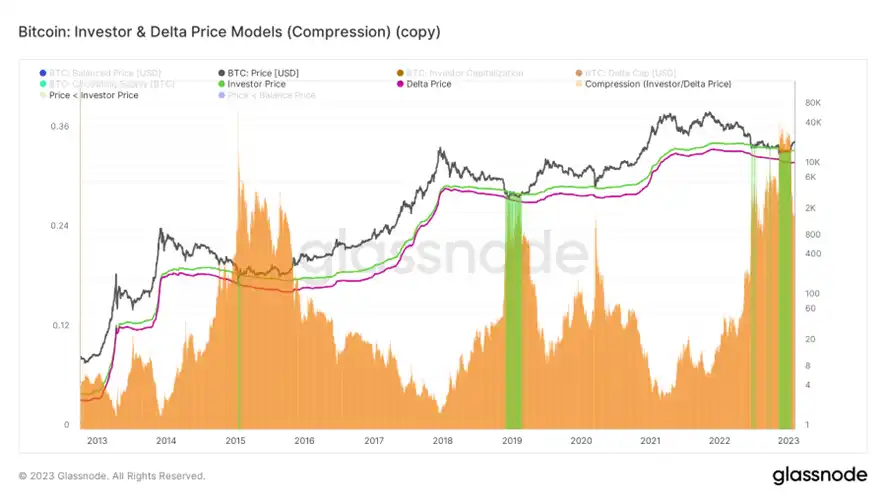
• The green area is mainly the combined difference and cost of purchases minus expenses.
• The green line is an advanced version of costs grafted on to long-term investors, using break-even costs to explore the bottom of a bear market.
It is mainly based on the derivative model of on-chain trading volume.
On a historical scale, prices have a high probability of touching the green line, and a high probability of producing green areas.
Somewhat in line with historical cycles, showing green areas.
Historically, it tends to be the bottom of the cycle.
Cost and chip profit and loss status, for decision-making and long-term market pricing, have sufficient reference.
Further reference to different period period participants chip position structure.
(The following chart shows positions held by participants in different cycle periods)
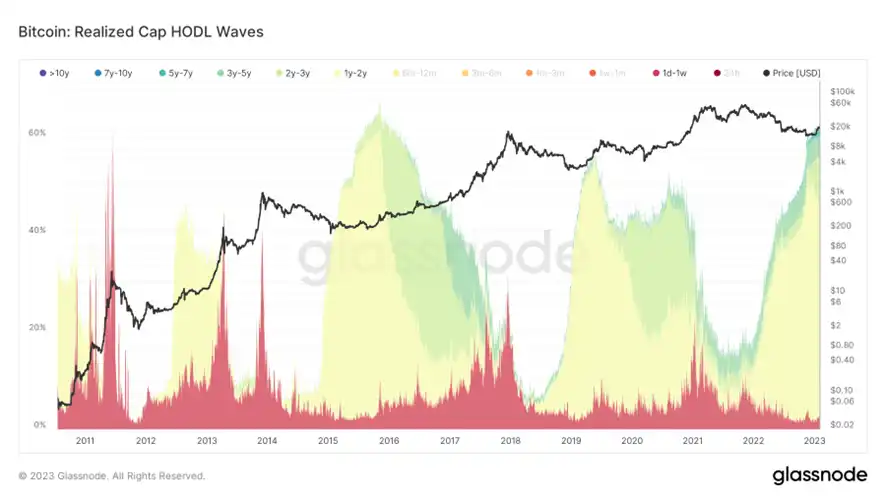
It can be seen that during the green zone period, long-term investors over one year choose to accumulate a large number of chips.
They tend to accumulate chips relatively low and hand them over relatively high.
(The chart below shows the structure distribution of price chips)
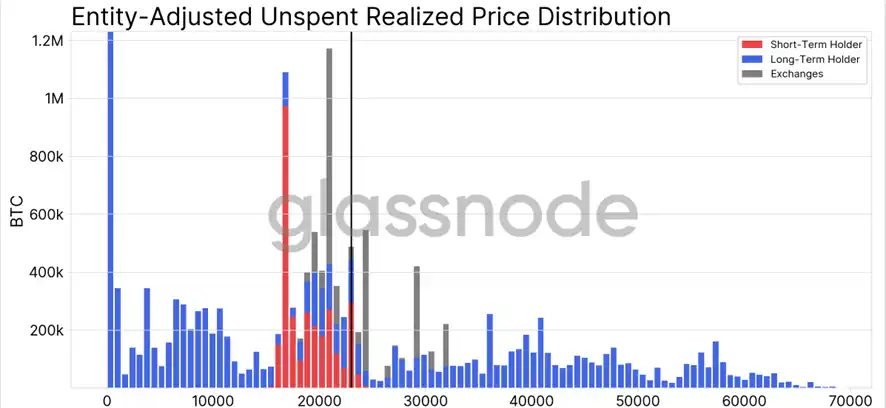
About 1.1 million chips were accumulated at about 16500 dollars this time, but a lot of them were short-term funds, which were relatively long-term at a higher price.
The range of long-term investor chips accumulation is not as fast as before, but the overall height is close to the highest in history.
In this respect, the structure of future market consistency may take some time.
More volatility, or endurance, is needed, as well as time to ease the profit-taking of short-term participants.
From this point of view, in the future long-term, because the increase of short-term participants and long-term investors chip price dislocation, may not be able to quickly climb out of the price vortex.
Perhaps due to the lack of consistency, the future process will also need to share the profits of short-term participants.
Except, of course, a huge short squeeze.
Intermediate exploration
• Online emotional positivity
• Short-term profit and loss percentage structure
• The proportion of ultra-short-term newcomers
• Total supply of short-term traders
• Net position in untouched supply over half a year
Trading sentiment Rating: Slow
(The picture below shows online emotional positivity)
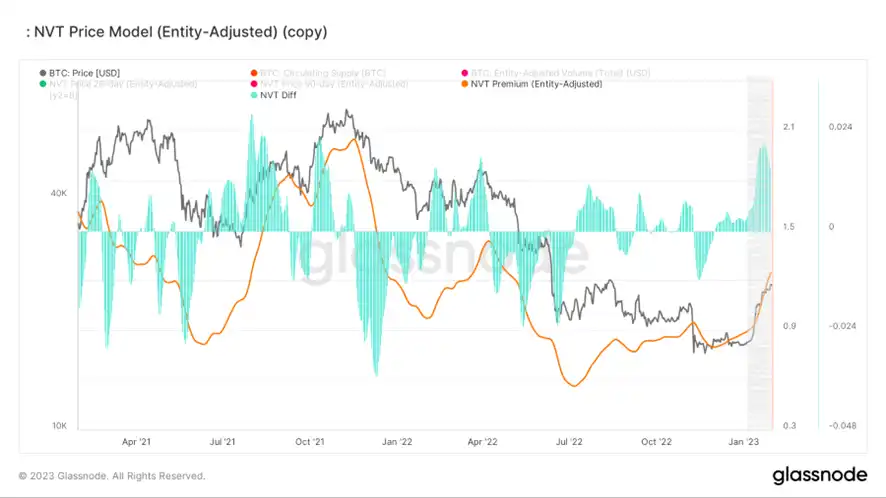
Online sentiment is showing signs of slowing growth, perhaps the market is now becoming a little more rational.
Long - and short-term structural rating: Liquidity injection is slightly slower, long-term chips slightly sold
(Chart below shows short-term profit and loss percentage structure)
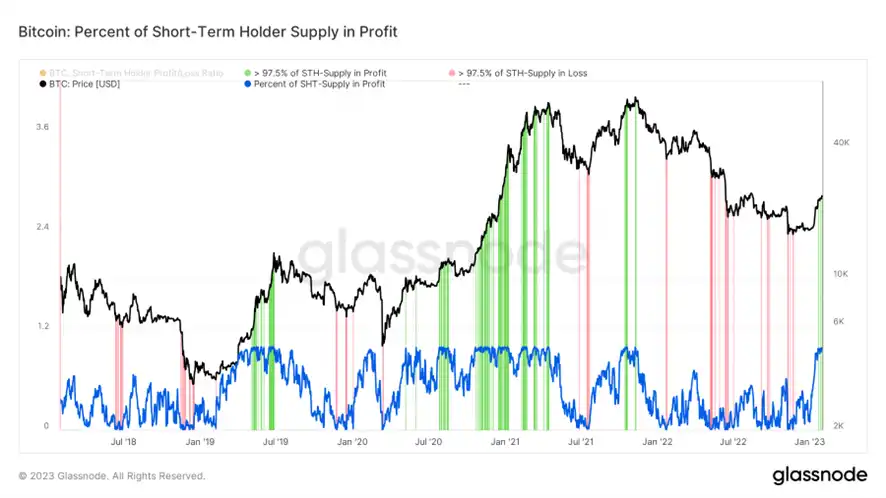
The data statistical short-term chip profit and loss ratio presented by the general law.
Red zone: short-term trader loss supply > 97.5%;
Green area: Short-term trader profit supply > 97.5%.
When the market enters the red zone, it often represents the signal of the formation of stage lows. In the case that the general rule has not been broken, it may be a better positioning position.
At the same time, there may be subsequent rallies to the lows, which may apply to lower levels of leverage.
Of course, stop profit, retracement and other complex conditions still need to be measured by a complete strategy.
When the green zone is formed, it may create upward resistance to the market, but this situation in a bull market (i.e. short-term traders are generally in a state of growth, fomo) requires additional data to think about.
(The following chart shows the proportion of ultra-short-term new forces)
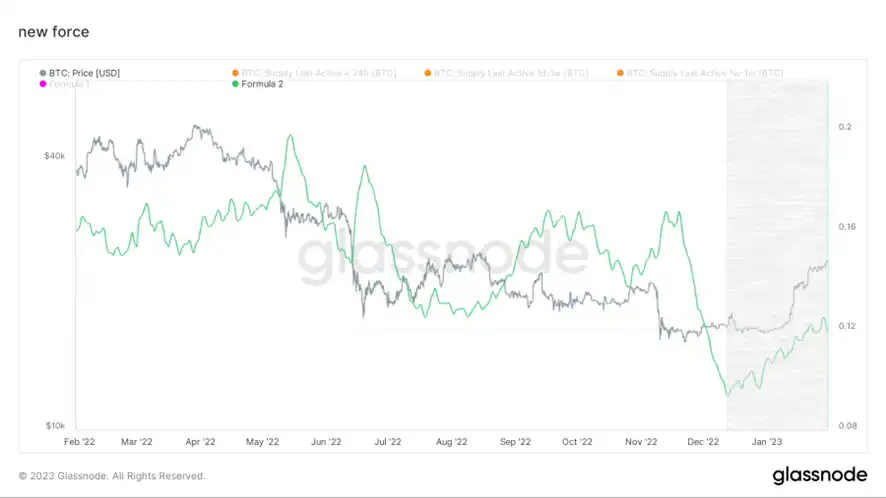
The proportion of super - short-term new force has slightly slowed down, may need a new round of adjustment in the link of liquidity injection.
They may be there to add liquidity to the market and are a group not to be underestimated in observing new forces.
When this group continues to decline, it may leave the market in a illiquid predicament.
(Chart below shows total short-term trader supply)
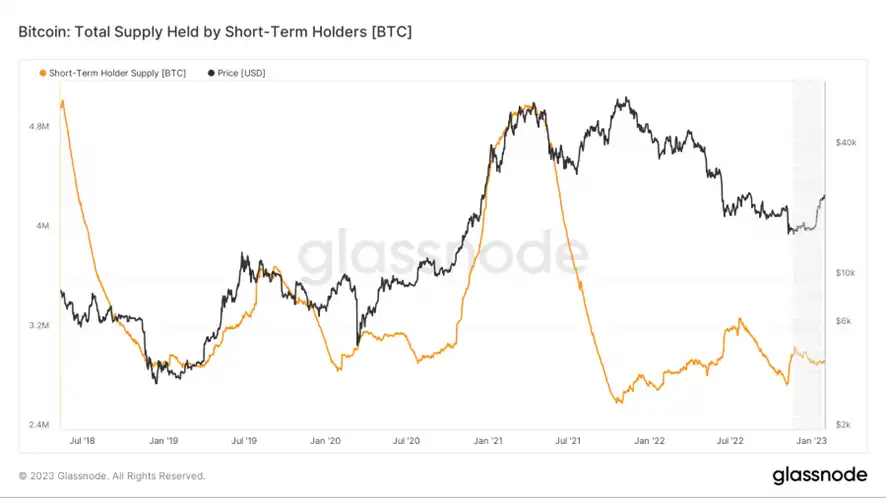
The market is still relatively flat for short-term traders.
At the same time, given the profit and loss structure of short-term traders, they still need more liquidity injections.
(Chart below shows net position in unmoved supply over half a year)
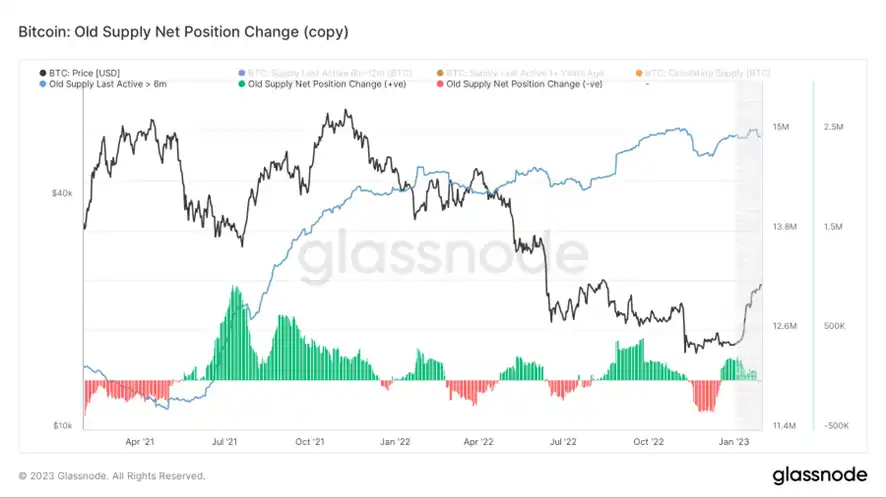
This model calculates the status of unused supply in circulation for more than half a year.
When the unmoved supply of more than half a year increases, it may mean that the selling pressure from this part of the group decreases in the process of market circulation.
This group will have a relatively high weight ratio in a relatively illiquid environment.
Short-term observation
• Derivatives risk factor
• Option intent to volume ratio
• Derivatives volume
• Implied volatility of options
• Transfer of earnings and losses
• Add addresses and active addresses
• Net position in Crystal orange Exchange
• Net position of aunt Trading
• High weight dump pressure
• State of global purchasing power
• Net Stablecoin exchange position
• Off-chain exchange data
Derivative rating: derivative risk is close to neutral and partial risk area
(The figure below shows derivative risk coefficient)
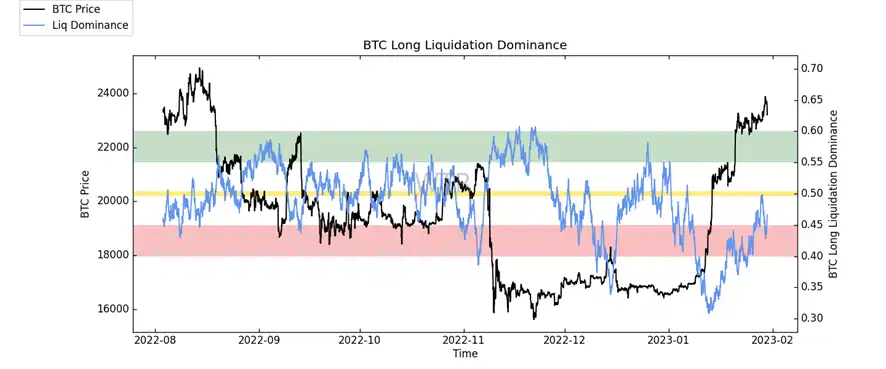
The sliding scale of derivative risk is not very large and not in the absolute risk zone.
(Option intent to volume ratio below)
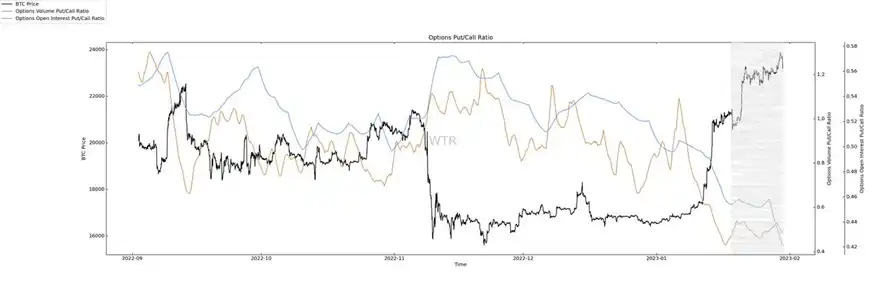
There was a slight increase in the bullish percentage of options, but overall volume was not high.
The impact is likely to be limited.
(Chart below derivatives volume)
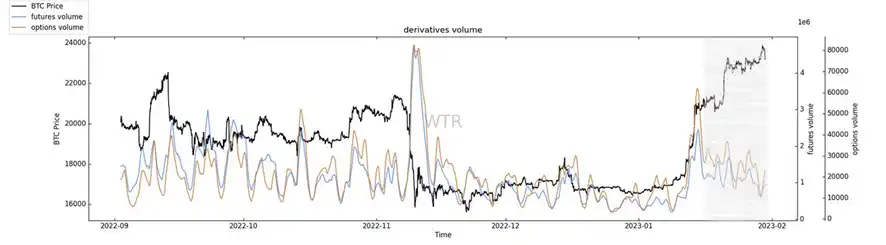
Trading volume of derivatives gradually decreased, and there is a certain percentage of short-term rebound at the present stage.
The overall betting performance of the market looks slightly depressed.
(Chart below shows options implied volatility)
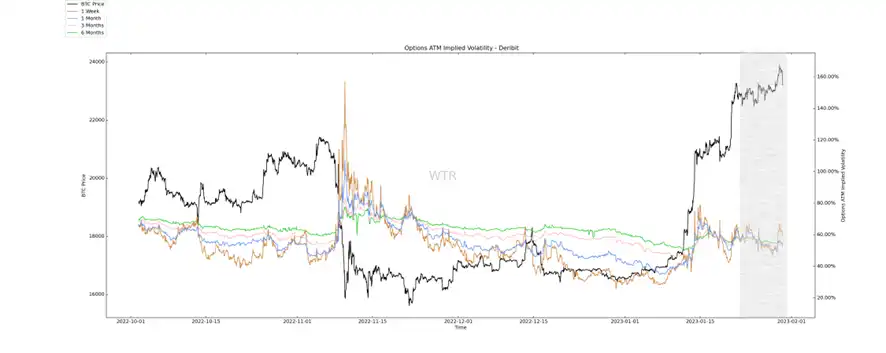
The implied volatility of options has risen somewhat over the one-week period, which may have something to do with Fed policy.
That caused the option participants to start placing a certain amount of bets.
Emotional state rating: Emotional state decreased slightly
(The figure below shows the transfer of profit and loss)
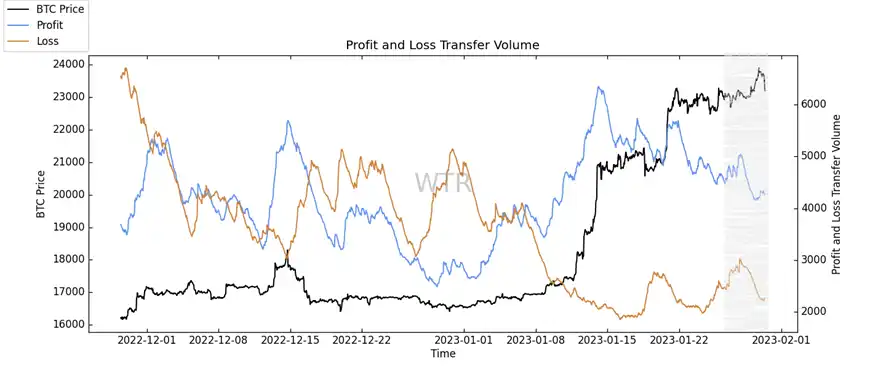
The selling pressure on profits is starting to come down, as is the stampede on losses.
The market looks pretty good from this structure.
(New address and active address below)
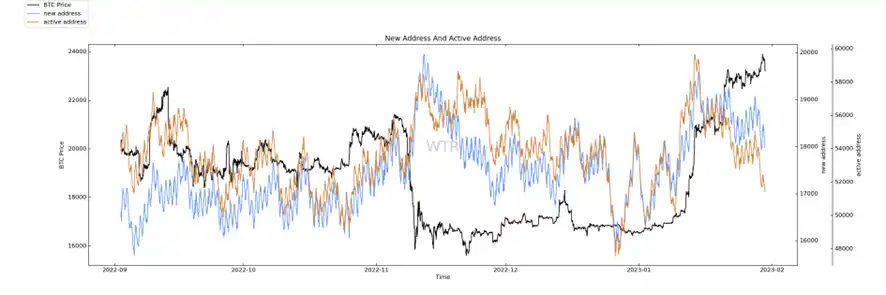
New and active addresses are in the midst of a cooling down, and the enthusiasm that might exist is beginning to wane.
It might affect the upward space a little bit, but overall it looks like the new addresses are higher than the active addresses, which is a little better.
It's better than two months ago.
Spot and sell pressure structure rating: There is some potential sell pressure
(Below chart: Net position of Crystal orange Exchange)

Perhaps because of the coming Fed policy; A certain amount of potential selling pressure poured into the exchange.
Introduces a degree of uncertainty into the short-term future.
(High weight throw pressure below)
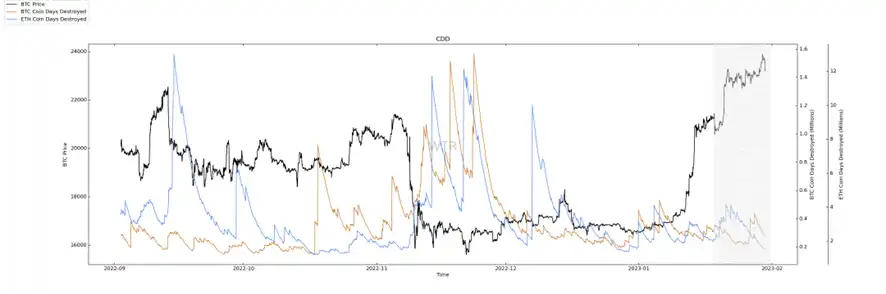
High weight selling pressure is currently at a certain low.
There is not much effect of high weight pressure.
Purchasing power rating: stable currency purchasing power loss, Americas buy strong
(Chart below shows the state of global purchasing power)
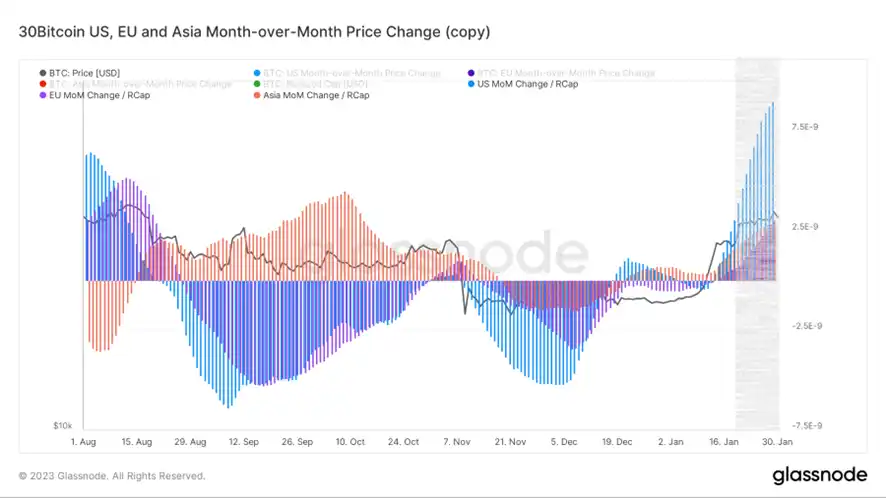
The Americas are still relatively ahead in purchasing power.
The existence of premium performance, has been more obvious.
(Chart below USDC Exchange Net position)
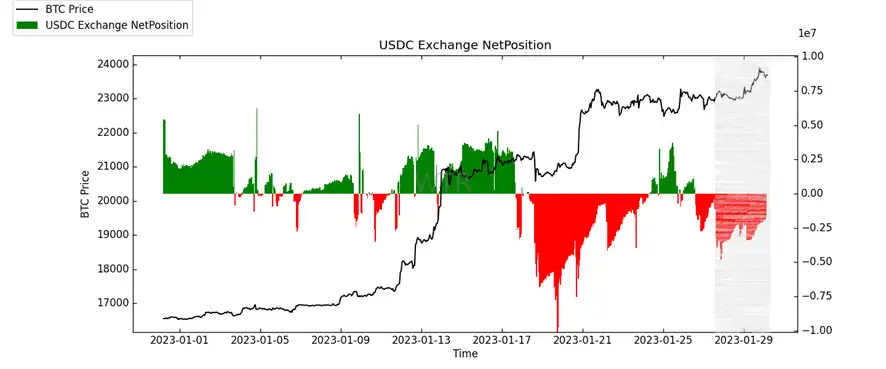
Stablecoins have run away, and there is not much purchasing power to support them.
In this case, without further derivative effects, the upside is likely to be relatively limited.
Off-chain transaction data rating :21000-21500 Willing to buy
(Figure below shows data from Coinbase chain)
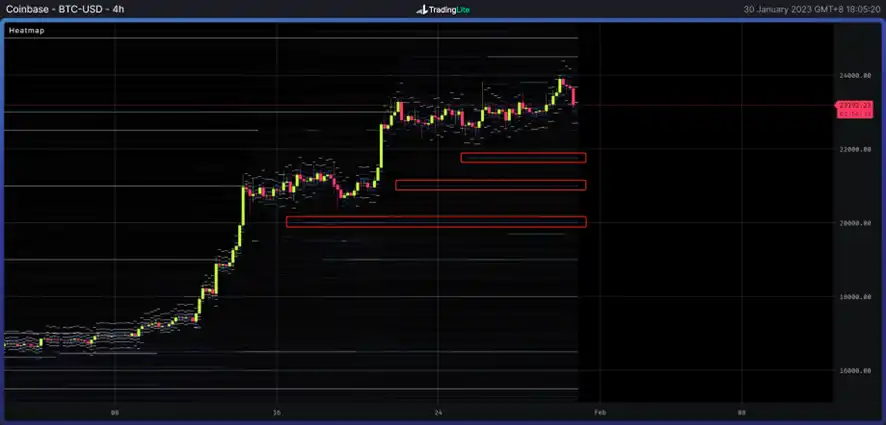
Intention to buy at 21800, 21000, 20000.
(Figure below shows data under Binance chain)
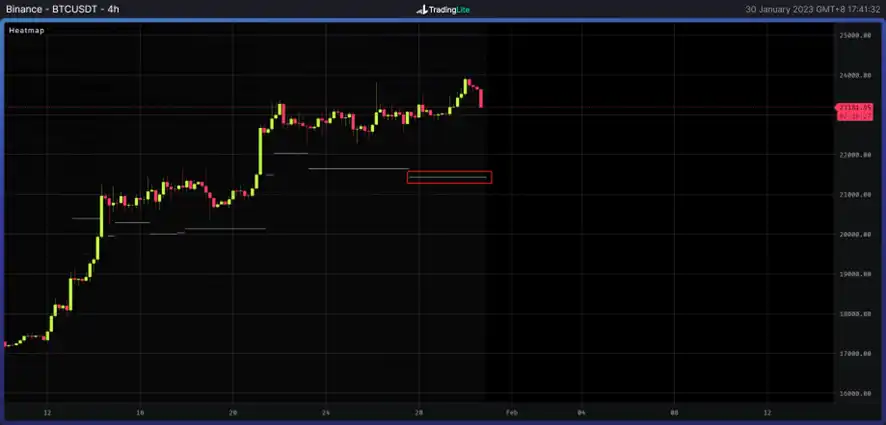
Willingness to buy at 21500.
(The figure below shows data under Bitfinex chain)
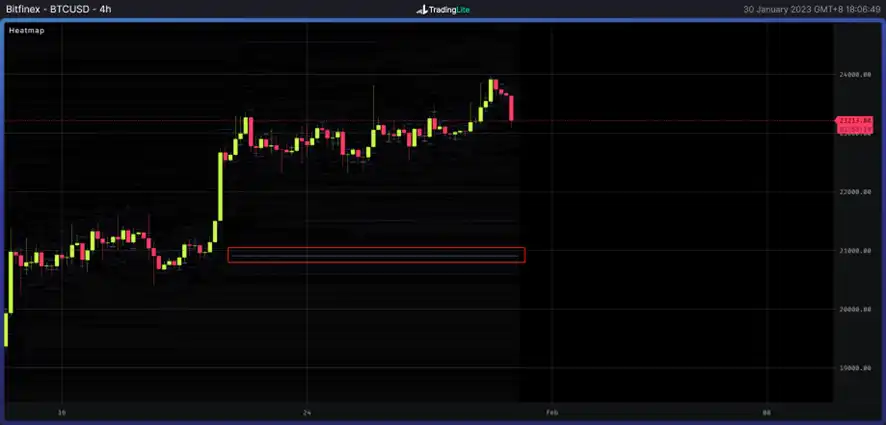
Willingness to buy at 20900.
At the moment, the market is starting to be more on the sidelines and there is not much order flow data.
Summary of the week:

Summary of message surface:
1. With consumer spending down and inflation slowing, markets have scaled back expectations for a continuation of the Fed's aggressive monetary strategy and the Fed's top priority appears to be shifting to avoiding a hard landing.
2. With fewer interest rate hikes and a slowing economy, market participants are likely to take a wait-and-see attitude, waiting for signals to be confirmed.
As an emerging market cryptocurrency, while many institutions give positive forecasts for its trend in the New Year, it also seems to be waiting for a landing booster.
When the opposing voices of the market gradually ease, stalemate appears obvious changes, allocation strategy and advance layout is crucial to seize the opportunity, may be the start of a new cycle.
It may also be a good time to focus on the few remaining rate hikes this year that will be significant for markets.
Long-term insight on the chain:
1. Cost and chip profit and loss status, which has sufficient reference for decision-making and long-term market pricing;
2. The on-chain Delta differential pricing model has been reached before, and the historical performance tends to be in the historical bottom region;
3. About 1.1 million chips were accumulated at around 16,500 dollars this time, but most of them were short-term funds, which were higher in the long-term;
4. Perhaps due to the lack of consistency in the range of chip accumulation of long-term participants, profits of short-term participants need to be shared in the future process;
5. It may be due to the profit of short-term participants, which leads to the existing price vortex at the present stage. It may also need stronger capacity to undertake, or time to digest.
• Market tone setting:
Return the market structure to normal; Short-term players are having more of an impact in the current market, and it will take time or more strength to get out of the price maelstrom.
Mid-chain probe:
1. From the perspective of the enthusiasm of network emotion, it may slightly return to rationality;
2. Short-term chips inject liquidity slowly;
3. The supply of long-term chips has decreased slightly;
4. The proportion of ultra-short-term supply is slowing down.
• Market tone setting:
Slow down
Currently in a more neutral slow pace zone, liquidity injection is slow, at the same time, the supply of long-term chips slightly reduced.
Strategy suggestion: The current situation is more suitable for slow investment, reduce the frequency of short-term operation.
Short-term observations on the chain:
1. The derivatives risk is close to the neutral and partial risk area, and the overall derivatives are relatively low;
2. The weekly volatility of options derivatives has risen slightly, perhaps due to the recent Fed announcement.
3. The mood is good, and the newly added address is slightly higher than the active address;
4. Perhaps because of the upcoming Fed policy; Exchange generated a certain amount of potential selling pressure influx;
5. The purchasing power of stablecoin is lost, and America leads the world in purchasing power;
6. In terms of off-chain data, 21000-21500 have purchase intention;
7. The probability of not breaking 16500~20500 in the short term is 71 %.
• Market tone setting:
Short-term uncertainty and wandering.
Policy suggestion: Configure the short position
Risk warning:
The above are market discussion and exploration, and do not have directional opinions on investment; Please treat carefully and prevent the market black swan risk.
This article is from submission and does not represent the views of BlockBeats
Welcome to join the official BlockBeats community:
Telegram Subscription Group: https://t.me/theblockbeats
Telegram Discussion Group: https://t.me/BlockBeats_App
Official Twitter Account: https://twitter.com/BlockBeatsAsia

 Related Articles