The domino effect is eased, can the extreme come to life?
Original title: " The domino effect is eased, can the extreme come to life? |Foresight Ventures Weekly Brief "
Original author: Chelsea Jonas, Foresight Research
Market Opinion
< /p>
Macro liquidity
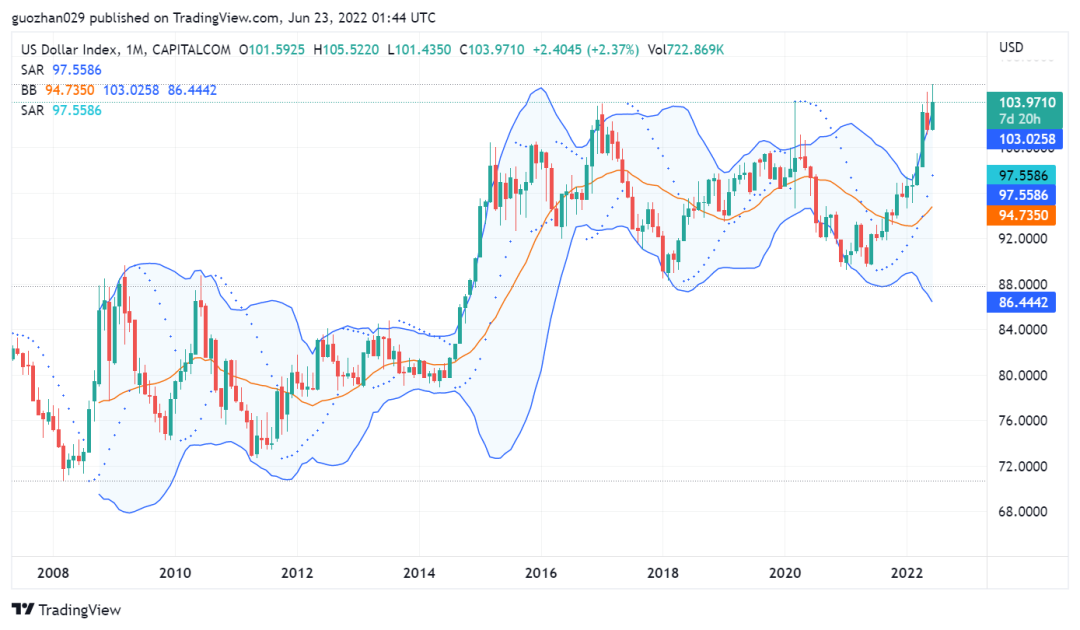
The overall liquidity of money is tightening. Powell made another hawkish speech on fighting inflation, proposing that the Fed is firmly committed to continuing to raise interest rates until inflation slows to its 2% target. The 2-year U.S. bond rose to more than 3.4%, reflecting the 325bp rate hike expectation for the whole year. The corresponding rate hike rhythm is 75bp in July, 50bp in September and November, and 25bp in December. The two indicators that most directly affect interest rate hikes are: inflation CPI (mainly oil prices) and unemployment rate. Next, we need to pay attention to the unemployment rate on July 8 and the CPI on July 13. The plunge in commodities may indicate that the current round of inflation has peaked and dropped.
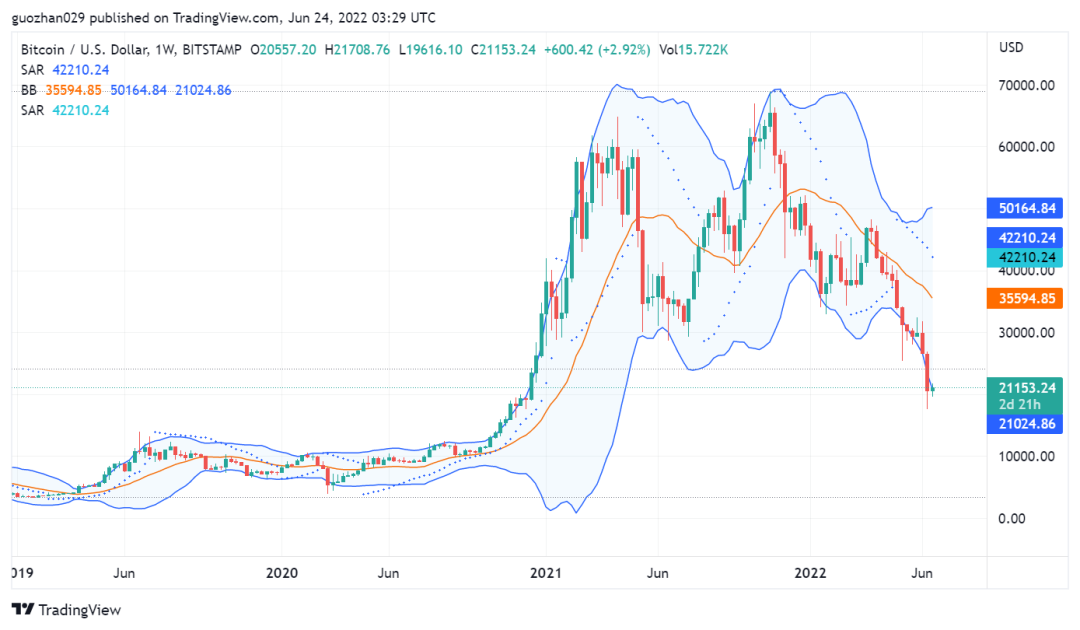
There may be a wave of subsequent declines in US stocks due to worsening earnings expectations. BTC followed the decline of U.S. stocks and fell below the peak of the previous bull market for the first time in history. After the sharp drop, there may be a remedial consolidation.
On-chain indicators
The domino effect of the bear market has advanced to a new stage. The amount of BTC flowing into exchanges this week is at its highest level since 2018. Long-term holders of more than 1 year lost 178,000 BTC, equivalent to 1.3% of their total holdings. This reflects a great deal of panic, even among strong holders. Profitable currency holding addresses dropped to only 49%, and the lowest point of the historical bear market was between 40-45%.

Stablecoins continue to flow out. USDT has dropped by 15 billion from the historical high on May 11 to the present; USDC has increased by 7.1 billion from the low point on May 11, and the top Stablecoin has decreased by 2% on a daily basis. The BTC/ETH million-level buying and selling transaction matching spread on the centralized trading platform also expanded from 0.1% to 0.6%. With the withdrawal of large funds, the liquidity crisis continues.

BTC long-term market indicators
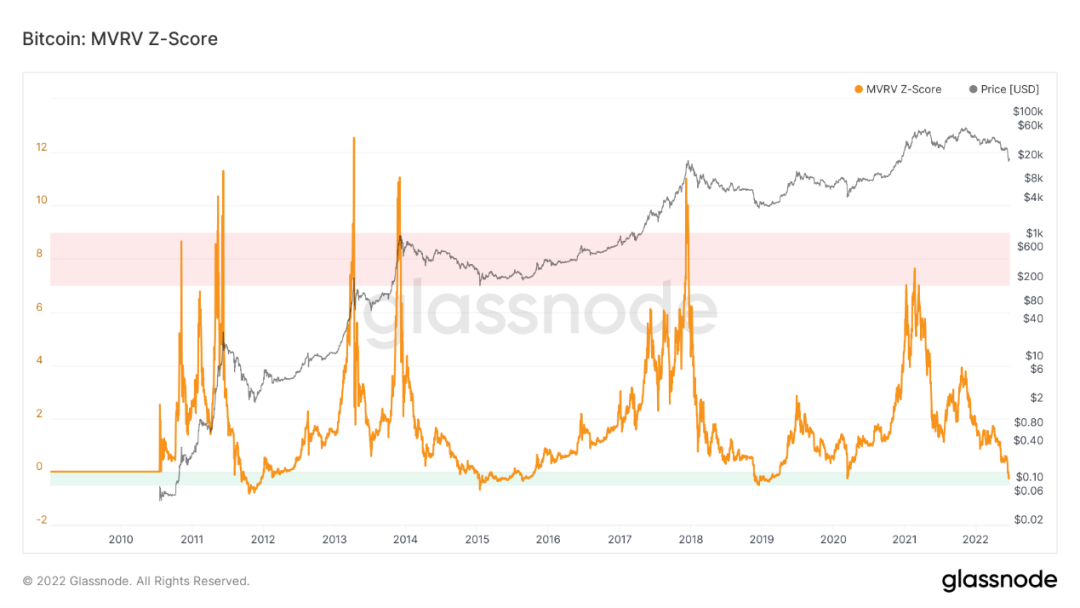
The long-term trend indicator MVRV-ZScore is based on the total market cost and reflects The overall profitability of the market. When the indicator is greater than 6, it is the top interval; when the indicator is less than 2, it is the bottom interval. The current index is -0.16, which has touched the green range of the historical bottom.
BTC short-term market indicators
< br>
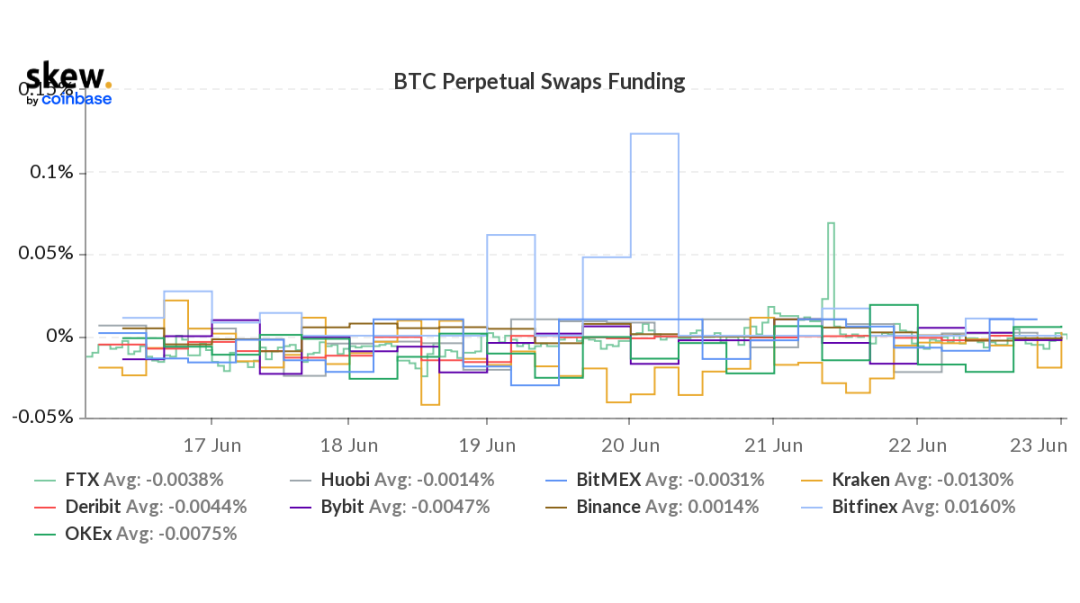
Futures funding rate: The funding rate has remained negative in recent days. The fee rate is 0.05-0.1%, and there are more long leverages, which is the short-term top of the market; the fee rate is -0.1-0%, and the short leverage is more, which is the short-term bottom of the market. It has maintained a large negative rate for several consecutive days, exceeding the local bottom of previous bear markets.
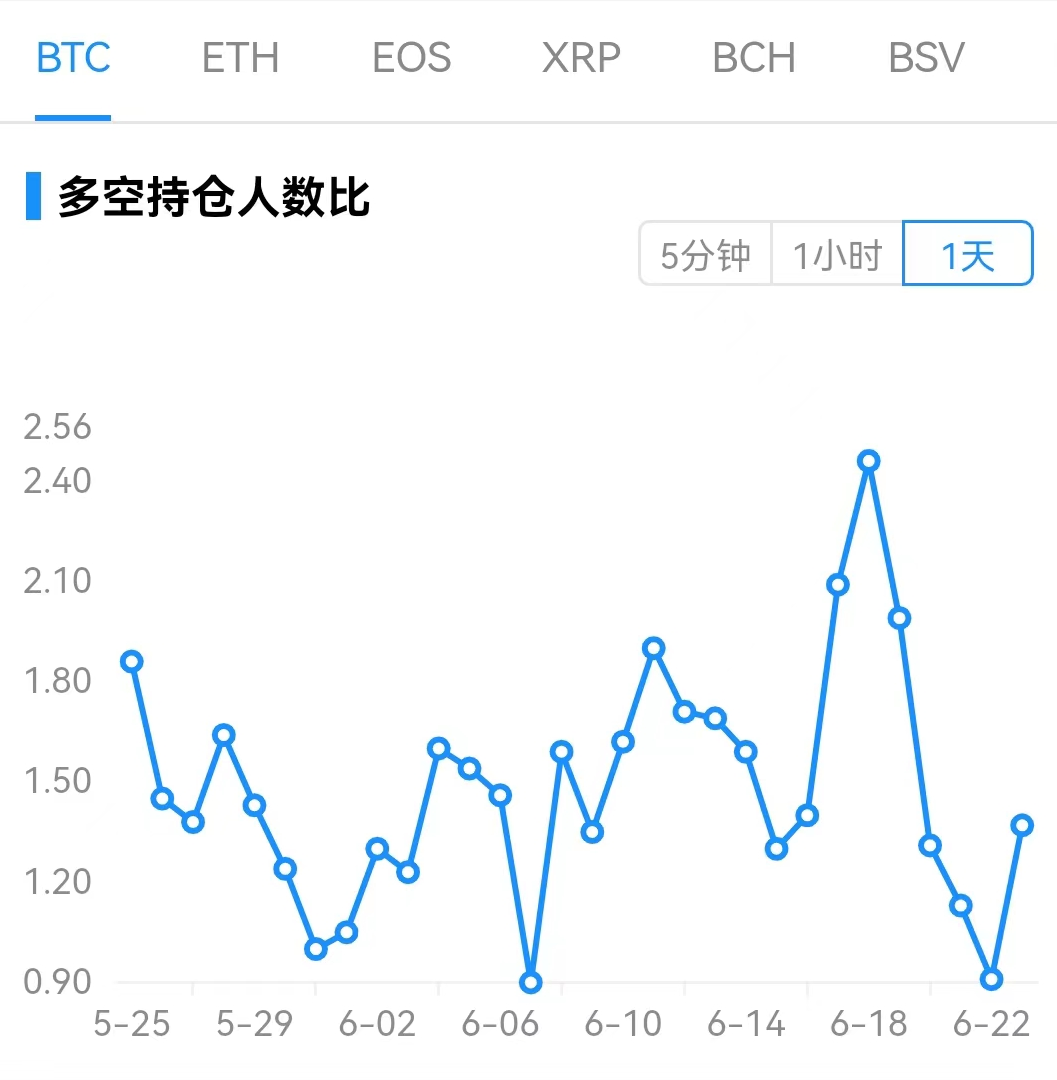
Futures long-short ratio: 1.4, relatively normal range. The long-short ratio data fluctuates greatly, and the reference significance has been weakened.
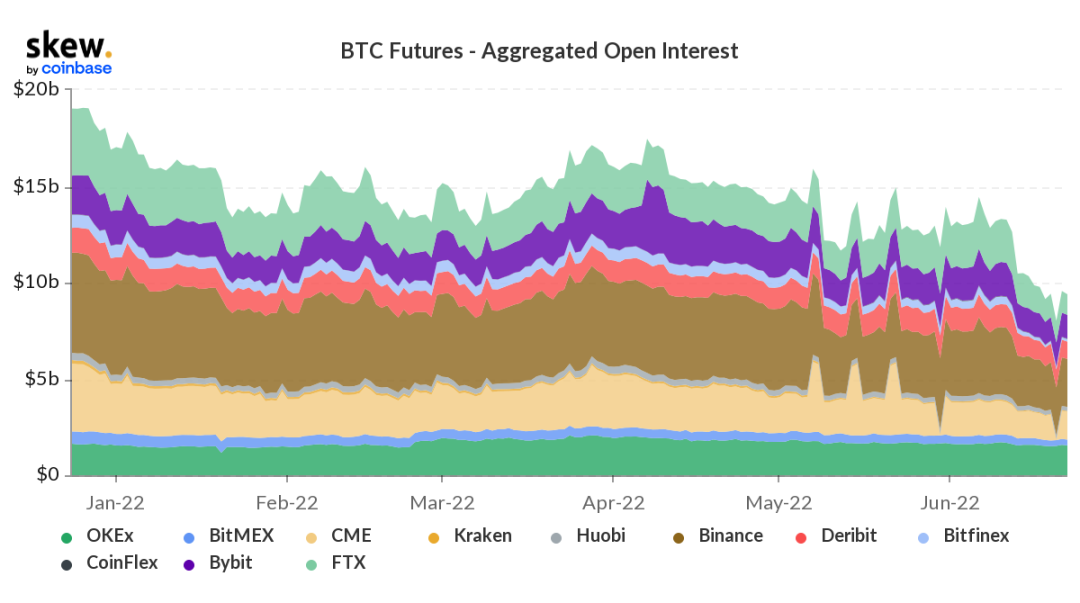
Contract open interest: overall fell sharply this week, but during the There was an obvious rebound in the market, leading to both long and short bursts, and slightly more long positions.
BTC trend analysis
This week, BTC fell back from the large-scale deleveraging event and fell below the historical high of 20,000 set in 2017. Investors' beliefs have been greatly tested. The spot trading volume is at a historical level, reaching the end of 2018, close to the 312 event. The long-term trend of BTC is still downward, but as the liquidation of several large institutions comes to an end, the market may fluctuate briefly after the exhaustion of short positions.
Top 100 plate rises and falls
BTC fell sharply by 10% this week, and the market fell across the board. This week, due to the liquidity crisis of large institutions, BTC and ETH, which are commonly used as collateral for lending/leveraged positions, were liquidated sharply, and their performance lagged behind many altcoins. In DeFi, SNX, MKR, LINK, UNI, and 1INCH have all outperformed ETH over the past 60 days.

Market data
Total lockup volume of the public chain

There was a slight rebound in the market this week, compared with the overall TVL increase of 0.53B last week, the increase rate 0.71%.
Proportion of TVL of each public chain
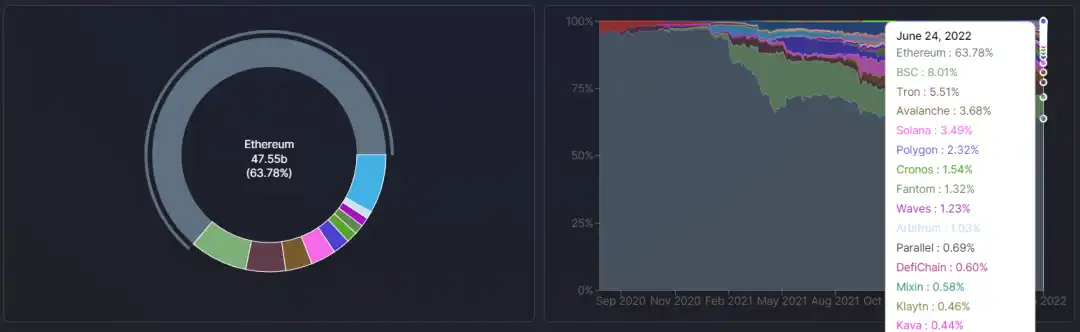
The proportion of ETH dropped from 64.11% to 63.78%, showing that the TVL of the ETH chain was resilient when the market fell, and the proportion of ETH decreased when the market rebounded. The proportion of each public chain changed this week smaller.
Status of locked-up amount of each chain protocol
ETH locked-up amount Situation

BSC

Tron

< b>Solana lock-up volume

< /p>
Avalanche's locked position

< /p>
Polygon Lockup Amount

< /p>
Fantom Lockup Status

< /p>
Summary of this week's agreement
Under the current market background, the overall performance of Defi is still not good. Mainly down, the Solana chain was relatively active this week, and multiple DEXs showed a certain increase, while the Fantom chain saw a decline in liquidity.
ETH Gas fee history
< img _width="677px" src="https://image.blockbeats.cn/upload/2022-06-27/8e79249667ebc7c32024097097efb82fe8ece1fc.png?x-oss-process=image/quality,q_50/format,webp" alt=" Picture">
The current on-chain transfer fee is about $1.23, the Uniswap transaction fee is about $4.19, and the Opesea transaction fee About $4.59, the long-term low gas fee will seriously reduce the demand for L2, and the gas will continue to be low in the short term.
NFT Market Data Change
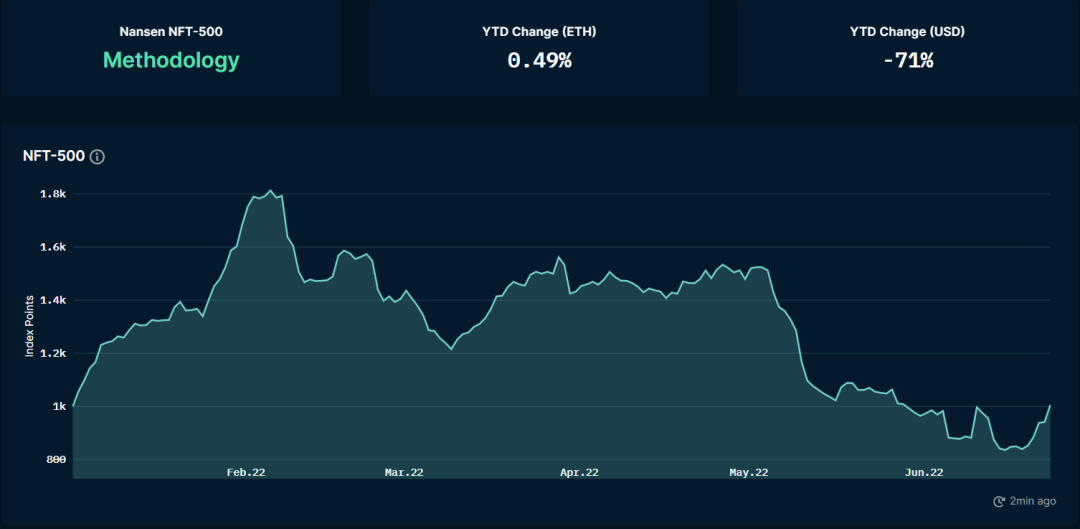
NFT Index Market Value
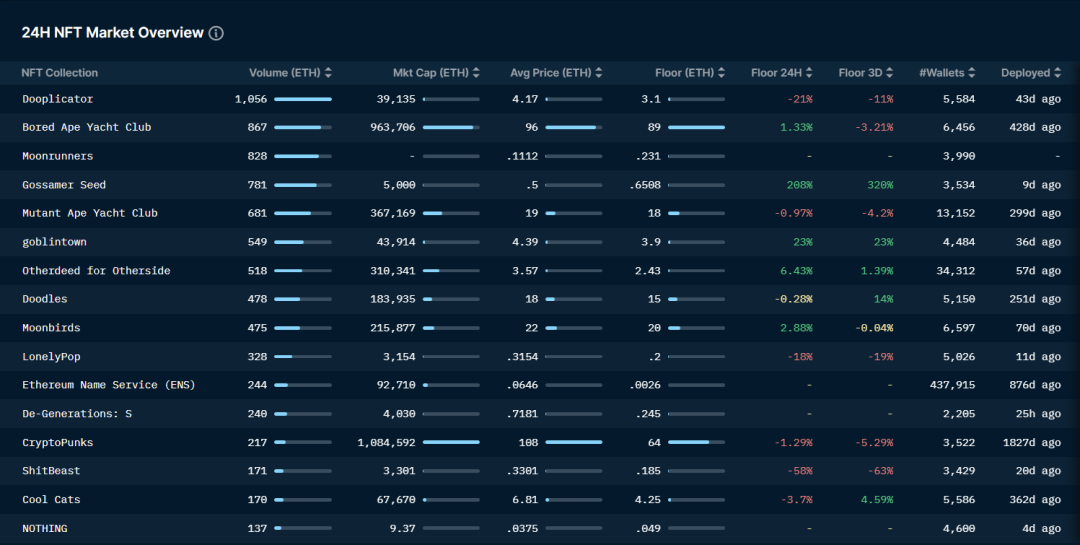
NFT market transaction overview
NFT" Smart Money" Purchase Sort

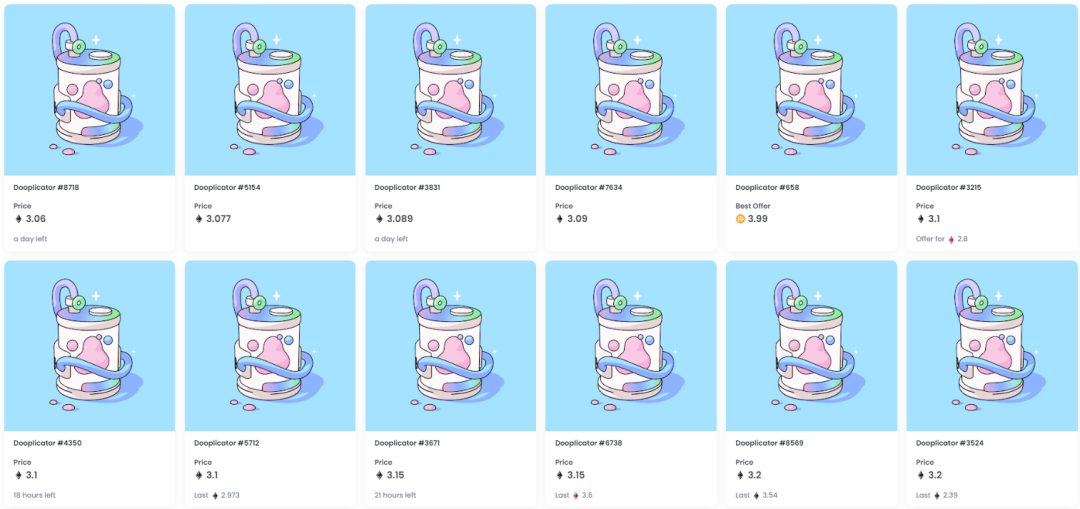
Since the NFT market fell on May 1 this week, it has seen the biggest rebound in a single week. The overall NFT market value has risen by more than 15%, but the overall trading volume There has not been a significant increase. The project worthy of attention this week is Dooplicator, which is the second phase project of the Doodles team. It is still in a blind box state. The current floor price is about 3 ETH. Compared with the floor price of Doodles of 14 ETH, There is still much room for growth.
The latest project financing situation
< br>

Original link
Welcome to join the official BlockBeats community:
Telegram Subscription Group: https://t.me/theblockbeats
Telegram Discussion Group: https://t.me/BlockBeats_App
Official Twitter Account: https://twitter.com/BlockBeatsAsia

 Related Articles