Founder of Pylon Holding: Why do you want to hold Bitcoin in a macro interpretation?
Original author: Preston Pysh, founder of Pylon Holding
Original compilation: 0x137
Pylon Holding is the world's leading financial research and investment institution. This article is based on the views of Pylon Holding founder Preston Pysh on his personal social media platform. Its translation is as follows:
Why is the stock market trending like the chart below since 2009 when everything feels like the world is falling apart?
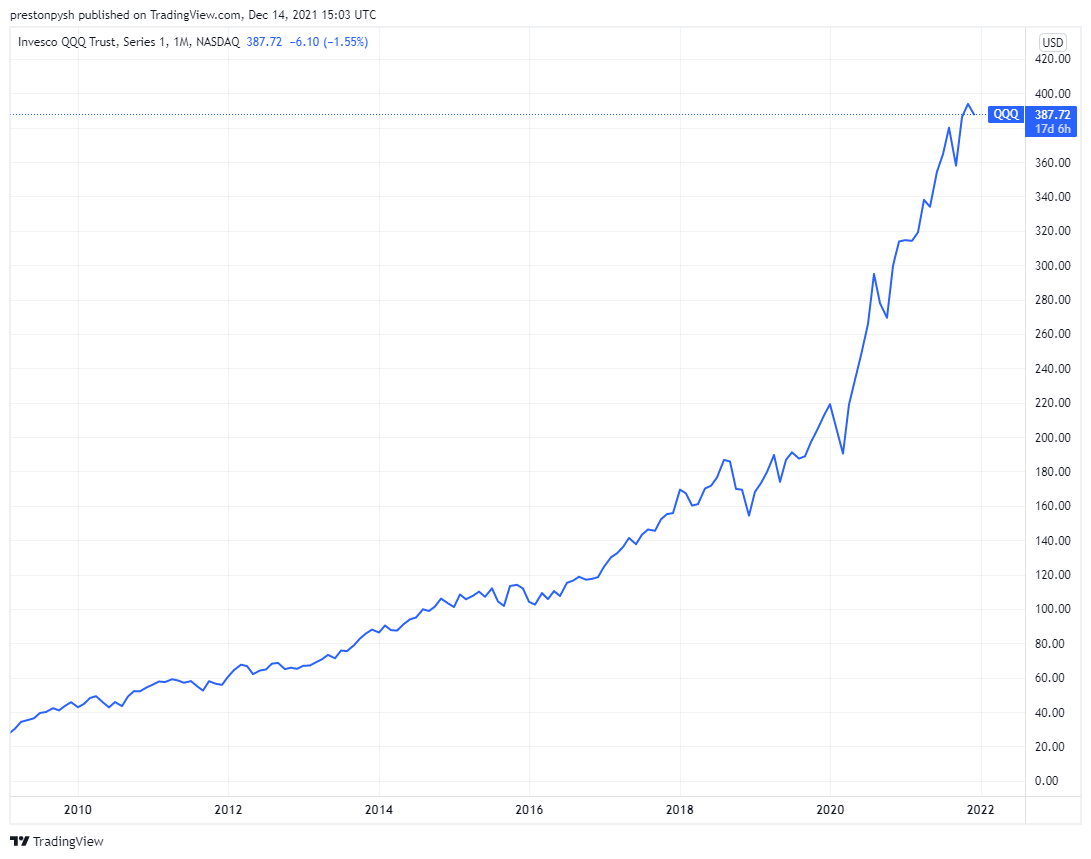
Here are some interesting diagrams to help you understand why what you see is not what you get.
Let's first look at how the world's major stock indexes have recovered since 2009. They are shown below, in the order they appear on the diagram:
India 638%
United States 533%
Japan 275%
Korea 181%
Europe 172%
Canada 155%
Hong Kong, China 84%
China 75%

Of course, these are different currencies and need to be standardized with a common currency (USD) . Below is the same chart, but with each index in USD:
United States 533%
India 396%
South Korea 264%
Japan 224%
Canada 153%
Europe 142%
China 89%
Hong Kong, China 83%

All indicators are now normalized in dollars, but if the dollars themselves are Does it change over time? Let's look at what has happened to the M2 money supply (currency depreciation) since 2009.
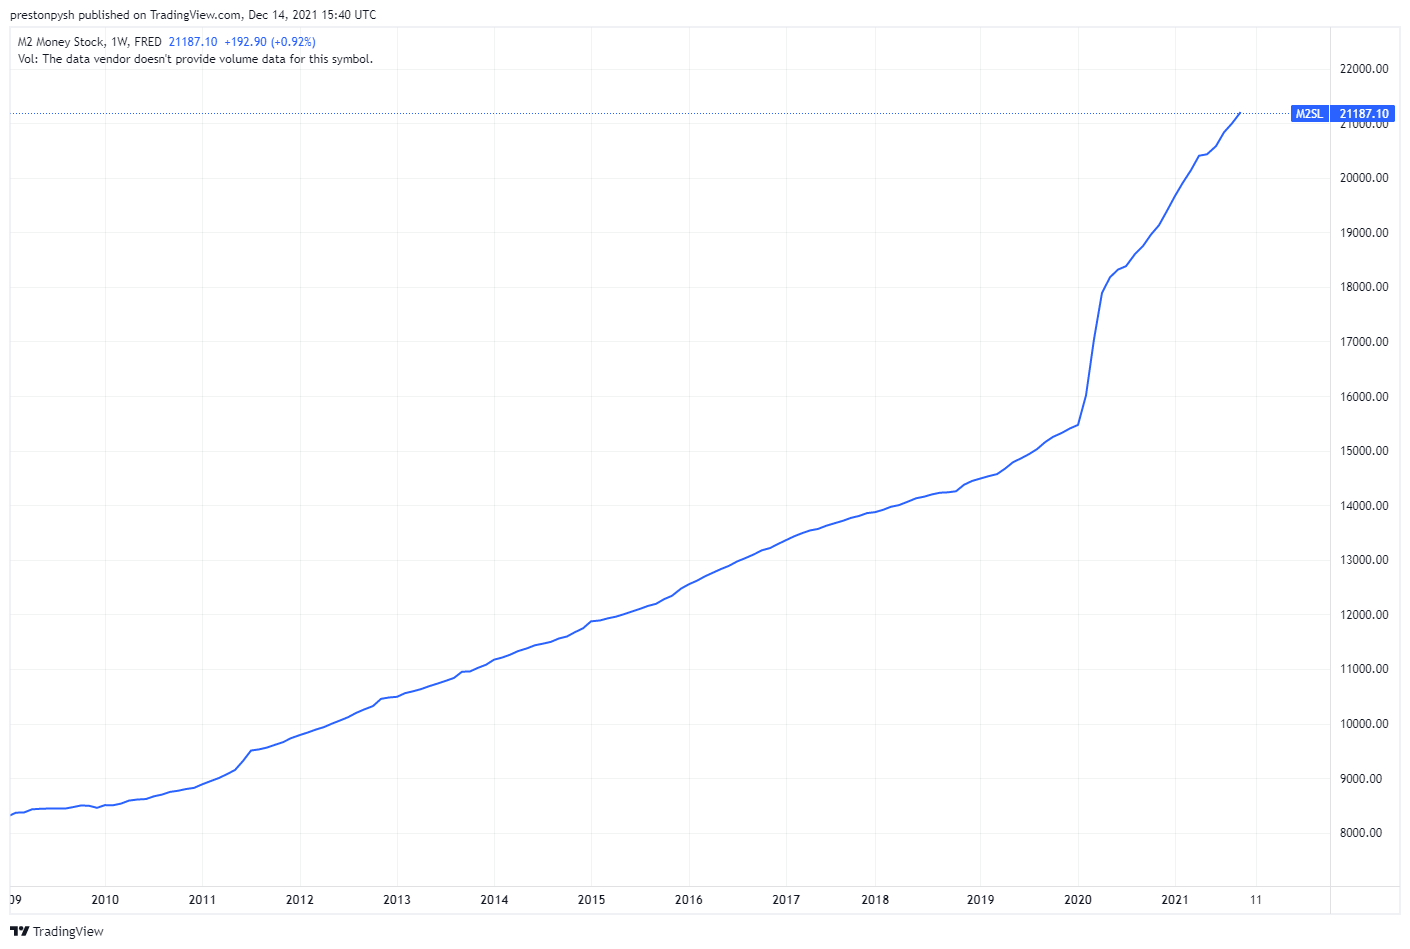
When we add M2 to the correction indicator, the global stock index shows the following trends:
United States 139%
India 92%
Japan 19%
South Korea 19%
Canada -6%
Europe -10%
Hong Kong, China -27%
China-31%

But through this chart, it is still difficult to see which stock indexes are driving market. We can market-weight each stock index so that it represents its share of the overall economy. The figure below shows the proportion of stock market assets in 2018, including the proportion of each stock index.

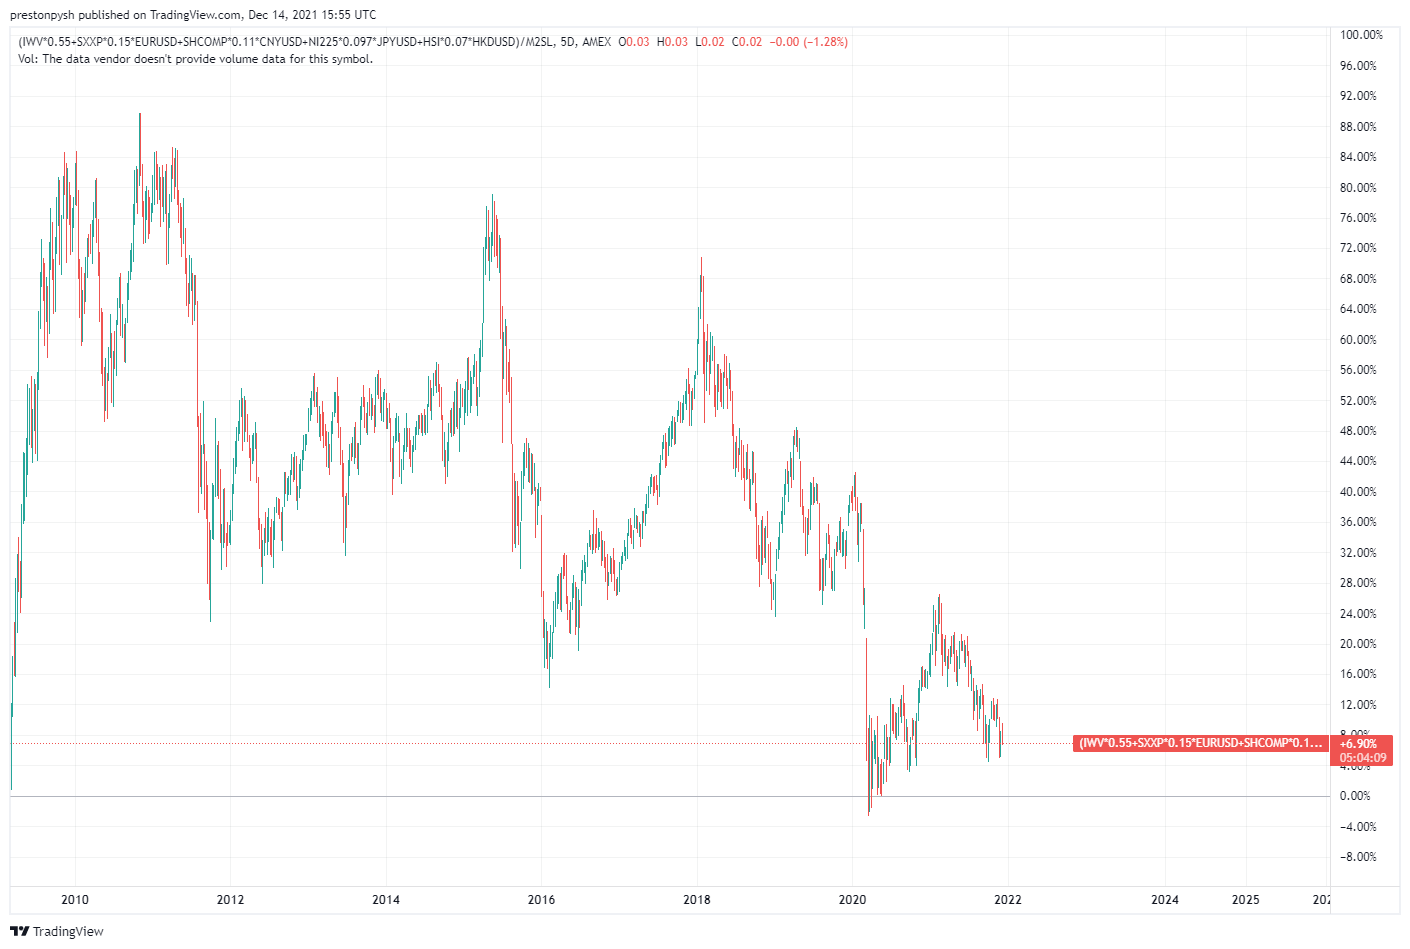
The following figure shows the top 80% of the world Stock indices are combined into one index, markets are weighted according to the size they represent in the global economy (both denominated in dollars), and as you can see, global markets are up 171%.
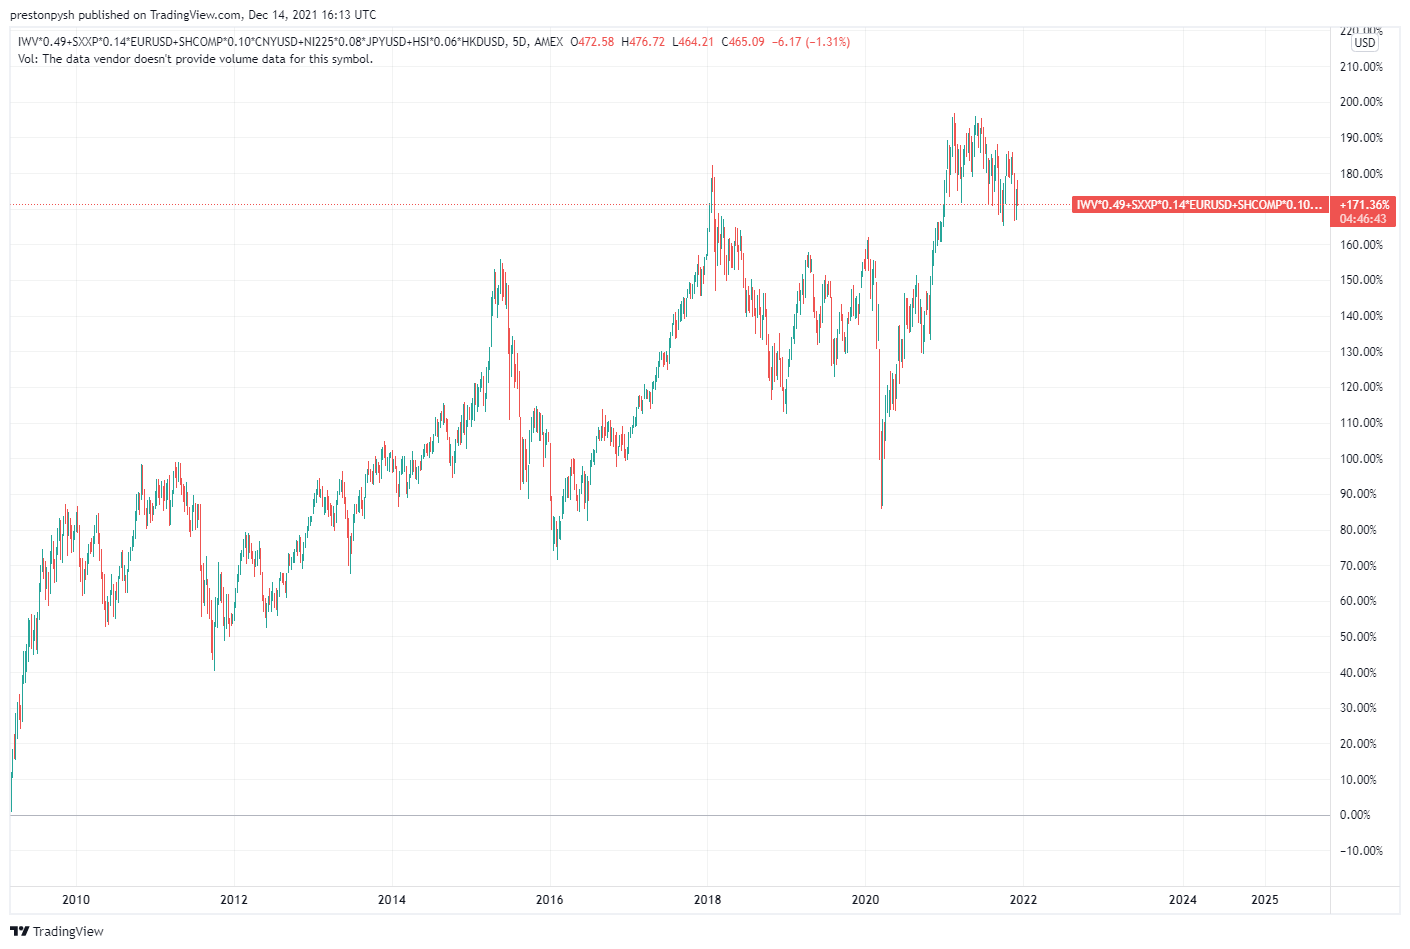
Similarly, we correct this combined global index with M2 money supply growth, and the result is: global markets have only rose 6.9%.
What does this mean?
This shows that central banks are trying to keep the global economy running as long as possible through constant manipulation of the money supply. But these operations are wiping out the middle class and creating immeasurable systemic risks for the global economy.
These operations are pushing more and more market capital into the hands of a few while leaving others in debt and unable to own anything that generates free cash flow . As a result of these manipulative policies, prices of all labor-intensive services have skyrocketed.

What will such a big environment bring ? Extreme, unpredictable volatility. Forecasting increasingly severe credit losses is like forecasting an avalanche of immense complexity. I hold BTC precisely because it is virtually impossible to manipulate or control.
Remember, it's not about fiat earnings on paper, it's about protecting and growing your purchasing power. I can say this with certainty: central bank manipulation will continue to accelerate and devaluation of French currencies will continue to worsen. We should plan accordingly for this.
Welcome to join the official BlockBeats community:
Telegram Subscription Group: https://t.me/theblockbeats
Telegram Discussion Group: https://t.me/BlockBeats_App
Official Twitter Account: https://twitter.com/BlockBeatsAsia

 Related Articles