Crypto Industry's Epic Transformation: From Hype Narratives to Trading Real Assets
Original Title: "ArkStream Capital: When Binance Becomes 'Stockbinance,' Crypto Is Undergoing an Unprecedented Transformation"
Original Author: ArkStream
TL;DR
1. Repeated U.S.-Iran conflicts pushed oil prices higher, gasoline prices drove inflation expectations upward, and the Federal Reserve completed its first rate hike since 2023 in September.
2. Bitcoin moved in tandem with tech stocks represented by the Nasdaq, decoupled from gold, and oil prices and interest rates remain the primary variables affecting Bitcoin.
3. In a third quarter filled with bearish news, Bitcoin rose 42%, but capital entered Bitcoin primarily through ETFs, and the meme bull market is gone for good.
4. On Robinhood's and Circle's company chains, trading remains dominated by memes, and company chains have yet to introduce new asset classes.
5. This RWA bull market is mainly reflected in RWA perpetual contracts for stocks and other assets, which represent the primary source of incremental trading volume for the crypto industry in 2026.
6. Tokens with protocol revenue and continuous buybacks significantly outperformed other altcoins in the third quarter, and the sustainability of protocol revenue will become a more important screening criterion.
Preface
In the third quarter of 2026, the Federal Reserve completed its first rate hike since 2023 by a vote of 12 to 0, the U.S. Senate rejected the procedural motion on the CLARITY Act by a vote of 49 to 50, Brent crude twice rose above $100 and closed at $108.50 on September 28; the U.S. 10-year Treasury yield rose to 5.25% on September 28, the highest since June 2007. Yet in a third quarter marked by a steady stream of bearish developments, the cryptocurrency market posted substantial gains. During the same period, Bitcoin rebounded from a 21-month low of about $57,800 in early July to $87,397 on September 21, a gain of about 51%, before falling back to around $83,000 on September 28; cumulative year-to-date flows into U.S. spot Bitcoin ETFs turned from net outflows to net inflows in September; the Nasdaq Composite closed at 27,122.09 on September 21, its first record close since June.
We will discuss this in three parts: how the U.S.-Iran conflict transmitted through oil prices, inflation, and interest rates to financial markets, and how stocks, gold, and Bitcoin performed within that; the crypto market's recovery in the third quarter, and what assets are actually being traded on the company chains launched by Robinhood and Circle; and Crypto's path toward RWA integration.
Macro Environment: From Oil Prices to Interest Rates
The shifts in the macro environment this quarter can be viewed along a single chain: repeated escalation of the U.S.-Iran conflict → oil prices rise again → gasoline prices push up inflation and inflation expectations → the Fed hikes rates, Treasury yields climb → financial assets such as stocks, gold, and Bitcoin fluctuate in price.
In July and September, the U.S.-Iran conflict escalated twice, with Brent crude rising from $73.74 at the end of June to $108.35 by mid-September; in August, gasoline prices rose 27.4% year-over-year, headline CPI rose 0.4% month-over-month, and consumers' one-year inflation expectations climbed to 4.6%; the Fed hiked rates by 25 basis points in September, with 16 of the 19 officials participating in rate projections (12 of whom hold voting rights) expecting another hike within the year; the 10-year Treasury yield rose to 5.25% on September 28, and the 30-year rose to 5.56% on September 29. Each time oil prices pulled back, stocks and Bitcoin rose accordingly; each time the conflict escalated, all three asset classes came under pressure together. On September 21, oil prices fell below $100, and the Nasdaq and Bitcoin hit stage highs on the same day; on September 26, Trump rejected Iran's plan to reopen the strait, and on September 28, oil prices returned to $108, with the Nasdaq, gold, and Bitcoin all falling simultaneously. We will break down each link in this chain one by one to see how the macro environment ultimately affects financial markets and cryptocurrencies.
U.S.-Iran Conflict, Oil Prices, and Inflation
At the end of the second quarter, U.S.-Iran negotiations advanced, oil tankers resumed passage through the Strait of Hormuz, and Brent crude closed at $73.74 on June 24, the lowest close since the conflict erupted on February 28. In the third quarter, the conflict escalated repeatedly, and oil prices surged repeatedly in tandem.
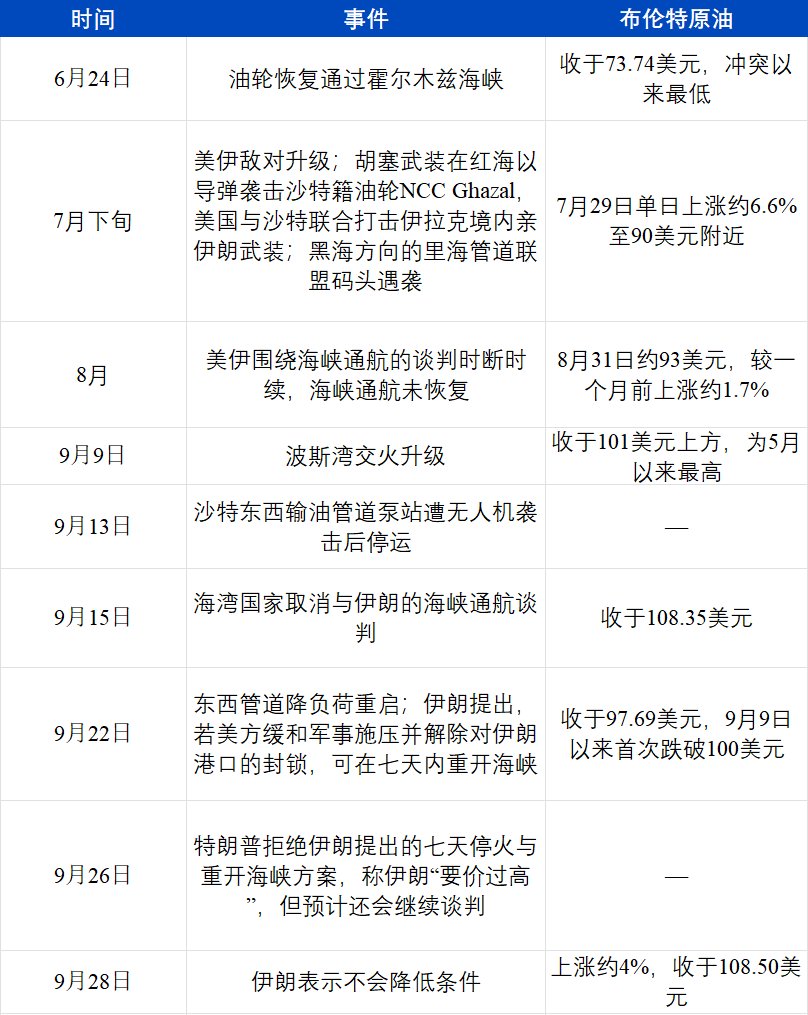
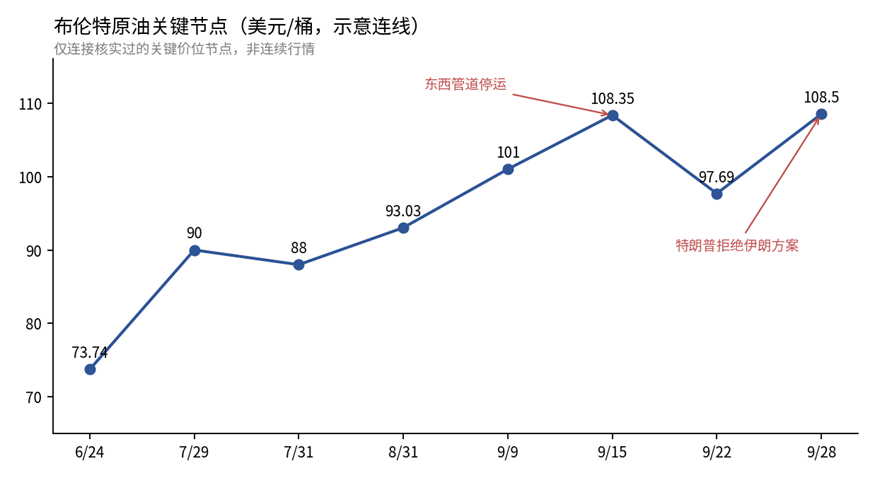
Key Brent Crude Milestones in Q3 2026 (Compiled by ArkStream)
Oil price increases were first reflected in gasoline prices. In August, U.S. gasoline prices rose 3.9% month-over-month and 27.4% year-over-year, contributing more than one-third of the month's headline CPI increase; the energy sub-index rose 2.1% month-over-month.
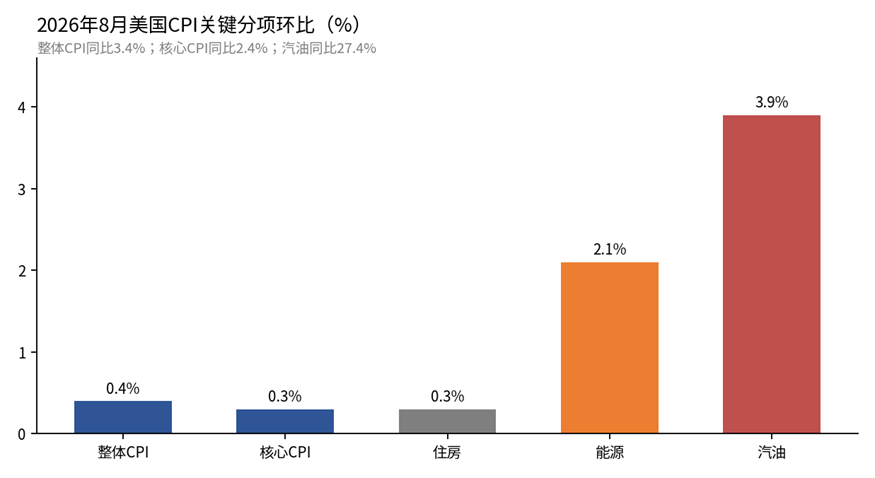
August 2026 U.S. CPI Key Components MoM (U.S. Bureau of Labor Statistics, compiled by ArkStream)
Employment data also dealt a massive shock to the market: August nonfarm payrolls added 162,000 jobs, versus a consensus estimate of only about 53,000, the strongest single-month performance since March, with the unemployment rate holding at 4.1% and roughly 7 million unemployed.
As the nonfarm payroll data was released, inflation expectations had already been priced in by financial markets. The University of Michigan's September final reading showed consumers' one-year inflation expectations at 4.6%, the highest since June; five-year inflation expectations rose from 3.3% for three consecutive months to 3.4%. The consumer sentiment index fell to 48.1, with respondents repeatedly citing rising fuel prices as a source of pressure. Inflation expectations in the bond market were relatively stable, with the 10-year breakeven inflation rate at 2.33% in September, well below the 3.02% peak in April 2022; households and bond investors diverged in their assessments of inflation.
Rate Hikes and Rate Hike Expectations
After the inflation and employment data were released, the Federal Reserve completed a rate hike in September.
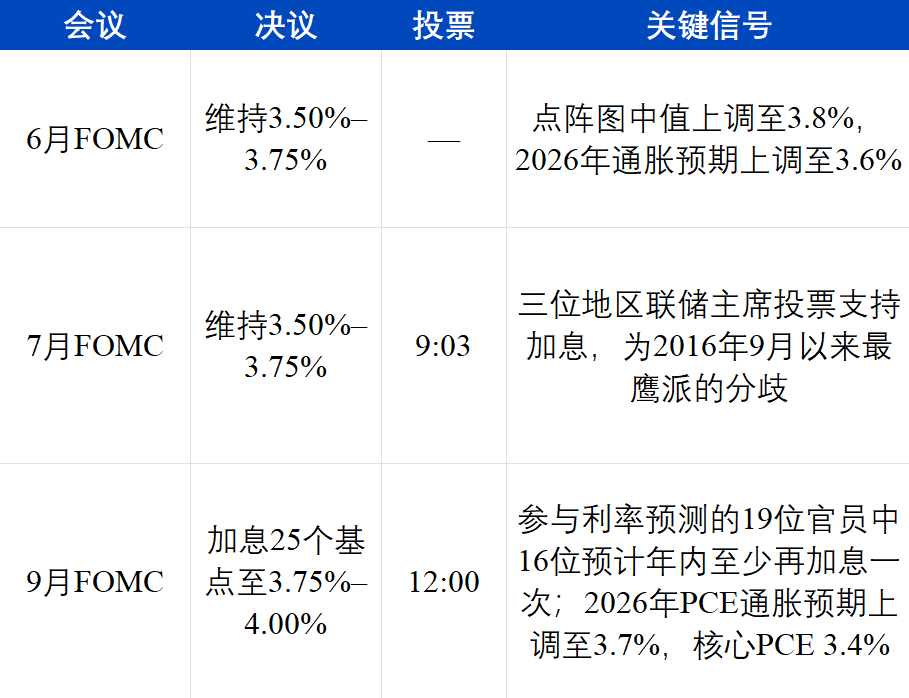
The Fed's stance gradually became clearer across three meetings. The July statement described economic activity as "expanding at a solid pace," with inflation "still somewhat elevated relative to the 2% goal," attributing it to energy-driven supply shocks; the July meeting minutes showed officials believed further rate hikes would be necessary if inflation did not cool. The September resolution statement read: "Inflation remains elevated, and today's policy action will support a more timely return of inflation to the 2% goal. "With the economy expanding, unemployment around 4.1%, and inflation above target, the Fed ended its wait-and-see approach on that basis.
The Fed's outlook on future inflation was equally pessimistic. Its September economic projections raised 2026 PCE inflation from 3.6% to 3.7% and pushed the timeline for inflation returning to 2% out to 2029; 16 officials expected at least one more rate hike within the year, with 4 expecting two more, and most officials projected rates would still be above current levels by the end of 2027. Before the September meeting, a rate hike was largely priced in by the market, and post-decision market volatility stemmed mainly from this set of projections: interest rates above 4% could persist through 2027. The market is following suit: on September 28, CME FedWatch showed roughly a 94% probability of at least one more rate hike before year-end, and about a 70% probability of a hike in October.
ArkStream Capital believes that the September rate hike confirmed our judgment in the second quarter: this round of inflation is mainly driven by supply factors such as oil prices. Rate hikes cannot make the strait navigable, and the duration of high interest rates is likely to be prolonged.
Financial Markets: US Stocks, Gold, and Bitcoin
Changes in interest rates and oil prices ultimately landed on the prices of three types of assets.
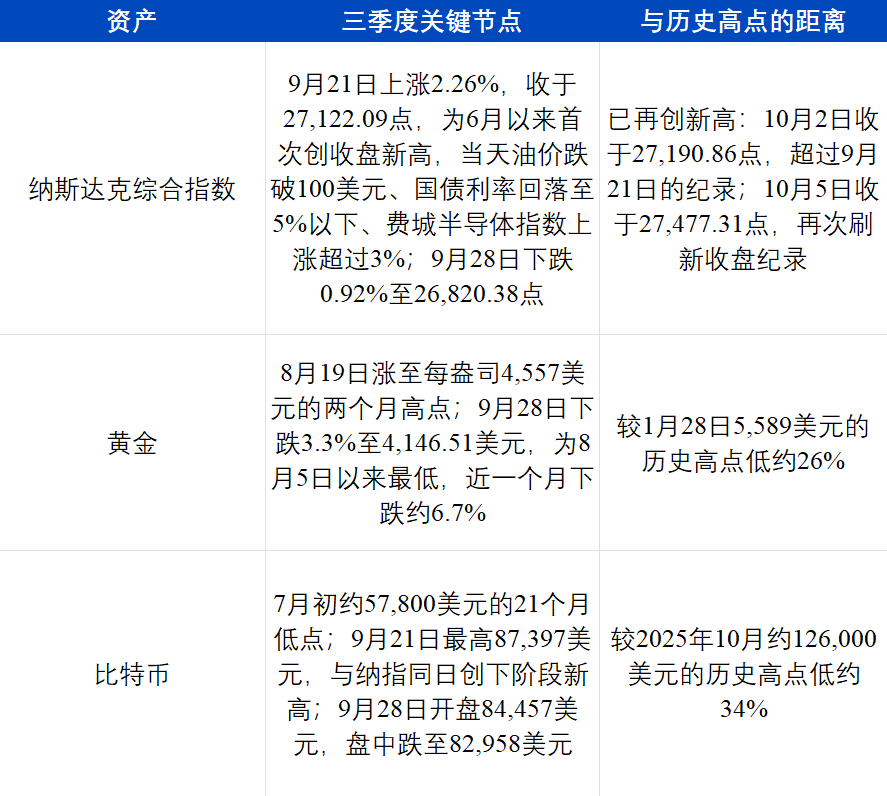
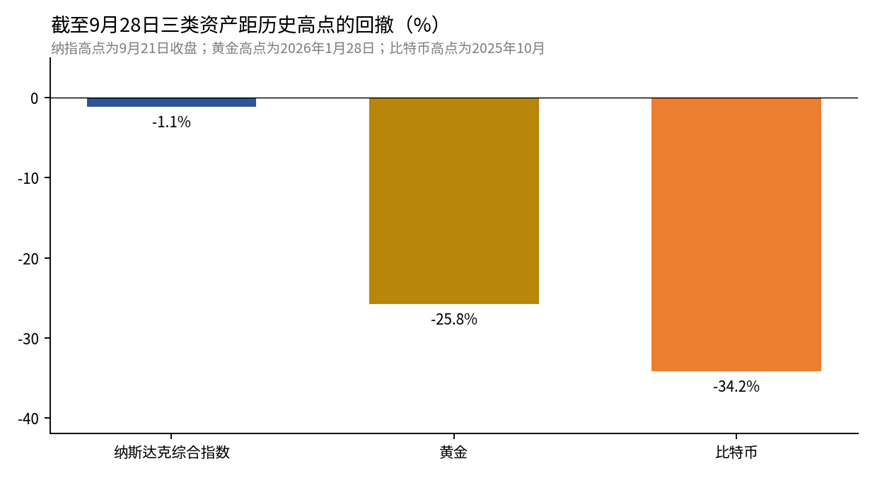
Drawdowns of the Nasdaq, gold, and Bitcoin from historical highs as of September 28, 2026 (compiled by ArkStream)
The three types of assets did not move the same way in September. Bitcoin and the Nasdaq hit stage highs on the same day, September 21, and then fell together on September 28; gold weakened throughout September. The Nasdaq's rise on September 21 was driven by chip and AI stocks: Meta rose about 11% that day, AMD and Intel rose 8% to 11%, and AMD's market capitalization rose to $1 trillion. On September 28, the S&P 500 fell 0.77% to 7,683.69 points, the Nasdaq fell 0.92%, and the Dow Jones fell 0.67%, while Brent crude rose about 4% that day. This is a phenomenon that has repeatedly appeared over the past year: Bitcoin has decoupled from gold and moved more closely with risk assets represented by the Nasdaq.
In terms of price, gold hit a historical high of $5,589 on January 28, 2026. Bitcoin had already fallen from its October 2025 high over the same period, and then declined all the way to about $57,800 in early July, with a maximum drawdown of about 54%. Their rolling correlation coefficient over the past year was -0.17, and it once fell to -0.88 in the spring of this year; during the same period, Bitcoin's correlation coefficient with US stocks rose from -0.68 to +0.72 within two weeks. August was an exception: after the Treasury expanded repurchases, discussion of dollar depreciation heated up, and Bitcoin and gold rose together for a time. Grayscale's 90-day correlation coefficient rose from close to 0 to about 0.5, while Bitcoin's 90-day correlation coefficient with the Nasdaq fell from about 0.6 to 0.33. Entering September, gold fell, Bitcoin and the Nasdaq rose and fell in sync, and the two separated again. Glassnode's historical data shows that such brief correlation switches usually do not last long.
Bitcoin decoupled from gold and moved in tandem with the Nasdaq, and ArkStream believes there are four main reasons:
Different buyers. Gold's most stable buyers are central banks. In 2025, global official-sector gold purchases totaled 863.3 tonnes, more than double the annual average from 2010–2021, and this buying is price-insensitive; that same year, global gold ETF net inflows hit a record $89 billion. Bitcoin has no central bank buying, and new inflows mainly come from spot ETFs and institutional investors. U.S. spot Bitcoin ETF assets under management are about $108.4 billion, and their holders overlap heavily with tech stock investors.
Same reaction to interest rates. Neither Bitcoin nor growth tech stocks have stable cash dividends, and their valuations depend heavily on future expectations. When long-term rates rise, both come under pressure at the same time; when long-term rates fall, both benefit at the same time. On September 21, the Nasdaq and Bitcoin both hit stage highs at the same time, and the main changes that day were oil falling below $100 and Treasury yields pulling back; on September 28, both fell at the same time, and that day the 10-year Treasury yield rose to a 19-year high.
Gold's moves have other drivers. Gold also pays no interest, and rising rates and a stronger dollar suppress gold prices. The direct reason for gold's decline in late September was precisely Treasury yields rising to their highest since 2007 and the dollar approaching a two-month high; on the same day, silver fell about 4.7% to $61.27; but gold's medium- and long-term trend is also affected by central bank gold purchases and countries' foreign exchange reserve allocation, factors unrelated to Bitcoin.
Higher leverage. Open interest in Bitcoin futures and perpetual contracts was about $61.5 billion in September. Sharp price swings trigger cascading liquidations, amplifying gains and losses. This is closer to highly volatile tech stocks and very different from gold.
In summary, at the macro level this quarter can be boiled down to three points:
1. The U.S.-Iran conflict pushed oil prices higher, and oil prices pushed inflation expectations higher. As the U.S.-Iran conflict repeatedly escalated, Brent crude rose from $73.74 to above $108, gasoline prices rose 27.4% year over year, and one-year consumer inflation expectations rose to 4.6%.
2. The Fed raised rates and is preparing to raise again, with Treasury yields rising to a 19-year high. The policy rate rose to 3.75%–4.00%, and the market sees about a 94% probability of another rate hike before year-end; the 10-year Treasury yield rose to 5.25% on September 28, the highest since June 2007.
3. Bitcoin tracks the Nasdaq, decouples from gold. Bitcoin and the Nasdaq hit stage highs on the same day, September 21, and fell on the same day, September 28, while gold dropped about 6.7% over the past month.
Crypto Market and Corporate Chains
Amid mounting macroeconomic pressure this quarter, the crypto market bottomed out and rebounded in Q3. We will explore the shifting center of gravity in the crypto industry through the market's performance, fund flows reflected in trading platform data, and asset activity on the corporate chains launched by Robinhood and Circle.
Crypto Market Performance
In the first two quarters of 2026, the market remained in a bottoming and recovery phase, with thin trading and low leverage appetite. Entering August, market sentiment showed a clear inflection point. From August 18 to 19, three positive developments emerged in quick succession: First, U.S. Treasury Secretary Bessent announced that long-term Treasury buyback volumes would at least double, raising each operation from $2 billion to at least $4 billion, releasing liquidity expectations into the market; Second, the U.S. SEC published a draft of the "Regulation Crypto Assets" for public comment, proposing to allow crypto issuers to exempt fundraising of up to $5 million within four years, or up to $75 million annually, with disclosure requirements significantly lower than traditional securities offerings, opening a door for compliant issuance in the industry; Third, Trump convened crypto industry executives from Coinbase, Gemini, Ripple, Chainlink Labs and others at the White House for a final push to advance the CLARITY Act stalled in the Senate (though the CLARITY Act ultimately did not pass). The combination of these three developments triggered a violent short squeeze: Bitcoin rose nearly 8% in two days, briefly approaching $70,000; Ethereum rose 18% to 20% in two days, breaking through $2,250; liquidations within 24 hours totaled approximately $1.9 billion, the vast majority of which were short positions.
This "August 19 rally" drove the recovery for the entire quarter. Bitcoin rose 42% overall in Q3, closing the quarter at $83,161; due to the earlier deep decline, it was still down about 5.13% year-to-date, still approximately 34% below its all-time high of $126,000. Q3 was more of a restorative rebound to recoup lost ground.
But we see that capital remains concentrated in Bitcoin. During Bitcoin's nearly 25% rise in August, the Altcoin Season Index fell from about 67 in early August to 39 on August 25 (the "altcoin season" threshold is 75), with Bitcoin's market dominance holding at around 60% (CoinMarketCap). Cumulative year-to-date flows into U.S. spot Bitcoin ETFs briefly turned to a net outflow of approximately $5.8 billion in mid-July, before returning to net inflows in late September; total stablecoin market capitalization fell from approximately $320.6 billion in May to $306.6 billion on September 24 (DefiLlama). New capital is primarily entering Bitcoin through ETFs, while on-chain dollars have not increased.
US Stocks and Crypto Asset Trading
In our Q2 report, we proposed: The moment of maximum impact on Crypto has passed, and the market is slowly recovering. Following the same statistical methodology as Q2, we have updated the relevant data through Q3.
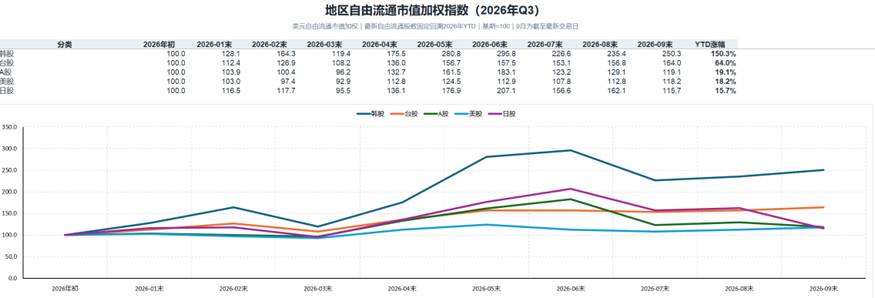
Q3 2026 Free-Float Market Cap Weighted Index of Major Regional Stock Markets (Compiled by ArkStream)
The rhythm of US stocks is highly consistent with Bitcoin: bottoming in July, recovering from August to September, and hitting a quarterly high in September. This aligns with the conclusion we reached in Part One: Bitcoin's trajectory is closer to that of tech stocks represented by the Nasdaq.
Data from Binance and Hyperliquid also confirms our judgment: After August, Crypto trading began to warm up.
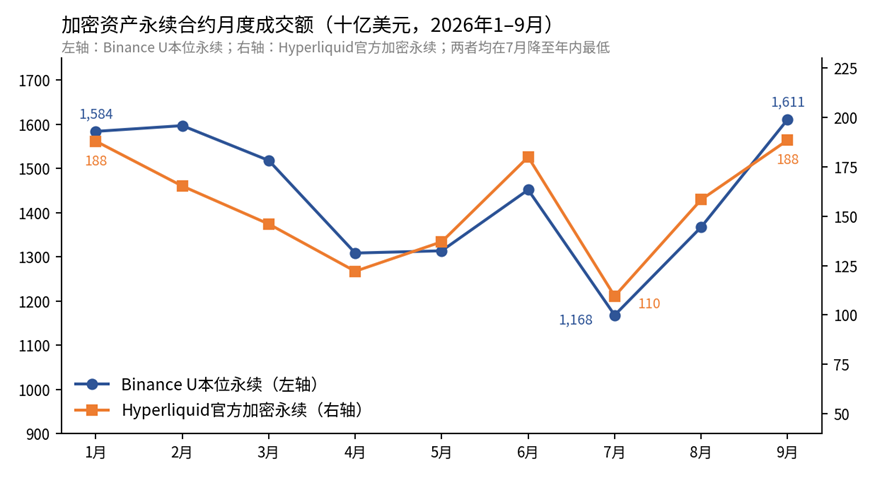
Monthly Trading Volume of Crypto Asset Perpetual Contracts (Binance, Hyperliquid, Compiled by ArkStream)
In July, Binance USDT-margined perpetual contract monthly trading volume dropped to $1.17 trillion, and Hyperliquid official crypto perpetuals fell to $109.5 billion, both hitting year-to-date lows; in September, the two rebounded to $1.61 trillion and $188.4 billion respectively, with Binance USDT-margined perpetuals already surpassing January levels. Binance spot trading volume recovered from $193.7 billion to $306.6 billion over the same period.
This recovery is more of a rebound from the July low. In Q3, Binance USDT-margined perpetuals recorded $4.15 trillion in trading volume, down about 12% from Q1, while spot trading declined about 28%; Hyperliquid official crypto perpetuals recorded $456.2 billion, down about 9% from Q1. During the same period, the incremental trading volume in the industry came from RWA perpetual contracts such as equities, which we will elaborate on in Part Three.
Robinhood Chain
Q3 Data
Robinhood Chain is an Ethereum Layer2 led by Robinhood, which launched its mainnet on July 1, 2026. Q3 was its first full quarter of operation. The core product on the chain is stock tokens, targeting users in over 120 countries outside the United States, supporting 7×24 trading, and can be deposited as collateral into lending pools.
As of September 30, Robinhood Chain's DEX daily trading volume was approximately $1.3 billion, with 394,000 active addresses; single-day revenue on September 4 reached $8.27 million, the highest of the quarter.
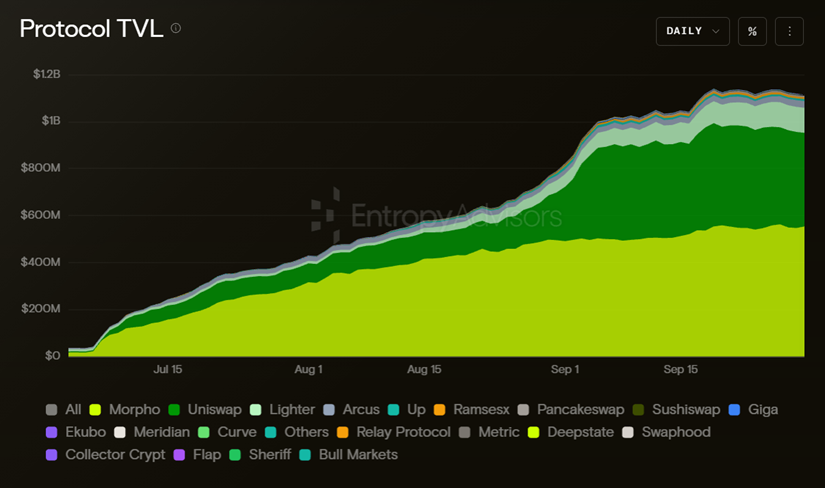
Robinhood Chain Protocol TVL (Entropy Advisors)
According to Entropy Advisors' statistics, Robinhood Chain's TVL reached $1.12 billion by the end of September, taking three months. For comparison, Hyperliquid's HyperEVM launched in February 2025 and took about 7 months to reach $190 million to $200 million in TVL by early September of that year; Coinbase's Base chain launched in August 2023 and took about 13 months to surpass $2 billion in September 2024.
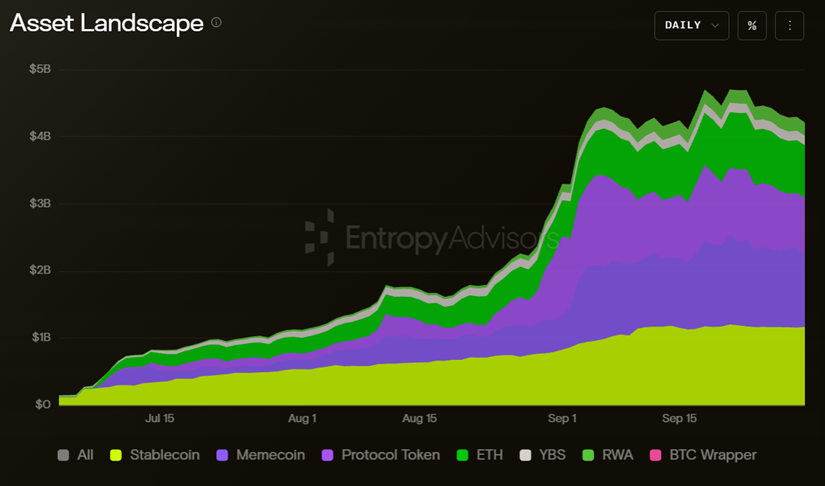
Robinhood Chain On-Chain Asset Composition (Entropy Advisors)
Total on-chain assets reached $4.21 billion by the end of September. The rapid growth in early September was mainly driven by meme tokens and protocol tokens; the absolute scale of stablecoins expanded in tandem, but their proportion was significantly diluted; the scale of RWA and yield-bearing stablecoins (YBS) increased slowly, with growth rates far below those of meme tokens and protocol tokens. This phase coincided with the trading and minting boom of the token issuance platform Pons, whose cumulative platform trading volume has reached the $4.5 billion level.
On-Chain Assets
Higher-market-cap assets are mainly meme tokens and token launch platform tokens.
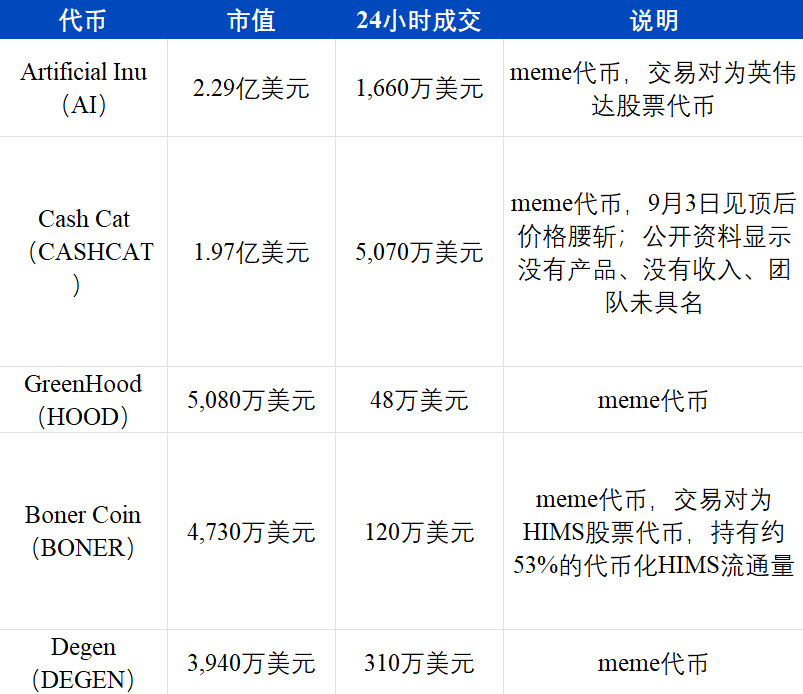
On September 29, the total market cap of meme tokens on Robinhood Chain was approximately $871 million, with about $146 million in 24-hour trading volume; the platform token PONS of the token launch platform Pons rose from $20 million in market cap to over $200 million in August. The No. 1 AI token by market cap and the No. 4 BONER both use stock tokens as trading pairs: the former is priced in tokenized Nvidia stock, while the latter has accumulated more than half of the tokenized HIMS stock; another meme token, A Meme Coin, uses tokenized AMC stock as its trading pair, borrowing the 2021 "meme stock" narrative.
Token launch platforms are the highest-revenue applications onchain. Pons issued about 25,000 new tokens in a single day on September 2, with cumulative fee revenue of $174.6 million; in the week ending September 24, Pons' fee revenue was about $19.5 million, down from $35 million the previous week.
Stock token trading volume is growing rapidly, but it is intertwined with meme trading. According to CoinDesk Research, Robinhood's tokenized stock trading volume in September was $6.57 billion, up 407% month-over-month, accounting for 42.0% of the entire market and making it the largest tokenized stock trading venue. According to Token Terminal, in the 30 days ending September 23, DEX trading volume of stock tokens on Robinhood Chain was $10.4 billion, accounting for about 19% of all-chain DEX trading volume during the same period, compared with about 8.7% in the first two months after launch. Among stock tokens, Nvidia had the highest trading volume, with cumulative volume of about $2.1 billion, while tokenized stocks of Apple, GameStop, and SpaceX were also relatively active. This methodology does not exclude trading pairs between meme tokens and stock tokens, and some meme trades priced in stock tokens, such as AI and BONER, are also counted in stock token trading volume.
Locked-asset data points in the opposite direction. According to DefiLlama, onchain tokenized assets are about $125 million (about $32 million under a narrower methodology), accounting for only about 6% of TVL, compared with nearly one-third at launch. Of the approximately $640 million in stablecoins onchain, USDG accounts for 54.8%, while USDe grew 167% within one month.
Circle and Arc
Circle's Arc public chain launched its mainnet on September 16. Almost every aspect of its design points to institutions: all 11 founding validators come from traditional finance and payment industries, including BlackRock, DTCC, Intercontinental Exchange, Visa, Mastercard, Standard Chartered, MoneyGram, SBI, Sumitomo Corporation, Global Payments, and Galaxy; transaction fees are paid in USDC; settlement is finalized within one second. In May, Circle completed the pre-sale of ARC tokens at a $3 billion valuation, raising $222 million, led by a16z, with participation from institutions such as BlackRock and Apollo.
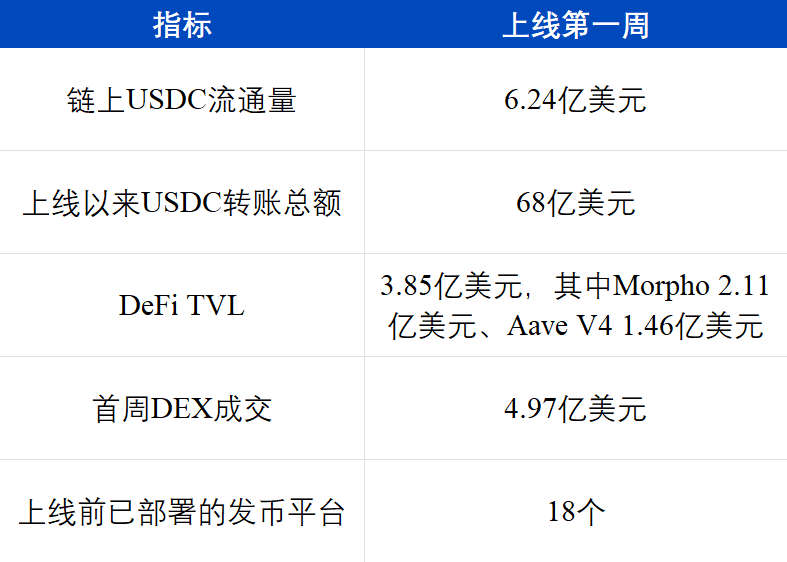
Capital is concentrated in lending protocols and USDC transfers. Of the $385 million in TVL, more than 90% is deposited in the two lending protocols Morpho and Aave; stablecoin transfers are currently the most dominant activity on the chain.
Although Circle hopes to further expand its institutional business through Arc, the trading side on Arc is still dominated by meme tokens. On September 19, the top five tokens by 24-hour trading volume on Arc were: token launch platform token ARGUS ($4.24 million), meme token BCAT ($4.11 million), a community meme token borrowing the USDC name ($1.79 million), token launch platform token TOLLY ($930,000), and meme token DUKE ($840,000). On an institutional public chain designed with USDC at its core, three of the top five most actively traded tokens are meme tokens. Among the first batch of ecosystem projects announced by Arc, the foreign exchange trading venue Hibachi is the only direction with a clear difference from existing public chain asset categories, and no public trading data is available yet.
ArkStream believes that corporate chains have not yet brought new asset classes. On Robinhood Chain, the higher market cap tokens are mainly meme and token launch platform tokens, and a considerable portion of stock token trading appears in the form of meme trading pairs; Arc's capital is concentrated in USDC lending, and trading is concentrated in meme and token launch platform tokens. If, after gas subsidies and trading incentives taper off, on-chain trading is still mainly meme-driven, the true value of corporate chains remains to be further tested.
The Path of Crypto's RWA Integration
Characteristics of Past Bull Markets
Before defining this RWA bull market, we want to first review previous bull markets.
The 2017–2018 ICO bull market was the first truly mass wealth-creation movement in Crypto history: projects raised funds publicly by issuing tokens, retail investors were the absolute main participants, and the core narrative was "decentralized disruptive innovation," with almost no barriers to entry and no regulatory constraints. Many projects in this bull market were using blockchain as a hammer looking for nails, creating "blockchain+" PowerPoint innovations across various sectors. Compared with the subsequent 2020–2021 cycle, the infrastructure in this cycle was still immature, and many projects had not yet reached the stage of being falsified. In hindsight, a considerable number of projects at the time were themselves scams.
The 2020–2021 DeFi+NFT bull market took place against the backdrop of globally accommodative monetary policy. The on-chain circulation scale of stablecoins such as USDT and USDC experienced explosive growth, becoming the core pipeline connecting the traditional dollar system with the on-chain world. After infrastructure matured, DeFi began to work, AMM as an innovation in the liquidity model greatly stimulated wealth effects, and the flywheel of liquidity mining drove prices up rapidly. People once again believed in "blockchain+," and Crypto's various innovative attempts reached a peak. Also because infrastructure had matured, various narratives began to face real tests. Tokenization and airdrop incentives lengthened the testing cycle, but most narratives were gradually falsified in the subsequent bear market, with the metaverse being the most typical example.
Aside from early memes like DOGE, the vast majority of memes can be traced back to SUSHI during the DeFi Summer period. Early memes were not pure; they belonged to "meme-type DeFi," using playful methods to increase the community virality of DeFi projects, while their operations still followed conventional project methods. At that time, a large number of animal-, plant-, and food-themed meme-type DeFi projects emerged. In the later stage of the bull market, the falsification of narratives and the climax of memes formed a resonance: crypto players discovered that so-called narratives were mostly packaging used by project teams to harvest, while memes that appeared to be fairly distributed instead gained market recognition. SHIB was the most iconic token among them. Its approach was completely opposite to the earlier meme-type DeFi: first do the meme, then use DeFi and public chain narratives to absorb implementation demand and selling pressure. Starting with SHIB, more and more meme projects adopted a pure meme approach. The basic language of memes in the post-DeFi era includes: fair launch, community identity, anti-VC narrative, celebrity catalysis, ultra-low unit price, and social media-driven reflexivity.
The 2024–2025 ETF/Meme bull market was marked by a fundamental shift in how capital entered the market. Spot ETFs, led by traditional asset management giants like BlackRock's IBIT, became SEC-regulated compliant capital entry points; DATs, represented by Strategy, indirectly held crypto assets like Bitcoin through publicly traded company stocks. In this bull market, we did not get the so-called altcoin bull run. Bitcoin received a massive influx of institutional capital, but this capital does not automatically rotate into altcoins. The altcoin market lost its broad-based rally characteristic and became a small-hotspot market: capital rapidly converges, creates wealth, and fades away in one new small hotspot after another, with each hotspot's average cycle lasting no more than 3 months. In the 2020–2021 bull market, capital overflowed sequentially from BTC to ETH to large-cap altcoins to altcoins in various sectors; in the 2024–2025 bull market, altcoin rallies became meme pumps followed by AI pumps, then AI pumps followed by meme pumps—strictly speaking, the vast majority of AI projects at the time were also AI-type memes.
During the falsification process of the 2023 bear market, altcoins entered the post-narrative era. Crypto players no longer believed in narratives and began to fully embrace memes. At the end of 2023, BONK and WIF kicked off the meme trend on Solana. Unlike SHIB in the previous cycle, WIF had almost no complex vision and no roadmap in the traditional sense. It proved that a meme relying purely on imagery, language, community consensus, and liquidity could also form a large-scale asset on Solana. This marked Solana's meme market transitioning from "ecosystem community coins" into the "attention asset" phase.
Pump.fun pushed the meme narrative to its peak and also marked the comprehensive end of Crypto's narrative cycle. Our judgment is: the once-frenzied Solana meme bull market may not recur, even though in Q3 a coin-stock meme on Robinhood's chain sparked a brief mini-surge. The main reason is that Pump.fun pushed meme coin issuance into the era of industrialized assembly lines, where meme supply far exceeds retail liquidity. The collapse of the perception of "fair meme distribution" will deal a blow to market confidence no less severe than the confidence collapse in VC coins back then. Something similar happened during the NFT bull market: Blur provided abundant liquidity for NFTs, and that liquidity precisely became the exit for concentrated NFT selling.
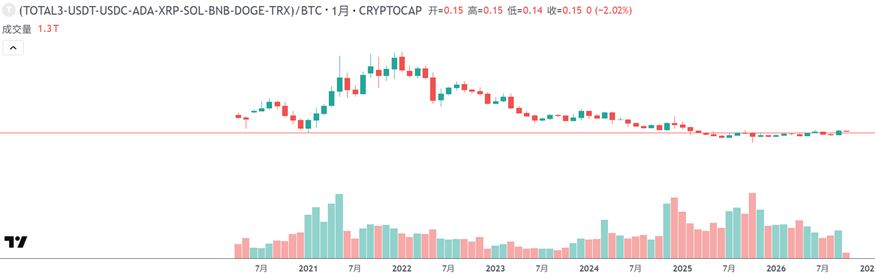
Small-cap altcoin/BTC exchange rate (TradingView)
But now, the meme bull market is gone for good. The exchange rates of small-cap altcoins against Bitcoin also confirm this: this round of gains has been concentrated mainly in Bitcoin. In 2024 and 2025, U.S. spot Bitcoin ETFs recorded full-year net inflows of $35.2 billion and $21.4 billion, respectively (CoinDesk), with new capital entering Bitcoin mainly through ETFs and not spreading to small-cap altcoins; data from the second part shows that the recovery in Q3 2026 was likewise concentrated in Bitcoin.
At this current time window, we still cannot define the true landmark moment of the Crypto RWA bull market, but 2026 is undoubtedly the inaugural year of Crypto RWA. If one word were to be used to define this bull market, the most fitting would be "convergence." In the past, Crypto played the role of a global testing ground for financial innovation; now it is integrating into real life and becoming part of it: on one hand, the global expansion of stablecoins; on the other, the tokenized liquidity transformation of equities.
The common feature of the previous three bull markets (ICO, DeFi/NFT, ETF/DAT) was "one-way penetration," with capital or narratives radiating mainly outward from the Crypto-native world, attracting attention and incremental capital from the traditional world. The most striking feature of this wave, with RWA as its core narrative, is "two-way convergence": on one side, leading centralized trading platforms represented by Binance, Coinbase, and Kraken are proactively extending outward, bringing traditional assets such as equities, commodities, and indices onto the chain; on the other side, internet brokers represented by Robinhood are moving in the opposite direction, building their own public chains, issuing tokens, and migrating the foundation of their securities brokerage business onto the chain.
Trading Platforms and RWA Perpetual Contracts
The most direct manifestation of this RWA bull market is the trading volume of RWA perpetual contracts such as equities on Binance and Hyperliquid, which is the primary source of incremental trading volume in the crypto industry in 2026.
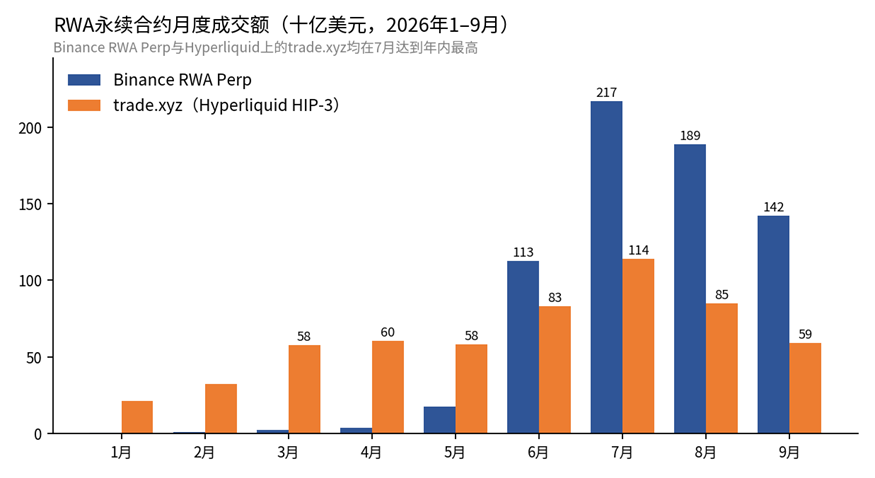
Monthly RWA perpetual contract trading volume (Binance, Hyperliquid, compiled by ArkStream)
Binance RWA Perp's monthly trading volume rose from $410 million in January to $216.9 billion in July, while trade.xyz under the HIP-3 framework on Hyperliquid reached $114.1 billion in July, both the highest levels of the year. After August, both declined, reaching $142 billion and $59.3 billion, respectively, in September, still significantly higher than in the second quarter. In the third quarter, Binance RWA Perp traded $547.7 billion, more than 4 times that of the second quarter, accounting for 11.7% of its total perpetual contract trading volume, compared with less than 0.1% in the first quarter.
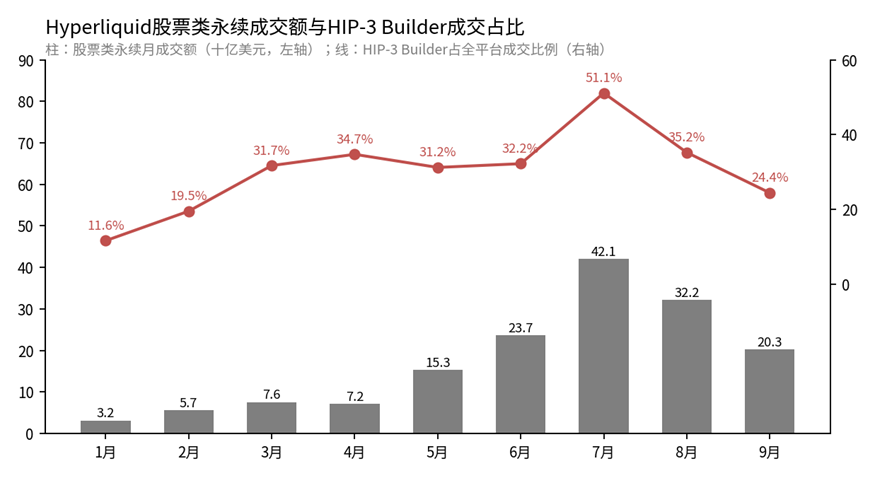
Hyperliquid equity perpetual trading volume and HIP-3 Builder share of volume (Hyperliquid, compiled by ArkStream)
On Hyperliquid, HIP-3 Builder volume grew from $132.4 billion in Q1 to $261.2 billion in Q3, while equity perpetuals rose from $16.5 billion to $94.6 billion; on a monthly basis, HIP-3 Builder's share of volume reached 51.1% in July before falling back to 24.4% in September, and monthly equity perpetual volume dropped from $42.1 billion in July to $20.3 billion in September. Over the same period, crypto perpetual volume on both Binance and Hyperliquid was lower than in Q1, with nearly all of the industry's volume growth coming from RWA perpetual contracts (Binance, Hyperliquid official APIs).
Looking at the broader industry, according to CryptoRank, RWA perpetual DEXs recorded total Q3 volume of $365 billion, up 32% quarter-over-quarter, of which equity assets contributed $175 billion, or about 48%; according to CoinDesk Research, crypto trading platforms processed nearly $1 trillion in RWA-related trading volume in the first half of 2026, with Binance alone accounting for 60.9% market share. Commodity perpetuals such as gold, silver, and crude oil, as well as Pre-IPO contracts like SpaceX, have all become new sources of volume for trading platforms.
Trading platforms are accelerating their transformation from pure crypto asset matching venues into comprehensive financial infrastructure where "everything is tradable." Coinbase has partnered with Yahoo Finance to connect market data and trading access for both crypto assets and traditional stocks, advancing its "Everything Exchange" vision; Kraken has launched regulated tokenized equity perpetual contracts based on the xStocks framework, offering non-U.S. users up to 20x leverage with 7×24 trading; Binance, meanwhile, has introduced tokenized asset exposure provided by Ondo Finance through Binance Alpha. Binance's Q3 listing data also reflects this, and it is fair to say that Binance has become "Stockbinance".
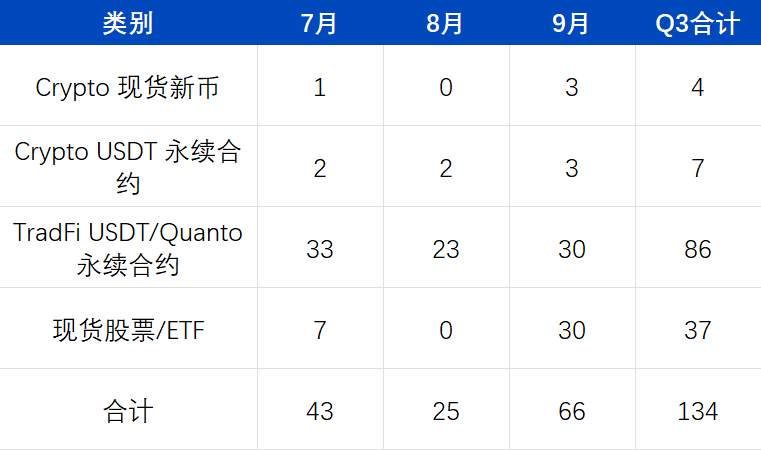
New Trading Instruments Added by Binance in Q3 2026 (Compiled by ArkStream)
In Q3, Binance added a total of 134 new trading instruments, including 86 TradFi perpetual contracts and 37 spot stocks and ETFs, with only 11 new crypto spot tokens and perpetual contracts combined.
Tokenized Stocks and On-Chain RWA
According to Binance Research, as of September 15, the on-chain RWA market reached $34.18 billion, growing 85.2% year-to-date; of which U.S. Treasuries and money market funds accounted for $18.29 billion, contributing 54.7% of the year-to-date increase, while tokenized stocks reached $4.43 billion, growing 390.4% year-to-date, with their share of RWA rising from 4.9% at the beginning of the year to 13.0%. Private credit is the fastest-growing non-Treasury category, while alternative assets such as gold and other commodities, corporate and government bonds, real estate, shipping finance, and renewable energy are also accelerating their migration on-chain. Established financial institutions including BlackRock, Franklin Templeton, Fidelity, JPMorgan, and Apollo, together with tokenization platforms such as Securitize, InvestaX, and IXS, form the primary institutional supply side of this RWA wave. DTCC has completed production-environment live trading tests for tokenized securities, ETFs, and Treasuries with approximately 40 institutions and plans full commercialization in October; Singapore's "Project Guardian" has also expanded its participating institutions to over 40.
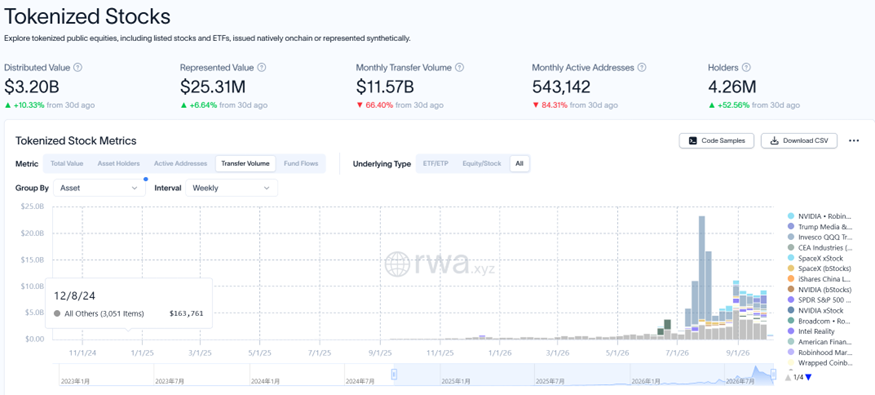
Tokenized Stocks Full-Market Data, as of End-September 2026 (rwa.xyz)
Tokenized stocks are the fastest-growing category. According to CoinDesk Research, the full-market tokenized stock market cap reached $4.87 billion in September, with monthly trading volume of $15.6 billion, both hitting record highs. On-chain tokenized stock transfer volume peaked in July and subsequently declined, but August and September remained significantly above pre-June levels; holding addresses reached 4.26 million.
On the brokerage side, Robinhood was the most closely watched case this quarter. In September, Robinhood became the largest tokenized stock trading venue, accounting for 42.0% of full-market volume; however, as noted in Part Two, the higher-market-cap assets on Robinhood Chain remain predominantly meme and token launch platform tokens, with stock tokens accounting for only about 6% of locked value. Robinhood's advantage on the path to convergence lies more in its gateway covering 38 countries and over 28 million customers.
Industry observers summarize this phenomenon as "the boundary between digital assets and traditional assets is dissolving from both directions simultaneously": crypto trading platforms are striving to make themselves more like traditional trading platforms, while traditional brokerages are striving to make themselves more like crypto trading platforms. In terms of incremental trading volume, the trading platform side is currently ahead, with RWA perpetual contracts for stocks and other assets contributing the bulk of this cycle's incremental growth; on the brokerage side, on-chain stock tokens remain in their early stages.
The Convergence of Users and Technology
Whether it is Binance or Robinhood, the goal under this historic window of the "path to convergence" is the same: to become a global gateway for multi-asset investment products. This convergence is not limited to trading instruments alone.
Convergence of users. As of the end of 2025, global crypto asset holders number approximately 720 million to 740 million, accounting for about 9% of the global population. But holding does not equal using: after deduplication, active crypto users number approximately 40 million to 70 million, equivalent to only 6% to 10% of the holder base. Crypto has achieved considerable coverage of asset holders, but still has a clear gap to close before becoming a high-frequency-use financial infrastructure.
Convergence of technology. In 2025, Stripe and Shopify announced that millions of merchants across 34 countries would accept USDC payments: consumers pay with on-chain USDC, merchants receive local fiat directly, and funds flow into bank accounts just like ordinary card revenue, with merchants not needing to manage wallets, gas fees, or stablecoin conversions. Polymarket represents another path for Crypto to enter the real world. It preserves blockchain visibility, leverages stablecoin settlement, public positions, and smart contract escrow to create a real-time probability market that previously did not exist between traditional media and betting platforms. Its breakthrough lies in getting political observers, traders, journalists, and the general public to begin treating on-chain prices as a source of information—whether users outside the circle buy crypto assets is secondary.
In the past, when people talked about Crypto, they thought of cypherpunks, speculative markets, fringe markets, and financial experimentation grounds. With the advancement of RWA, Crypto is becoming part of real life, and is also drawing nutrients for growth from real life.
Market Performance of Buyback Tokens
As incremental capital in the market is increasingly attracted to "TradFi-like" assets such as RWA, tokenized stocks, and stablecoins, how purely crypto-native tokens prove their ability to retain capital is becoming the core test for every Crypto project in this cycle. Buyback tokens—projects that use a portion of protocol revenue to buy back and burn or redistribute their own tokens on the secondary market, typically such as Hyperliquid's HYPE and Pump.fun's PUMP—are a benchmark the market uses to test "whether a protocol can generate real cash flow and whether it can feed value back to its token," echoing the logic of "verifiable cash flow and yield" emphasized by RWA assets.
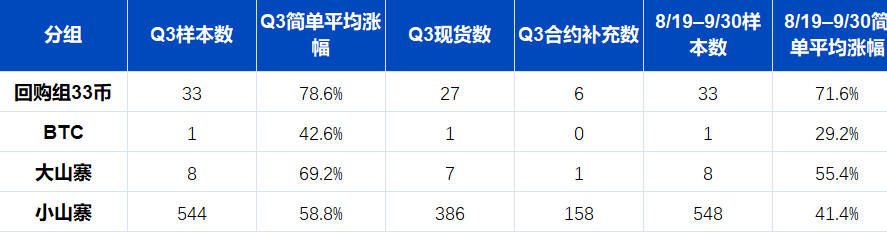
Q3 Price Performance of Binance Buyback Tokens (Compiled by ArkStream)
ArkStream compiled the performance of projects on Binance, with spot data as the primary metric and futures as a supplement. For Q3 overall, the 33 tokens in the buyback group rose an average of 78.6%, Bitcoin rose 42.6%, the 8 large-cap altcoins rose an average of 69.2%, and the 544 small-cap altcoins rose an average of 58.8%. From August 19, when Bitcoin truly turned strong, to the end of the quarter, the buyback group rose an average of 71.6%, Bitcoin rose 29.2%, large-cap altcoins rose 55.4%, and small-cap altcoins rose 41.4%. Whether looking at the entire quarter or the period after August 19, buyback-group tokens outperformed other altcoins. There is another phenomenon in this dataset: large-cap altcoins showed greater elasticity than Bitcoin, while small-cap altcoins as a whole underperformed large-cap altcoins. Although the average gain of small-cap altcoins was higher than Bitcoin's, this was a rebound from a previously deeper decline, and the exchange rate of small-cap altcoins against Bitcoin remains at a multi-year low. This also confirms our view: without buybacks to support value capture, the vast majority of altcoins cannot attract market attention the way memes do, and will only gradually wither in the market ahead.
For crypto projects, this is precisely the real test posed by this RWA bull market. Assets such as RWA and tokenized stocks continue to attract incremental capital by virtue of clear underlying cash flows and high regulatory acceptance. If crypto-native projects cannot prove that they possess sustainable, verifiable protocol revenue and value-capture mechanisms, whether through buybacks, dividends, or other forms, they are likely to be marginalized in the next round of capital reallocation. A small number of leading protocols that truly have cash-flow-generating capacity and are willing to transfer value to token holders through mechanisms such as buybacks, such as Hyperliquid, are expected to stand out in the reconstruction of a "RWA-like" valuation system and become a bridge connecting crypto-native narratives with traditional financial valuation logic. ArkStream believes that in the coming quarters, "the sustainability of protocol revenue and buybacks" will replace单纯的 TVL or trading volume as a more important indicator for measuring the fundamental quality of crypto projects.
Speculative demand will not disappear, and meme and narrative-driven projects will still have their market space. It is just that for the vast majority of projects, the golden age of issuing tokens to raise money is over, and what crypto projects face next is comprehensive competition. While this article was being written, Blast and Abstract announced their closure; during the same period, CEXs also continued to delist crypto assets, with Binance cumulatively delisting 15 spot assets and 13 futures assets in Q3. This kind of clearing will not end quickly; it is an indispensable pain in crypto's path toward RWA integration. Once the path of integration begins, crypto will be reborn.
Summary
At the macro level, the U.S.-Iran conflict escalated repeatedly, with Brent crude rising from $73.74 to above $108, gasoline prices up 27.4% year-over-year, and one-year consumer inflation expectations climbing to 4.6%. The Federal Reserve completed its first rate hike since 2023, with the market pricing in roughly a 94% probability of one more hike before year-end; the 10-year Treasury yield rose to 5.25% on September 28, the highest since June 2007. Bitcoin moved in tandem with the Nasdaq while decoupling from gold.
At the crypto level, the market recovered markedly after August 19, with Bitcoin gaining 42% in Q3, but the altcoin season index and Bitcoin dominance indicate that capital remains concentrated in Bitcoin; crypto perpetual contracts bottomed in July and rebounded in September, though Q3 volume remained below Q1. Robinhood Chain and Arc saw rapid trading growth after launch, but trading is still dominated by memes, with stock tokens and institutional settlement still in early stages.
At the industry level, this RWA bull market is mainly reflected in the trading growth of RWA perpetual contracts such as stocks on Binance and Hyperliquid, which is the primary trading增量 for the crypto industry in 2026; on-chain RWA scale grew 85.2% year-to-date (Binance Research). The meme bull market is gone for good, with new capital entering Bitcoin primarily through ETFs; among crypto-native projects, tokens with protocol revenue and sustained buybacks have clearly outperformed other altcoins.
Our base case is: before the Strait of Hormuz resumes navigation and oil prices and Treasury yields decline markedly, Bitcoin will most likely continue to fluctuate in line with U.S. equity risk appetite; divergence among crypto projects may continue to widen, and the sustainability of protocol revenue and buybacks will become a more important screening criterion.
Original link
Welcome to join the official BlockBeats community:
Telegram Subscription Group: https://t.me/theblockbeats
Telegram Discussion Group: https://t.me/BlockBeats_App
Official Twitter Account: https://twitter.com/BlockBeatsAsia