Gold Surges Beyond $4300 Mark, Is the Bullish Trend Restarting?

At the beginning of August, the market did not see a shift in gold first, but in crude oil. The expectation of the reopening of the Strait of Hormuz weighed on oil prices. Following the usual script, safe-haven assets should have cooled off as well. However, gold moved upwards. According to Reuters on August 6, spot gold was priced at $4,285.84 per ounce, rising for the fourth consecutive day, reaching a high not seen since mid-June.
This trend can easily be attributed to the ongoing "geopolitical risks." However, another clue from Reuters suggests a different story. After the fall in oil prices, the US dollar and Treasury yields simultaneously weakened, causing the market to reassess how high the Fed will raise interest rates. The increase in the price of gold occurred at the moment when the opportunity cost of holding it was repriced.
The Short-Term Shift Was in Rate Hike Pricing
There is no direct supply chain between crude oil and gold. Crude oil affects the market's inflation expectations. As energy prices cease their upward pressure, the necessity of further rate hikes seems less urgent.
According to Reuters on August 6, the market's expectation of a September rate hike dropped from 67% to 55% within two days. The same report mentioned that Treasury yields declined, and the US dollar index was under pressure. This explains why news that seemingly reduced geopolitical risk was able to provide short-term momentum for gold.
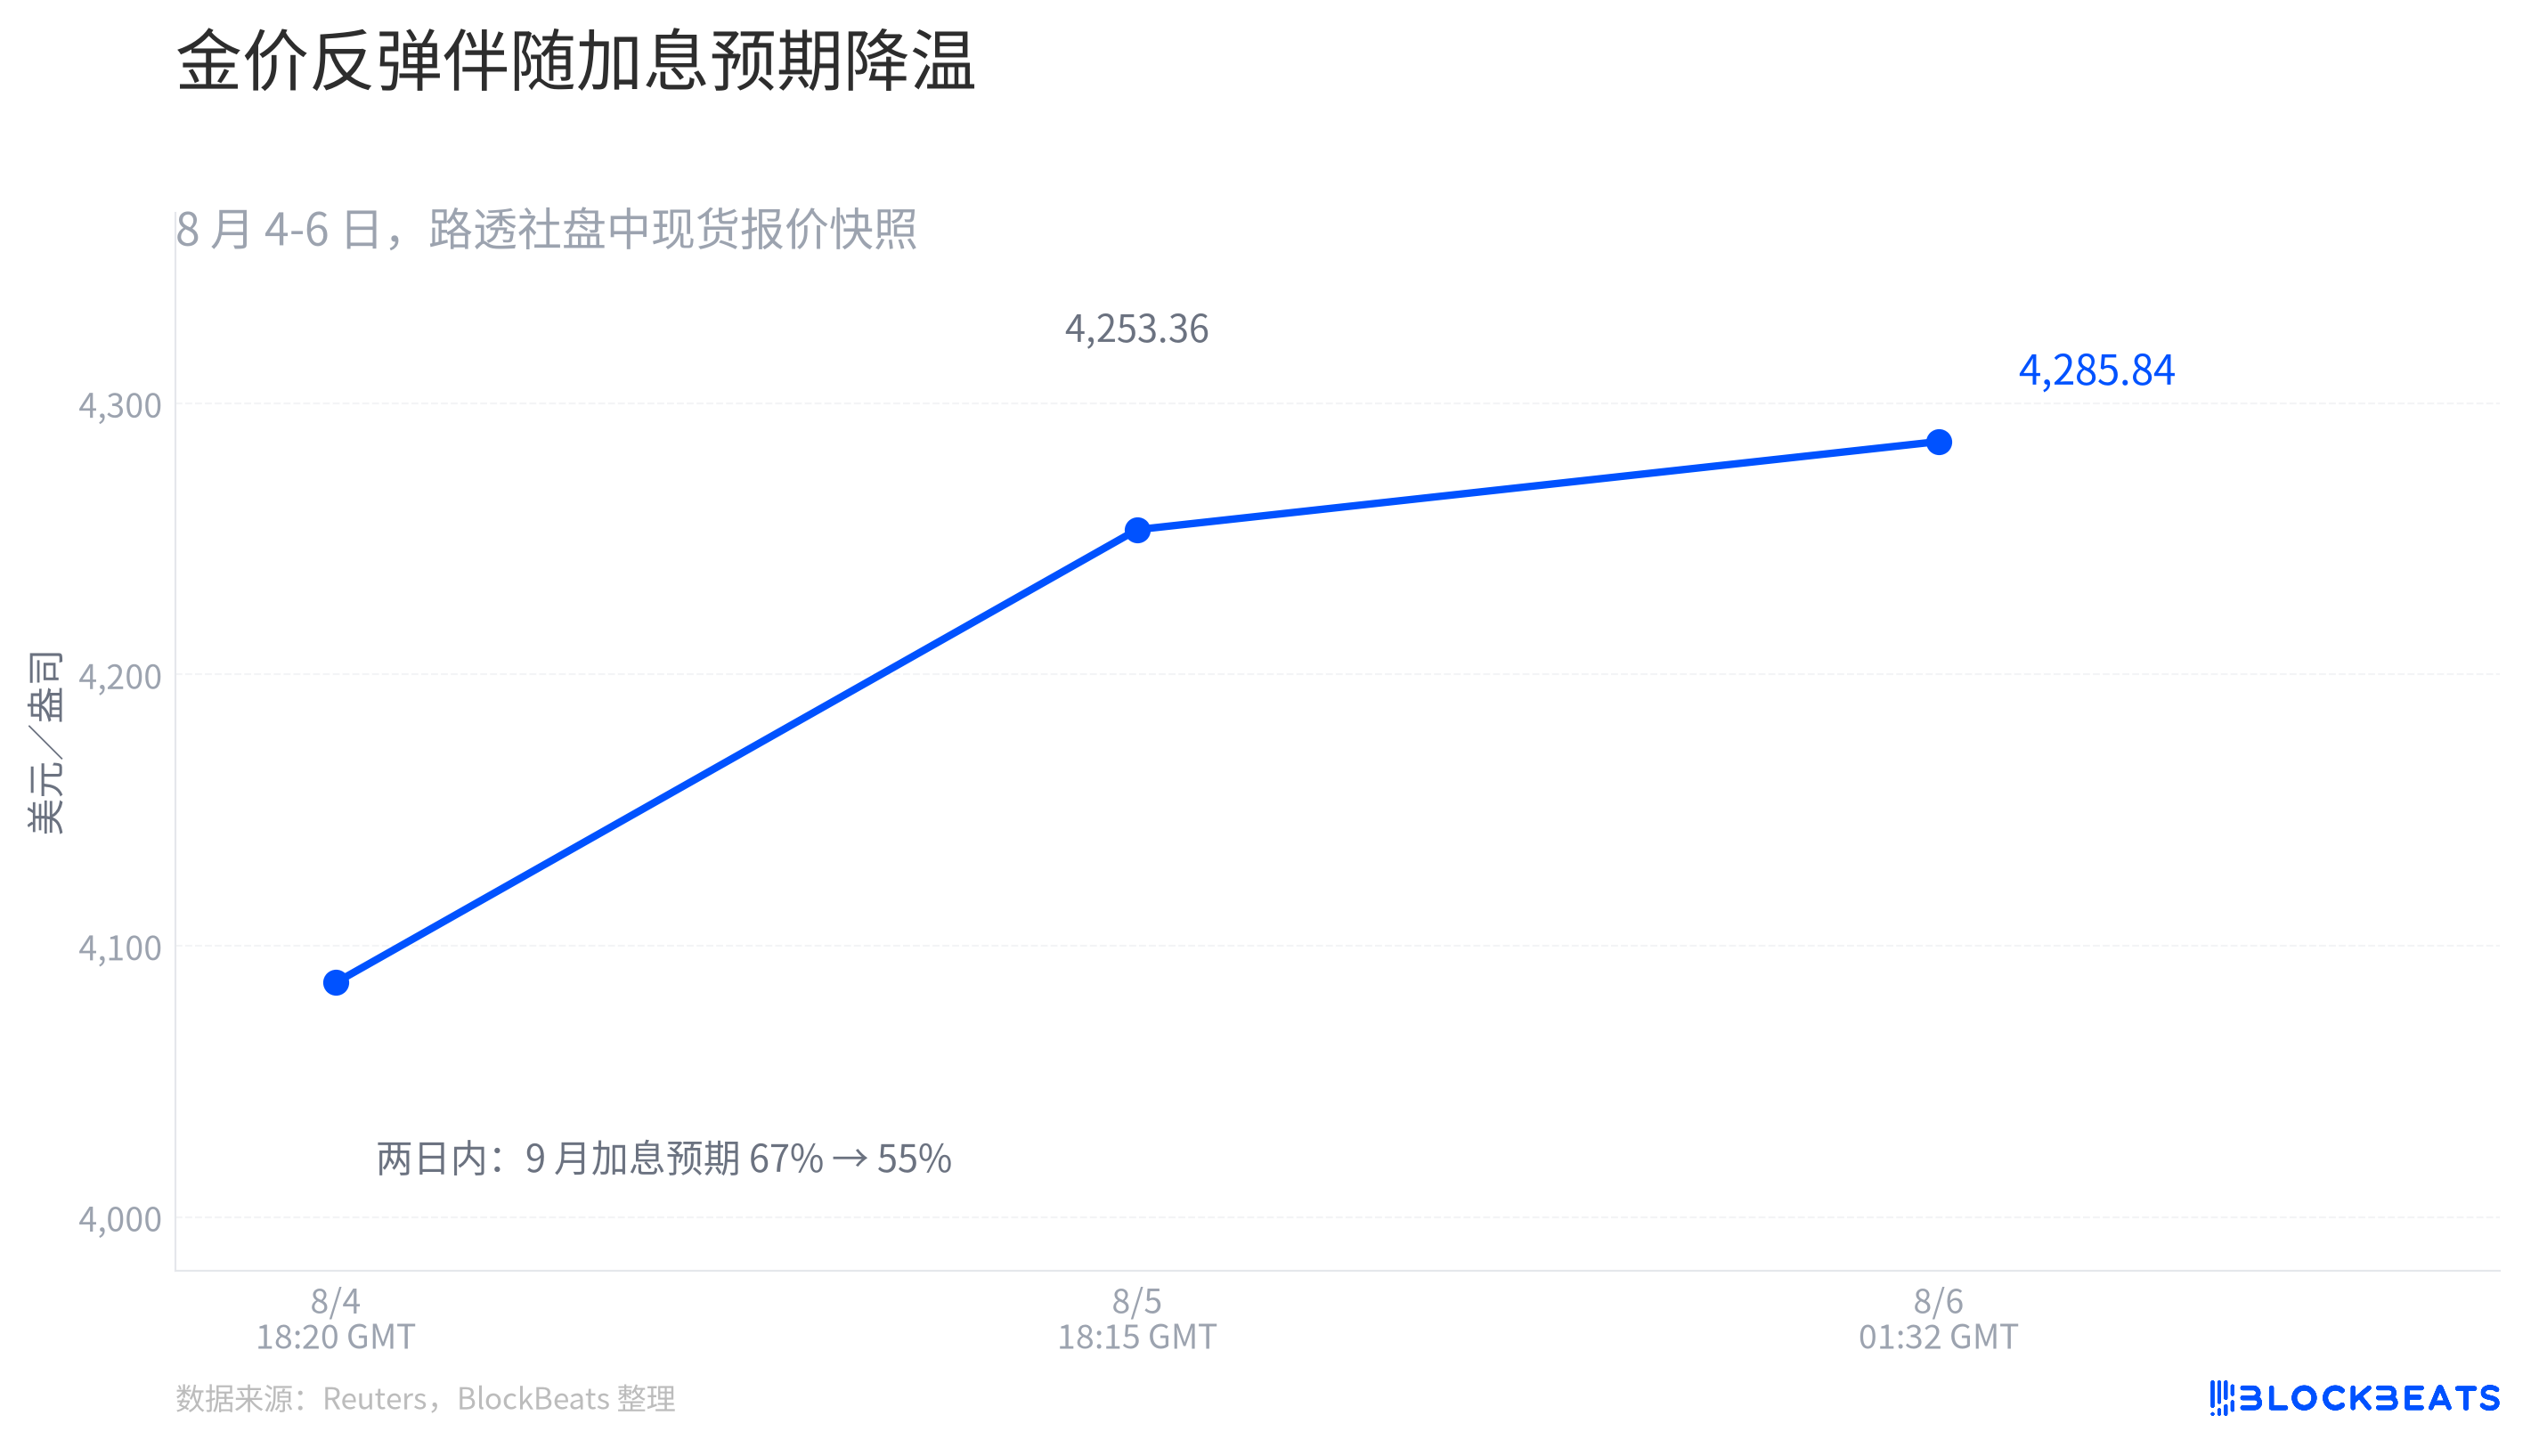
The chart data is based on intraday quotes from Reuters on August 4, August 5, and August 6.
The three price points in the chart are not daily closing prices, let alone settlement prices. They are like snapshots taken at different times in the market. As the price rises, rate hike pricing retreats, with both being two facets of the same macro reassessment.
St. Louis Fed's FRED database shows that the ten-year Treasury Inflation-Protected Securities (TIPS) yield decreased from 2.47% to 2.40%. For gold, this is not an abstract macro term. It translates to a slight reduction in the risk-free return on the money when not invested in gold. With the threshold for zero-yield assets lowered and the weakening of the US dollar reducing the pricing cost for overseas buyers, short-term buying interest found a foothold.
Price Reassessment Did Not Bring More Tonnes
With prices surging, it is easy to mistakenly believe that the world is rushing to buy gold. The World Gold Council's Q2 data paints a calmer picture. While the LBMA Gold Price PM averaged surged 37% year-on-year, the total gold demand, including OTC, remained roughly flat at 1,269 tonnes. The World Gold Council's data consolidates these two points in the same comprehensive table.
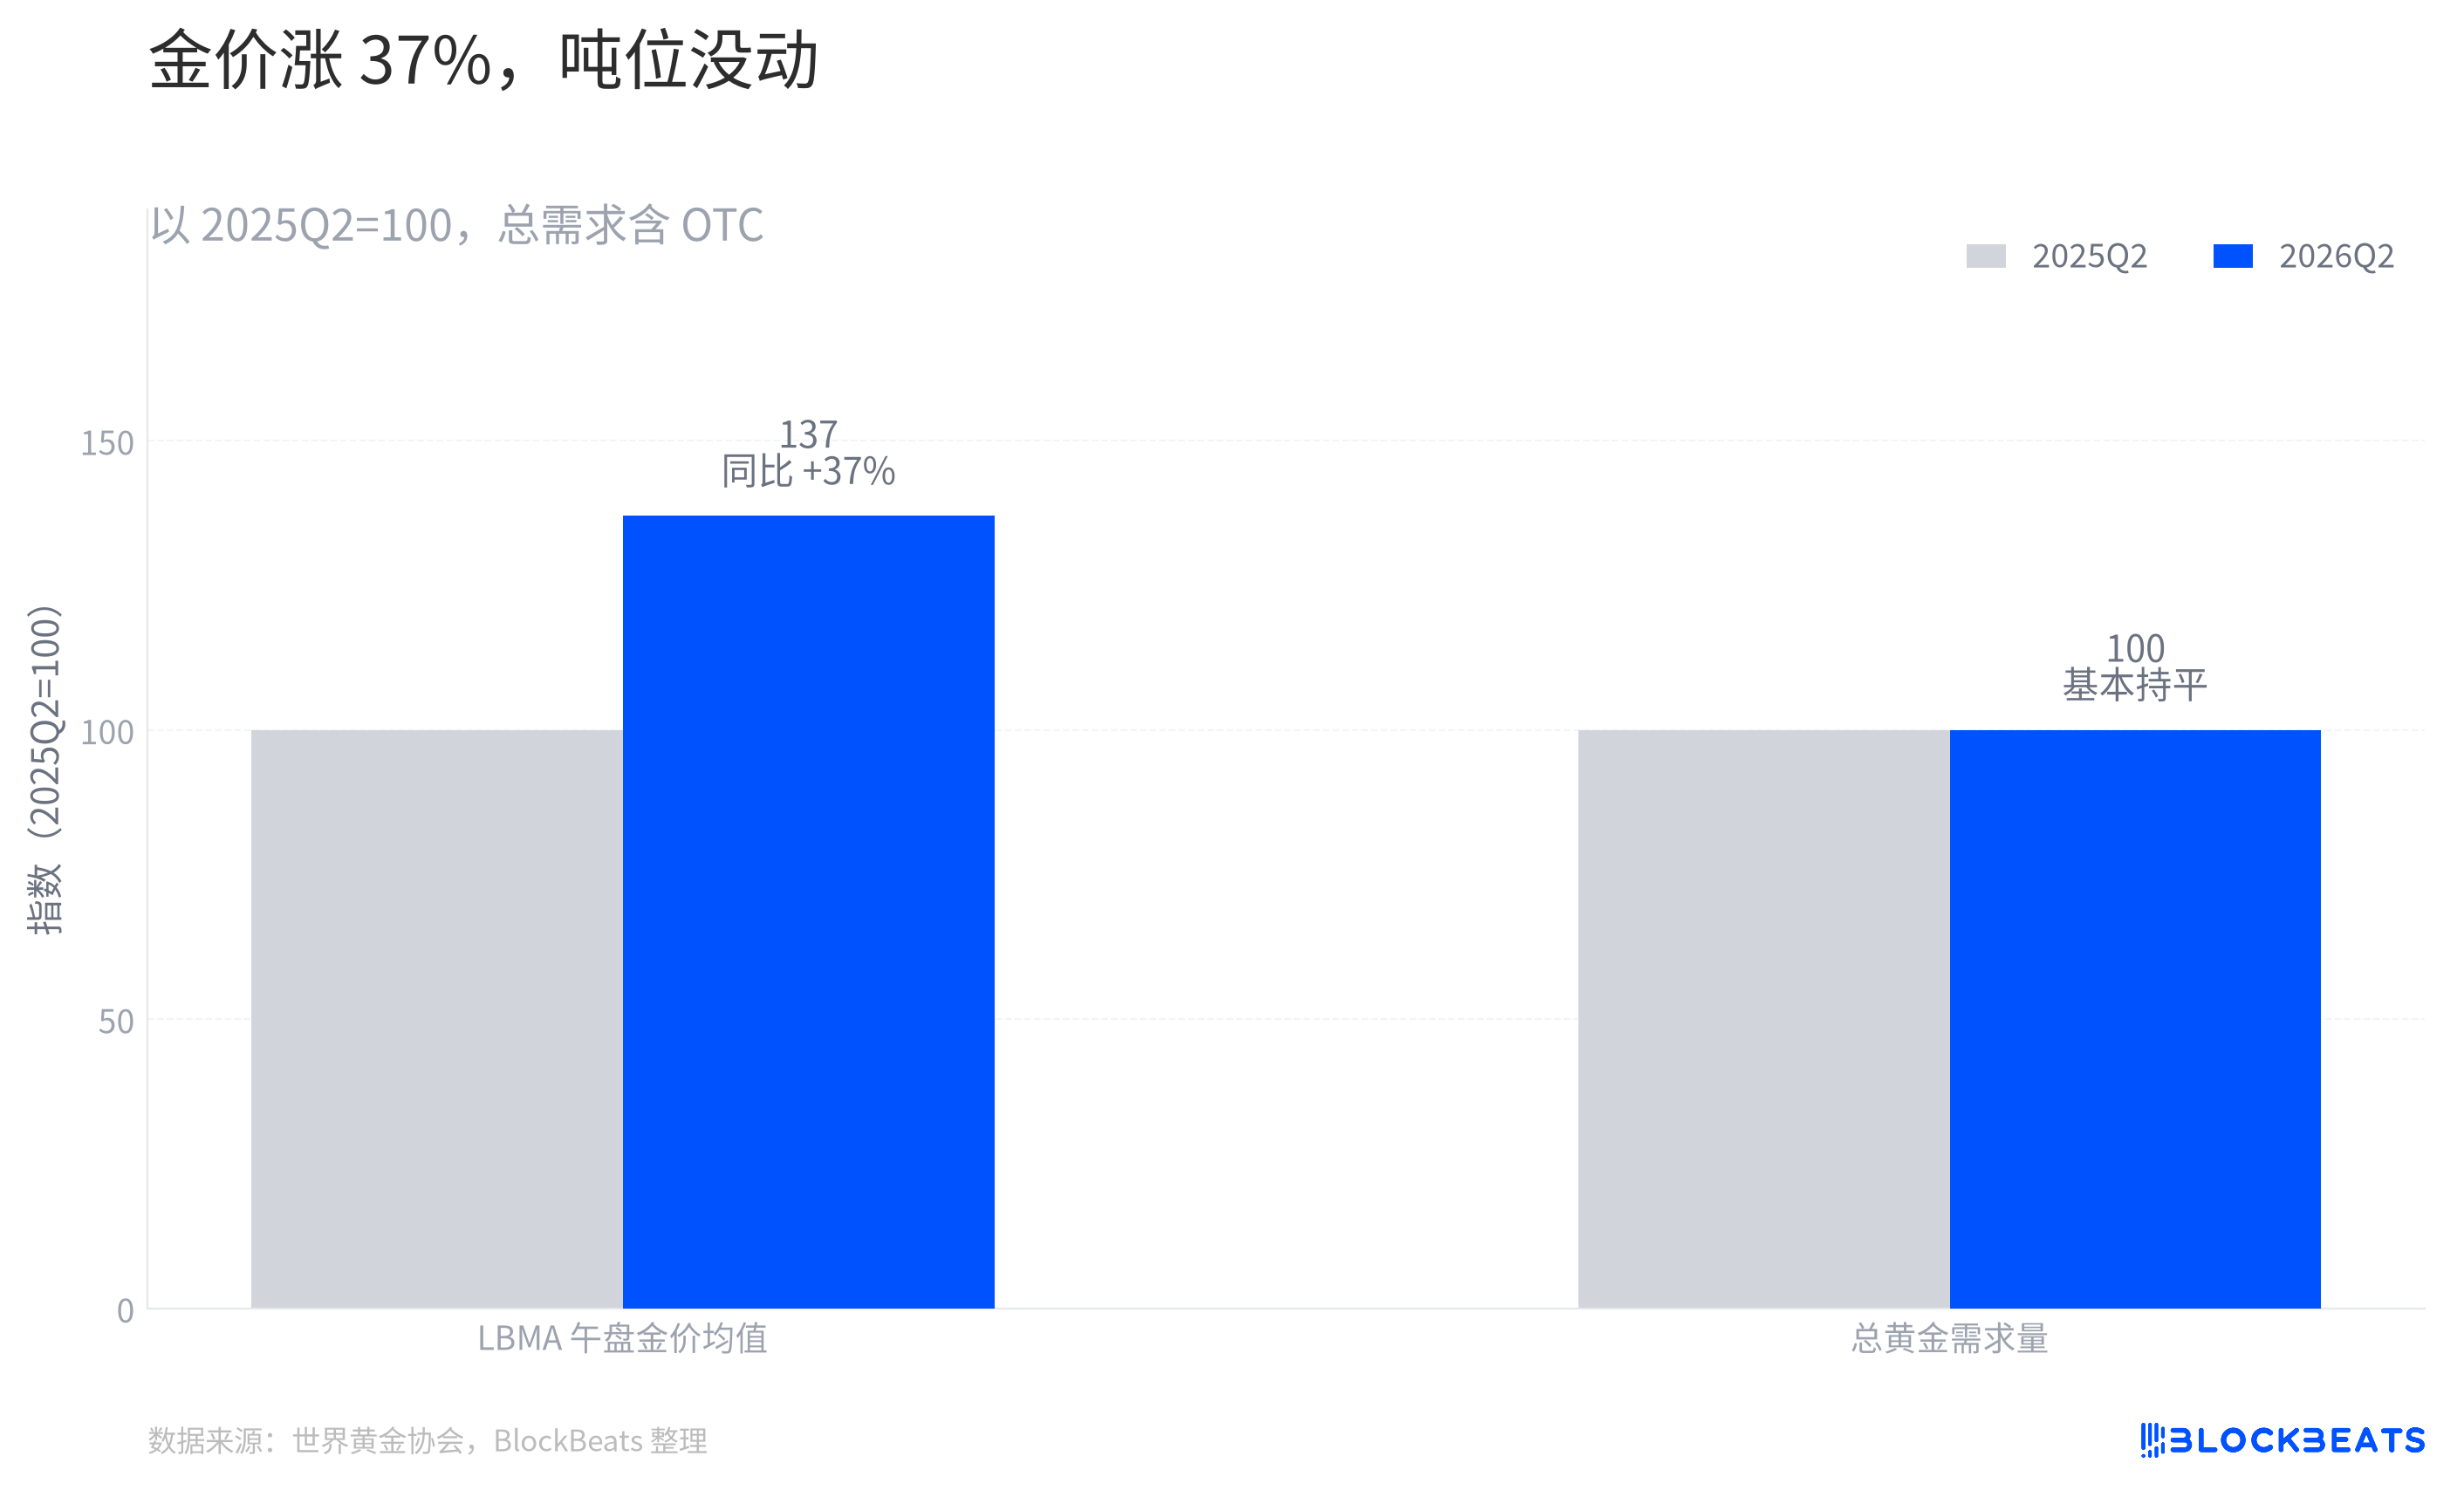
The key point of this chart is not that "demand has not increased," but that the nature of demand has changed. Total demand includes OTC transactions and other balance items; it is not the total number of gold bars taken away by retail consumers. The nearly unchanged tonnage in the chart indicates that the price first experienced a reassessment, rather than every category of buyer suddenly increasing their purchases.
The World Gold Council's statistics for the first half of the year also show that demand value hit a record $380 billion, with demand volume only increasing by 2% year-on-year. These data indicate that the amplification of demand value has not translated into a proportional expansion in tonnage. The price reflects the changing weight of different demand components, not that every category of buyer simultaneously increased their purchase quantities.
ETFs Are Not Gold's General Ledger
The most noticeable sellers came from gold ETFs. In the second quarter, ETFs and similar products saw net outflows. Meanwhile, the World Gold Council recorded a rebound in central bank and other official institution net purchases, as well as an expansion in OTC and other items. Only by comparing these items side by side can one see that the gold market does not rely solely on a single public holdings curve.
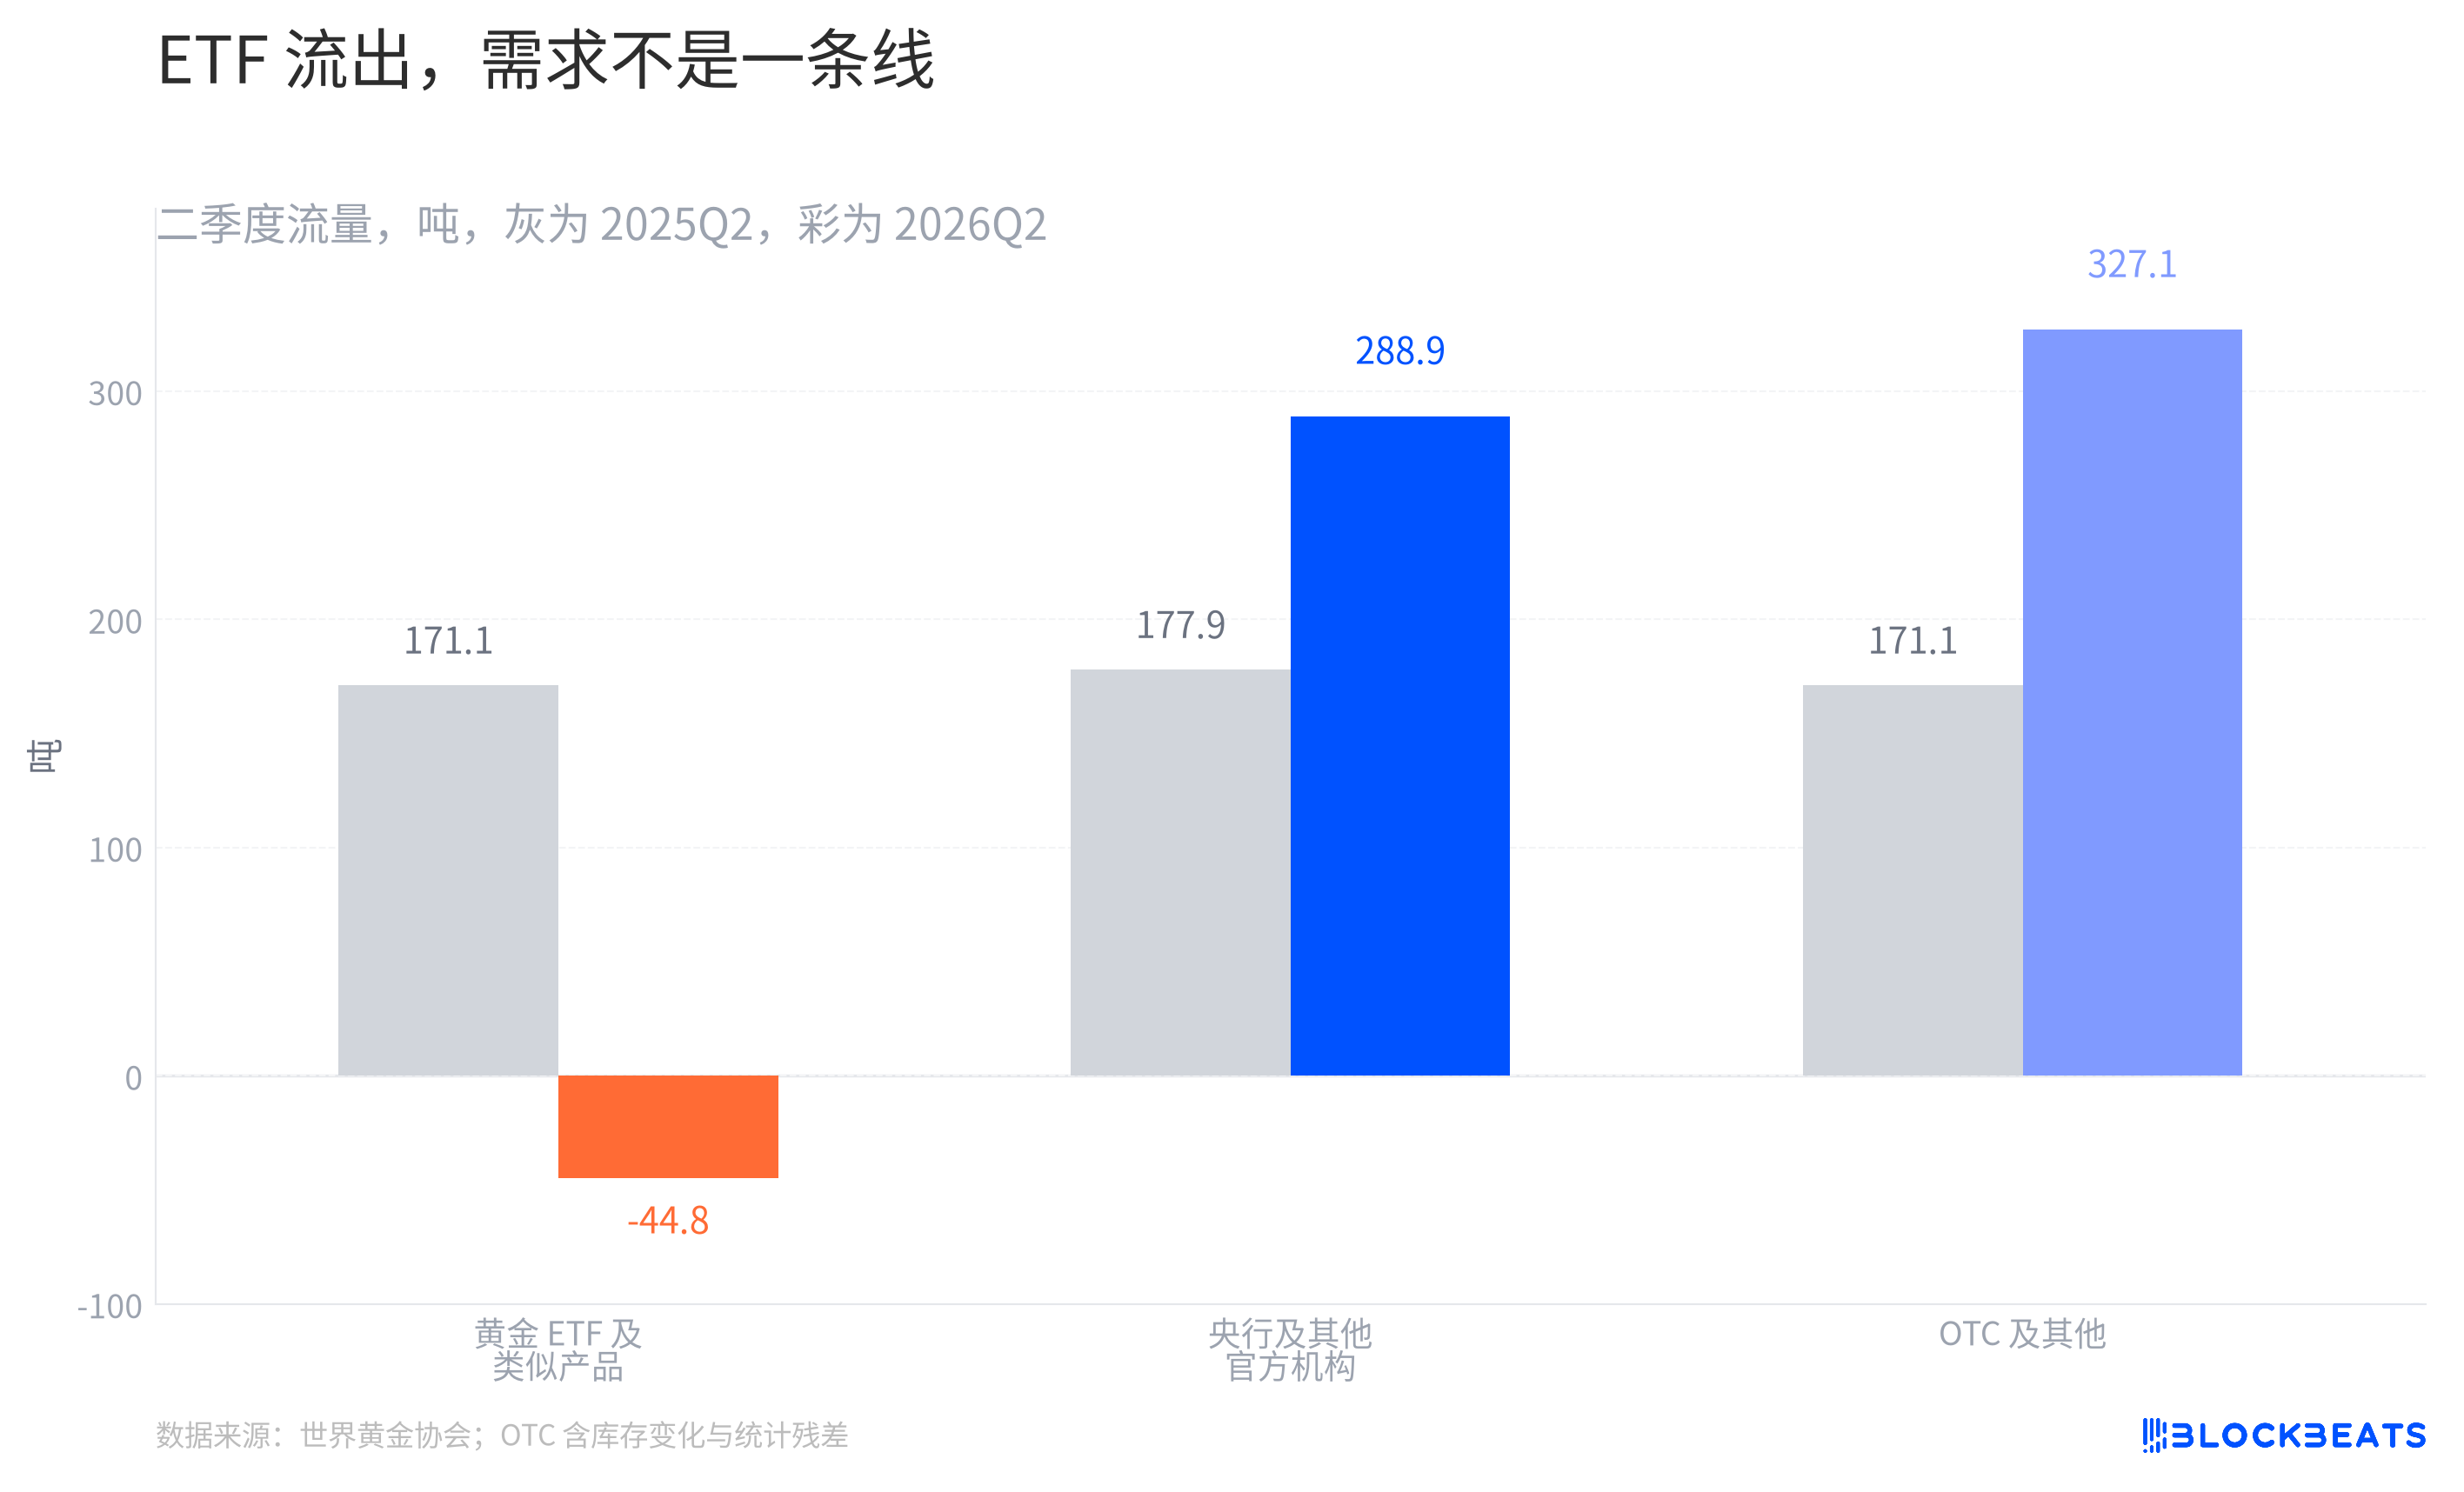
However, this chart should not be read as a "who took away the ETF sell-off" delivery note. The World Gold Council clearly states in its methodology notes that OTC and other items also encompass exchange-traded inventory changes, unobserved manufacturing inventory changes, and statistical discrepancies. It can explain that public ETF outflows do not equate to no market absorption and cannot penetrate into a specific country or fund category.
Central bank data should not be seen as a perpetually rising straight line either. The World Gold Council has revised downward its first-quarter official sector buying estimate due to inherent reporting and statistical lags. Taking ETFs as the sole barometer and central banks as the sole buyers will flatten a multi-layered market into a single story.
The decrease in short-term opportunity cost brought by the fall in oil prices. The decoupling of price and tonnage, along with the divergence between public and private flows, illustrates that when gold rises, what truly changes in the market is often the structure of the holders.
Welcome to join the official BlockBeats community:
Telegram Subscription Group: https://t.me/theblockbeats
Telegram Discussion Group: https://t.me/BlockBeats_App
Official Twitter Account: https://twitter.com/BlockBeatsAsia