Dollar-Cost Averaging into the S&P 500: Is It Really the Best Solution? AI Backtesting Reveals a 34% Annualized Return
Original Title: "Is Dollar-Cost Averaging into the Index Really the Best Solution? I Backtested for 26 Years with AI and Found a 34% Annualized Answer"
Original Author: Asa, Partner at tutti.so
All along, I have had a doubt: many people around me are dollar-cost averaging into the Nasdaq, but is monthly DCA into QQQ really the best solution for long-term index investing? Is there a way to achieve higher returns?
This question has been taking up a lot of memory in my brain for a long time. It wasn't until a few days ago that I discovered a large model called Apodex, designed for in-depth research.
I threw this doubt directly to it. After dozens of rounds of discussions, Apodex ran over a dozen full system backtests: the entire history from 2000 to 2026, five typical starting points, and a horizontal comparison of three strategies. After toiling for more than a day, the conclusion was indeed beyond my expectation. Especially the number of times the final assets of the new strategy can outperform DCA into the index, made me decide to organize the entire deduction into this article.
Disclaimer: All numbers in this article come from a reproducible backtesting engine (single file strategies.py, 2026-06 data), with a consistent calibration of investing $10,000 at the beginning of each month. Leveraged ETFs were synthetically 3 times the index before 2010, and then directly TQQQ.
First, let's talk about the conclusions:
1. Just dollar-cost averaging into QQQ every month is not the optimal solution for long-term index investing.
2. Comparing five starting points (2000, 2005, 2010, 2015, 2020), a three-signal framework increased the average annualized return from 19% with QQQ to 34%. More importantly, the difference in final value: over a long period including a major bear market cycle, the final assets are 10 to 33 times that of DCA into QQQ, approximately 33 times for the 2000 starting point, around 29 times for 2005, and about 10 times for 2010. Investing the same $10,000 every month, after over twenty years, there is a difference of two orders of magnitude. Compared to holding TQQQ, it only earns about 3 percentage points less in annualized return but reduces the average drawdown from -84% to -52%.
3. This overwhelming difference in final value is earned during times of crisis, relying on buying the lows during major downturns such as 2002 and 2008. In short windows of overvaluation like 2015/2020, before encountering a major crash, the three-signal strategy does not chase highs, resulting in slightly lower end-of-period assets compared to QQQ (approximately 0.9 times). Therefore, its advantage requires a long enough time horizon and going through a decent crash to materialize.
In summary: with returns close to TQQQ and an almost halved drawdown, using the same dollar-cost averaging principal amount, over a long time period, rolls into investing in QQQ with multiples ranging from a dozen to thirty-plus times. This is the answer that is closer to the optimal solution.
Below is the complete process of this deduction.
Step One: Is DCAing just into QQQ really good enough?
First, unify the rules; the following three strategies will all follow this:
· Starting points: Five points in 2000, 2005, 2010, 2015, 2020
· Execution: Starting from each starting point, invest $10,000 at the beginning of each month, continuously DCAing until mid-2026
· Look at three indicators: IRR (Annualized Rate of Return), Maximum Drawdown (MDD), End Value Multiple (final market value divided by total investment)
Overall picture of QQQ dollar-cost averaging:
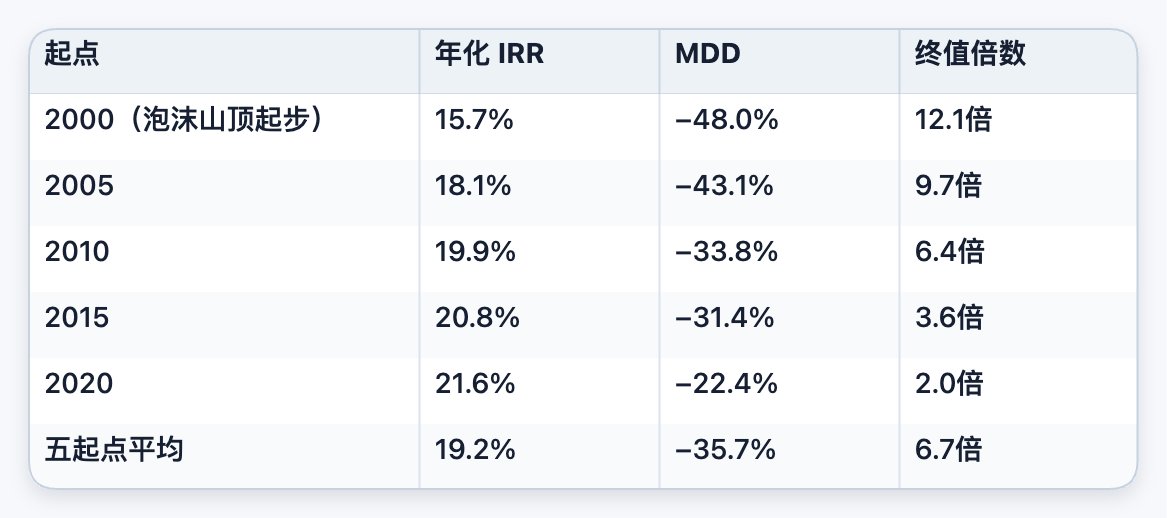
(Note: The earlier the starting point, the longer the time window, the higher the end value multiple due to longer compound time; conversely, the IRR is slightly higher for later starting points, as it avoids the drag of the 2000/2008 two big bear markets.)
Conclusion: QQQ is stable enough but not aggressive enough. It generally maintains positive returns over the long term, with drawdowns controlled in the range of -30% to -48%, a range that equity investors can tolerate. The issue is that the returns are moderate, with an average annualized return of about 19%. This number looks respectable on its own, but as soon as you add a TQQQ line, you will immediately realize that DCAing into QQQ is more like a conservative baseline rather than the most efficient optimal solution.
Step Two: TQQQ, amazing returns but drawdowns are a death door
With the same starting point and monthly investment amount, switch to DCAing into TQQQ with a 3x leverage each month.
First, look at the side that keeps you up at night: returns almost double that of QQQ:
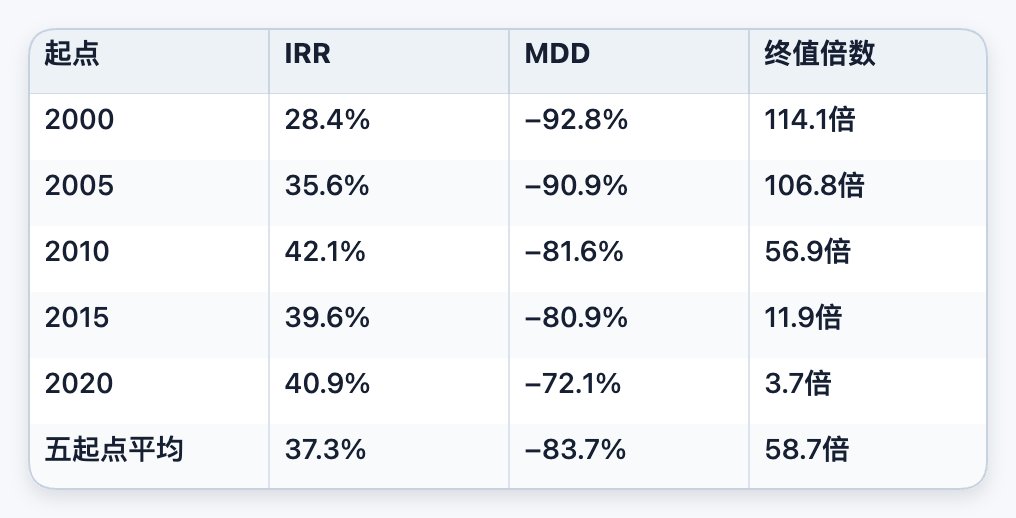
The average IRR is about 37.3%, nearly twice that of QQQ (19.2%); the end value multiple is 58.7 times, almost nine times that of QQQ (6.7 times). Just looking at this table, it's hard not to be excited.
There is one thing to note here.
Many people think that buying TQQQ at the 2000 peak was a disaster. If it was a lump sum investment, it would have almost gone to zero when it hit the bottom. However, under the monthly DCAing approach, TQQQ at the 2000 starting point achieved an IRR of 28.4% and a 114x multiple: because you would continue to buy into the severely discounted shares during the 2002 and 2008 crashes, and when the great bull market from 2010 to 2021 arrived, all these low-cost chips were cashed out. DCAing inherently dilutes the risk at the starting point.
So what's the real issue with TQQQ? It's that -84% drawdown.
The average maximum drawdown is -83.7%, with the 2000 starting point plunging as much as -92.8%. This means that on the journey to that beautiful end value, you have to watch your account drop by over 90% from its peak and still continue to dollar-cost average in the darkest times.
This is the true killer of naked TQQQ: not that you will lose everything, but that almost no one can withstand a -92.8% drawdown without panicking. While backtesting shows a continuous 58.7x return, in reality, 99% of people would capitulate on some dark night at -70%, turning this smooth curve into a mess.
So the conclusion is: the returns of naked TQQQ are real, but its demands on human nature are so high that they are unrealistic. It is more suitable as a high-octane fuel released under control rather than a 100% core position.
Step Three: To achieve TQQQ's returns and withstand them, you can only go for a dynamic position
The contradiction is clear:
· QQQ: Mild drawdowns but lower returns;
· TQQQ: Extremely high returns but drawdowns too high to endure.
So the natural question is: can you avoid leverage or even not invest when prices are exorbitant, then boldly use TQQQ when prices are low, in a deep downturn, or during times of panic, while diligently holding QQQ as the core position the rest of the time?
This is exactly the direction that Apodex was repeatedly forced to confront in backtesting. Around this issue, Apodex has constructed and iterated on a CAPE + DD + VIX three-signal dynamic position framework for the full sample from 2000 to 2026.
Three fundamental signals
Valuation, based on CAPE percentile:
· Below 20% → Extremely cheap
· Above 70% → Overvalued
· Above 85% → Bubble danger zone
Trend and drawdown, based on DD:
· More than 20% drawdown from peak → Deep oversold
· Rapid drop of over 12% in 25 days → Crash alert (used for deleveraging)
Panic, based on VIX:
· Above 40 → Extreme Fear
· Below 12 → Extreme Greed, often seen in overbought zones
All smoothed by 5-day moving average, only run on the first trading day of each month.
Decision Tree (Simplified Version)
On the first trading day of each month, start by counting how many of the three low-level signals have lit up (cheap valuation, sharp drop, panic):
· If 2 to 3 signals light up simultaneously, it's considered a major bottom: Allocate triple the usual amount for the month, buy TQQQ along with all available cash, then gradually leverage up over the next 6 months.
· If only 1 signal lights up, it's a minor bottom: Allocate double the usual amount for the month, buy QQQ.
If none of the three signals light up, follow these steps:
1. If there is a rapid drop of over 12% within 25 days: Emergency sell half of TQQQ position, move the funds to the reserve.
2. If the valuation is high (CAPE percentile above 70%) and the index is close to a historical high: Do not invest this month, keep funds on the sidelines and avoid chasing highs.
3. If the market has been overheated or too calm for 6 months or more (VIX below 12 or CAPE percentile above 85%): Sell one-twelfth of the TQQQ position each month, maintain a baseline position, and move funds to the reserve.
4. For all other scenarios: Invest the usual amount, buy QQQ.
Usage of the Reserve: Funds accumulated during high valuation periods are stored in the reserve, earning interest in a money market fund. If no low-level signals appear during a month, one-sixth of the reserve is slowly used to buy back QQQ. When low-level signals appear, the entire reserve is deployed, buying the dip along with the usual monthly investment.
For example, in March 2009, when the VIX surged above 40, CAPE percentile dropped below 20%, and the Nasdaq retraced over 40% from its peak, all three low-level signals lit up. The strategy for that month was straightforward: deploy all cash from the reserve, invest triple the usual amount for the month, and go all-in on TQQQ. Over the subsequent 12 months, the Nasdaq surged over 70%, more than doubling the leveraged position. That's what this strategy is all about: waiting patiently for the right moment and seizing the opportunity to reap the rewards.
In essence, this strategy consists of two key components:
· Tiered Allocation Engine: Using CAPE, DD, and VIX to categorize the market into three states—overvalued, oscillating, undervalued—to determine the leverage ratio. It also includes a position floor to ensure TQQQ is not zeroed out at a peak.
· High Lock-in Profit with Ammunition Depot Mechanism: When the valuation enters the overvaluation zone (CAPE above 85% and other signals), systematically deleverage, lock in gains into cash funds, stockpile ammunition, and wait for the next signal to collectively reenter the market.
This is the true implementation behind the stability of QQQ and the aggressiveness of TQQQ: rule-based dynamic position management.
Ammunition Depot Drip Irrigation: A monotonically increasing rule
Finally, there is a key detail optimization: the pace of ammunition depot replenishment. The money saved during the overvaluation period through deleveraging is not bought back all at once when the next signal arrives; instead, it is slowly dripped back into QQQ at a rate of one-sixth per month. Once a true low signal appears, all the funds are deployed. Tested at ten starting points from 2000 to 2026, this slow drip irrigation, compared to immediate buyback, maintains a stable annualized return higher by 0.05 to 0.15 percentage points, with almost no change in maximum drawdown. Moreover, the slower the drip, the higher the return (slowing down from one-sixth to one twenty-fourth is still lifting). This monotonous rule demonstrates that it earns money through high-level phased purchases and staggered replenishments, not backtesting noise. All the numbers marked with three signals in the latter part of this article are based on this complete configuration with ammunition depot drip irrigation.
Step Four: Result Comparison, Is the Three-Signal Framework Really Better?
With the same starting point and monthly investment amount, the three strategies run side by side.
Starting from 2000 (the worst peak start)
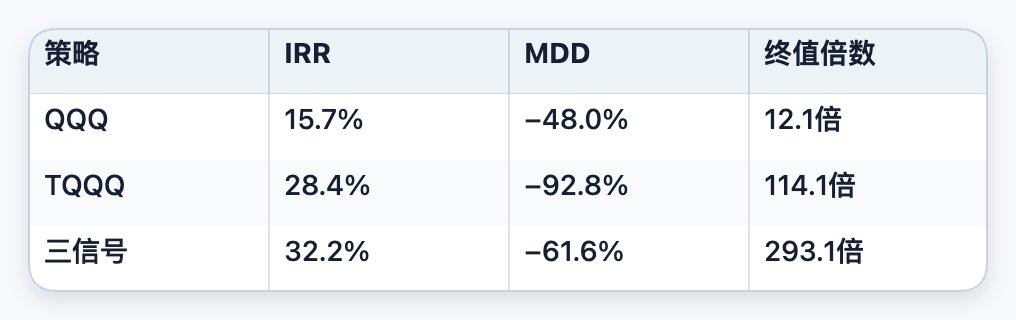
At the worst starting point, the three-signal strategy had the highest return, far better drawdown than TQQQ, and the final value was 2.5 times that of TQQQ, even outperforming at the peak.
Starting from 2005 (only hit by the 2008 crisis)
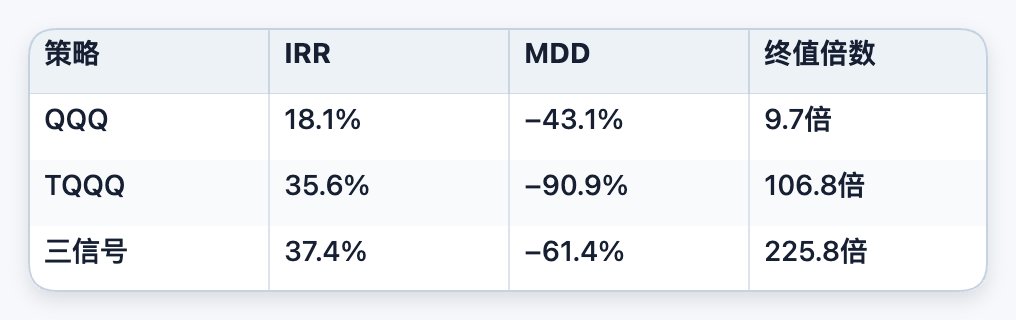
The IRR is still the highest of the three, with drawdown almost 30 points shallower than TQQQ and the final value doubled.
Starting from 2010 (TQQQ golden window)
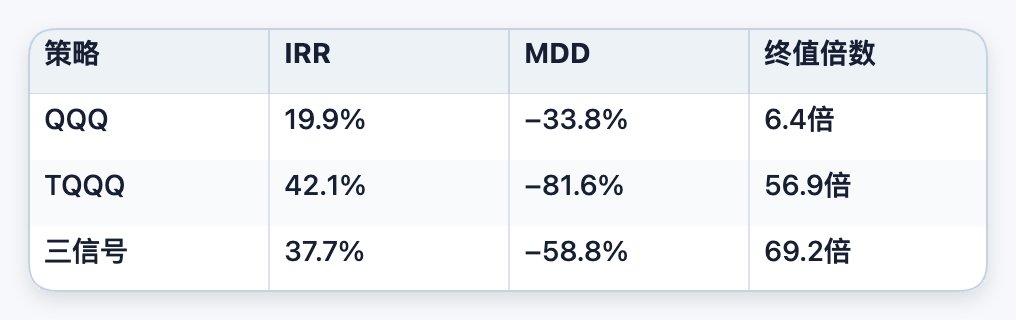
The three-signal IRR is slightly lower than naked TQQQ (37.7% vs. 42.1%), but the drawdown is much smaller and the final value is higher.
Starting from 2015 and 2020 (short window + 2020 flash crash + 2022 bear market)
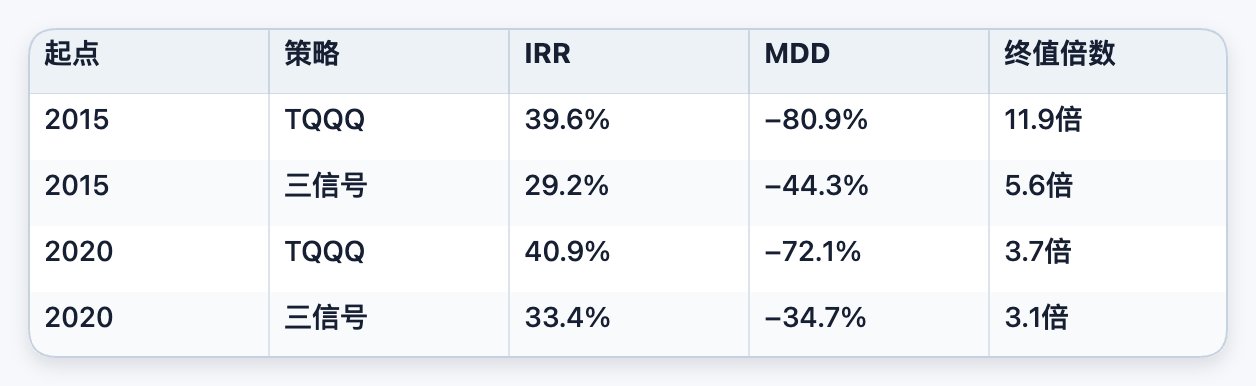
To be honest: in the 2015/2020 short window, before encountering a century-level market bottom, naked TQQQ temporarily leads in IRR and final value because the crisis bottom-fishing bonus of the three signals has not yet been realized, while its drawdown advantage (-44% vs. -81%) has effectively protected you. Once the window extends and encounters a major crash, the scales will tip back in favor of the three signals (see 2000/2005/2010).
Five starting points, one glance:
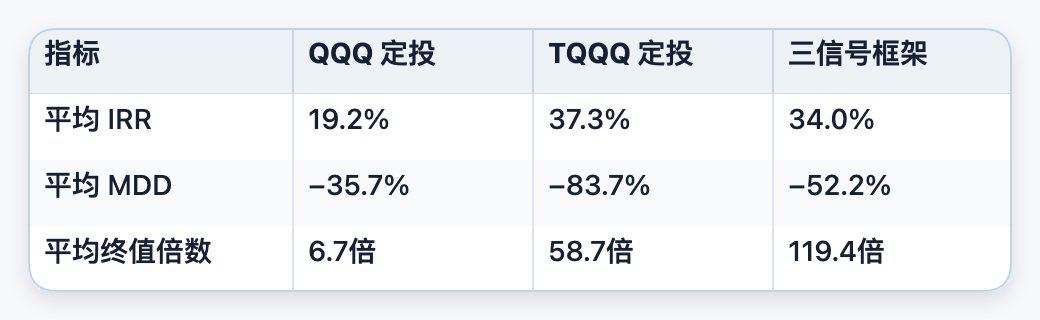
· Compared to QQQ: IRR increased from 19.2% to 34.0% (+77%), final value multiple surged from 6.7 times to 119.4 times (about 18 times); the cost was a deepened drawdown from -36% to -52%, a trade-off acceptable for those willing to use leverage.
· Compared to TQQQ: Only a slight decrease of around 3.3 percentage points in annualized return (from 37.3% to 34.0%), but the drawdown narrowed from -84% to -52% (a 32-point moderation), exchanging a nearly halved drawdown for returns close to TQQQ.
Why did the drawdown decrease so much while the return didn't drop much? It's because the three signals concentrated buying on the major bottoms that were cheap, deeply discounted, and panicked (even going all-in on TQQQ in the double lows with both cash and ammo), and then stopped buying at the highs to avoid leverage decay. The same amount of money was thus invested in better positions, dodging the most toxic downturns. Over a long timeframe including a full bear market cycle (2000/2005/2010), this market timing allowed it to outperform naked TQQQ in final value; over shorter periods without encountering major bottoms (2015/2020), it traded slightly lower returns for shallower drawdowns. So, don't take outperformance over TQQQ in final value as a common rule; it only holds true in long cycles and when crossed by major crashes.
In short: throughout the entire sample period from 2000 to 2026, the three-signal framework generally outperformed simple QQQ DCA, as well as naked TQQQ.
So what about now?
The above conclusion has one premise: a long enough timeframe, with one major crash. By this point, you might naturally ask, as it's now the middle of 2026 and CAPE is likely still at a high level. What will happen if you enter the market now?
Honest answer: in periods like 2015/2020, where it's also a "high entry, no major bottom yet" scenario, the three-signal framework's end-of-period assets are about 0.9 times that of QQQ. Almost all excess returns come from crisis bottom-fishing. Without a major bottom, its conservatism (not chasing highs, reducing exposure) becomes a net drag.
But this is exactly the purpose of this framework. It doesn't bet on "the major bottom will definitely come"; it bets on "the major bottom will always come." The bullets saved during overvaluation periods are prepared for that moment that no one knows when it will occur, but will definitely happen. We don't need another 2008; a correction of over -30% is enough to trigger the signals, allowing all the accumulated ammunition to be fired into the market.
If you believe the U.S. stock market won't experience any substantial corrections in the next ten years, then pure QQQ or even naked TQQQ is better than it. If you think that's unlikely, then this set of rules is designed for you.
Final Practical Advice
1. Simply dollar-cost averaging into QQQ is not the optimal solution. As an ultra-simple long-term strategy, it is perfectly acceptable, but in terms of IRR and terminal value per unit of maximum drawdown, it represents a conservative baseline rather than the most efficient option.
2. Treat TQQQ as a high-octane satellite position, not as the main focus. Its returns are indeed attractive, and dollar-cost averaging can even mitigate the risk at the entry point. However, the average drawdown of -84% demands a level of resilience that is unrealistic for most individuals. TQQQ is better suited as a high-octane fuel to be deployed under systematic risk control and conditionally released based on signals, rather than constituting 100% of the core portfolio.
3. The true core strategy involves a three-signal framework:
· QQQ as the Core: Buy by default when there is no extreme signal, determining your baseline return and maximum drawdown limit;
· TQQQ as the Booster: Allocate heavily only when it is cheap, experiencing a deep correction, or resonating with market panic. During normal times, maintain it within the lower and upper position limits to avoid both missing out and overexposure;
· Ammunition Reserve as the Cushion: During periods of high market valuation (especially when the CAPE is above 85%), gradually reduce exposure to TQQQ, lock in profits into cash or stablecoins, and wait until a true low point signal emerges before redeploying.
The outcomes of this approach (backtested from 2000 to 2026 with five starting points): significantly increase long-term returns and terminal value compared to just dollar-cost averaging into QQQ, while reducing drawdowns by a third compared to a full TQQQ allocation with almost no loss in returns. Minimize reliance on human emotions and rely more on rules.
Original Article Link
Welcome to join the official BlockBeats community:
Telegram Subscription Group: https://t.me/theblockbeats
Telegram Discussion Group: https://t.me/BlockBeats_App
Official Twitter Account: https://twitter.com/BlockBeatsAsia

 Related Articles