IOSG: Rented Trust, How Much of the Bitcoin ETF Inflow Is Real Money?

Original Title: "IOSG Weekly Brief | Leased Faith: How Much of the Bitcoin ETF Flow Is Real Money #332"
Original Author: Darko, IOSG Ventures
TL;DR
1. On a weekly basis, the ETF flow is mainly driven by a hidden arbitrage trade rather than faith. Cash-and-carry traders buy the ETF while shorting futures on CME to hedge price risk, but this cannot be distinguished from true believers in the data. Around half of the weekly flow's fluctuation can be explained by the addition of new short futures positions by hedge funds, with a high correlation of 0.70.
2. The weekly price movement of Bitcoin hardly explains the flow of funds. Trying to predict ETF flows using price returns yields statistically insignificant results. The weekly funds are not chasing price performance but moving in sync with a hedged rate trade.
3. Arbitrage dominates the weekly "volatility" but is never the main driver of "stock." Out of the approximately $55 billion cumulative inflows into the ETF, the net amount from arbitrage trades is only about $1 billion; the rest is stable, directional buying pressure of around $400 million per week, which has almost entirely constituted the entire "mountain" over a two-year compounding period.
4. The correct statement is: ETF fund flow overestimates the "volatility" of faith, not its "level." Most of the weekly ups and downs are "leased"—arbitrage capital comes and goes; while the assets that truly settle are mostly "owned."
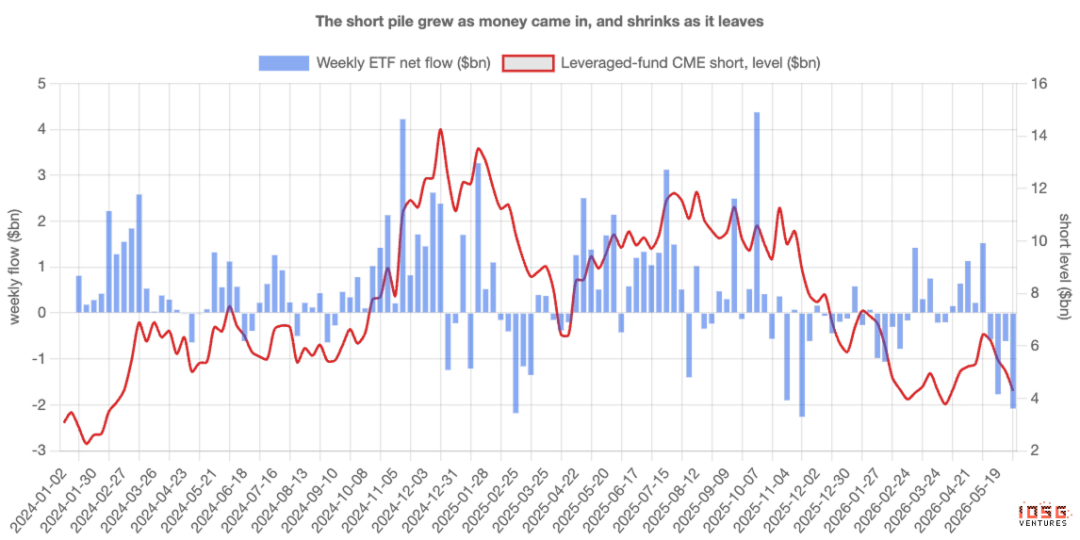
5. This trade is unwinding after two years. Leveraged fund short positions surged from around $3 billion at issuance to about $14 billion by the end of 2024, then steadily decreased to around $4.5 billion. Once the spread compresses to be unprofitable, inflows and shorts will retreat in tandem—do not misinterpret the resulting outflow as the market passing judgment on Bitcoin.
The Number Everyone Watches
Every week, Bitcoin ETFs disclose how much money has flowed in or out, a number often treated as a verdict. Large inflows signal institutional influx; outflows indicate shaken confidence. Fund flow data has quietly become a headline indicator of market faith.
The issue is that not all buyers of the ETF are betting on Bitcoin. Some of the largest buyers are not concerned about which way the price moves—once you account for them, the weekly fund flow numbers measure more of their activity rather than anyone's belief. To understand why, you first need to meet a completely different class of buyer.
A Price-Indifferent Buyer
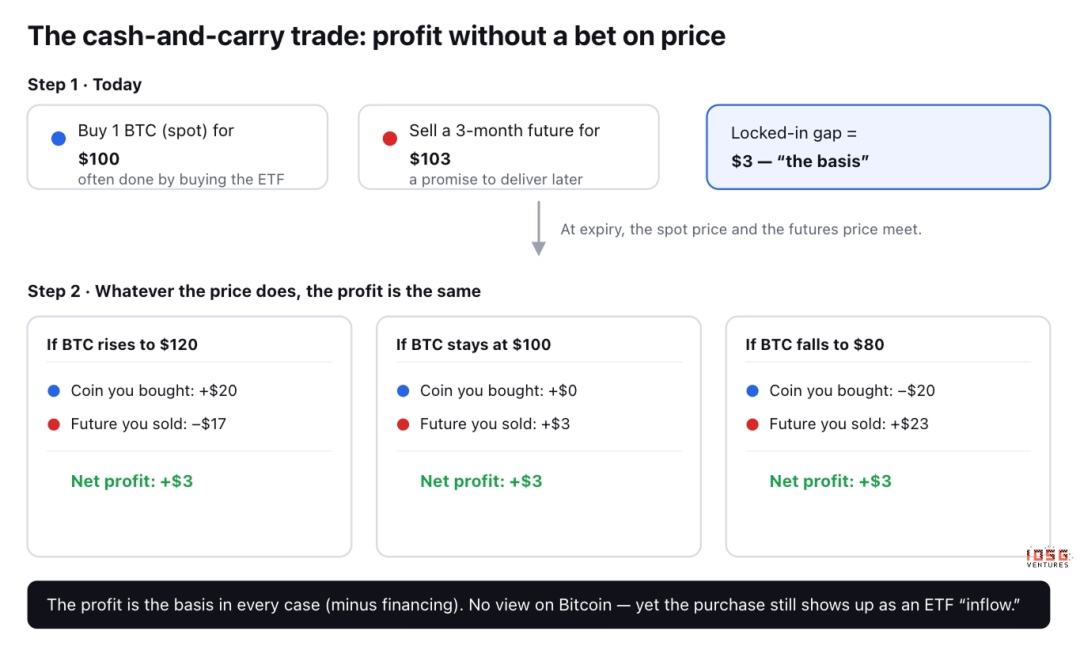
There is a classic yet mundane trade called cash-and-carry arbitrage. Bitcoin "futures" are simply contracts to buy or sell Bitcoin at an agreed price on a future date, and most of the time, the futures price is slightly higher than the current spot price: for example, Bitcoin is $100 now, but a contract expiring in three months is selling for $103.
Traders can take advantage of this price discrepancy without holding any view on the price:
· Buy 1 Bitcoin today for $100 (often done through buying an ETF).
· Sell the futures contract at $103, with delivery promised in three months.
Let's see what happens at expiry. If Bitcoin spikes to $120, the trader makes $20 on the coin but loses $17 on the contract: a net gain of $3. If it plunges to $80, they lose $20 on the coin but gain $23 on the contract: still a net gain of $3. If it stays the same, it's still $3.
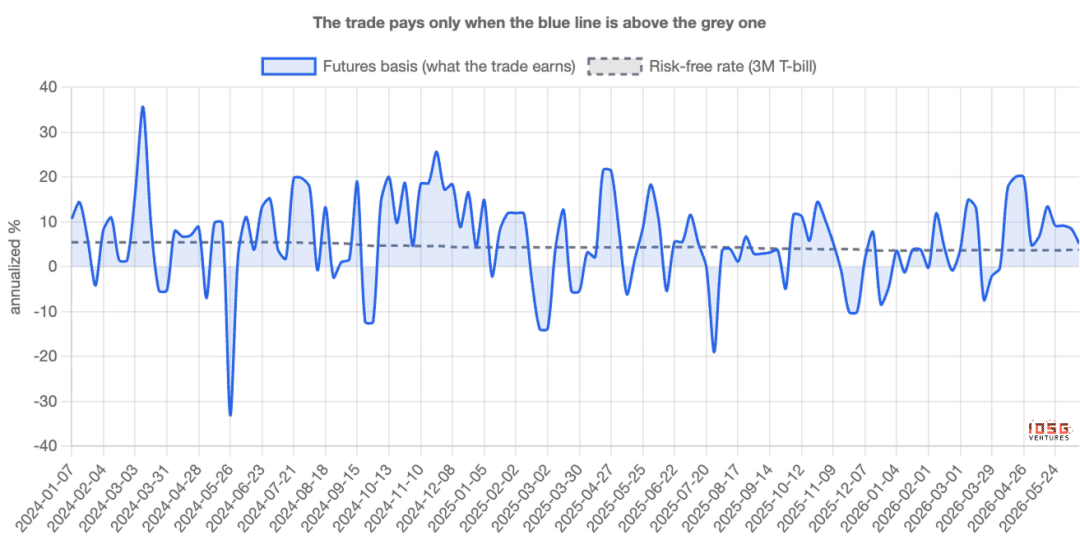
In any scenario, the profit is the same. The direction is hedged out, and the trader is said to be "delta-neutral." This $3 price difference, when annualized, is the basis: essentially the return the trader earns for parking their capital in this trade; as long as it's higher than the risk-free return from parking the money in a US Treasury bill, this trade is worthwhile.
Why This Pollutes Headline Numbers
The key here is the first leg:
Buying 1 Bitcoin
A very common way to do this is by buying an ETF. Therefore, a price-indifferent trader doing delta-neutral trades ends up showing up as an ETF inflow in the data, making them appear no different from true believers on the surface.
When a large amount of basis trading is established, the inflow of funds appears strong, giving rise to the narrative of “institutions are accumulating”: although these funds are hedged, they will immediately reverse once the trade is no longer profitable.
In other words, the fund flow metric measures not only belief, it measures the activity level of arbitrage traders. The question is how to separate the two: and how much each accounts for.
How to Distinguish Between Them
Basis traders leave a second footprint. For every $1 worth of Bitcoin they buy, they short $1 worth of futures on the CME (a regulated U.S. exchange where institutions trade Bitcoin futures). True believers leave only the first footprint; arbitrageurs leave both.
And the second footprint is public. The U.S. derivatives regulator releases a report every week, disclosing the long and short positions of various traders on the CME. One category: leveraged funds, essentially hedge funds; the very congregation of basis traders.
So, you can compare the weekly inflow of funds into the ETF with the new short positions established by these funds. If the “demand” is indeed belief, the two should not be closely related; if a large part of it is that hidden trade, they should move in the same direction.
What the Data Says: Weekly, Fund Flow Follows Futures, Not Price
They move closely in tandem. Every week since the ETF’s launch, the week with more added futures shorts saw more inflow into the ETF: almost one to one. In the entire weekly fund flow fluctuation, about half can be explained by just this: how much shorts the funds made. The correlation is 0.70, the strength of relationship you would see between two things clearly related, not by chance.
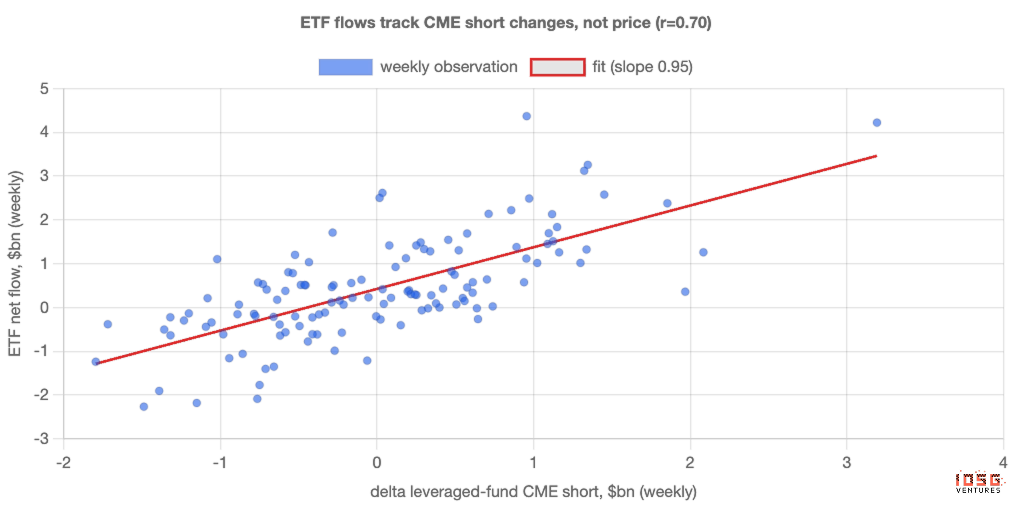
One point that should alert believers the most: the price itself explains almost nothing. Checking whether Bitcoin returns for the week can predict ETF fund flow, the answer statistically cannot be distinguished from zero. Weekly funds are not chasing performance; they are moving in lockstep with a rate trade that has been hedged.
Therefore, as a weekly signal, ETF “demand” is primarily arbitrage. The fund flow metric is a poor thermometer of belief because its fluctuations are the result of the basis trade being toggled back and forth, not of anyone changing their view on Bitcoin.
But How Much of the Funds Are Actually in This Trade?
It is here that the blunt argument, "it's all fake," no longer holds water, and the true story is far more interesting. The basis trading, while driving weekly fluctuations, has never been the main driver of the funds.
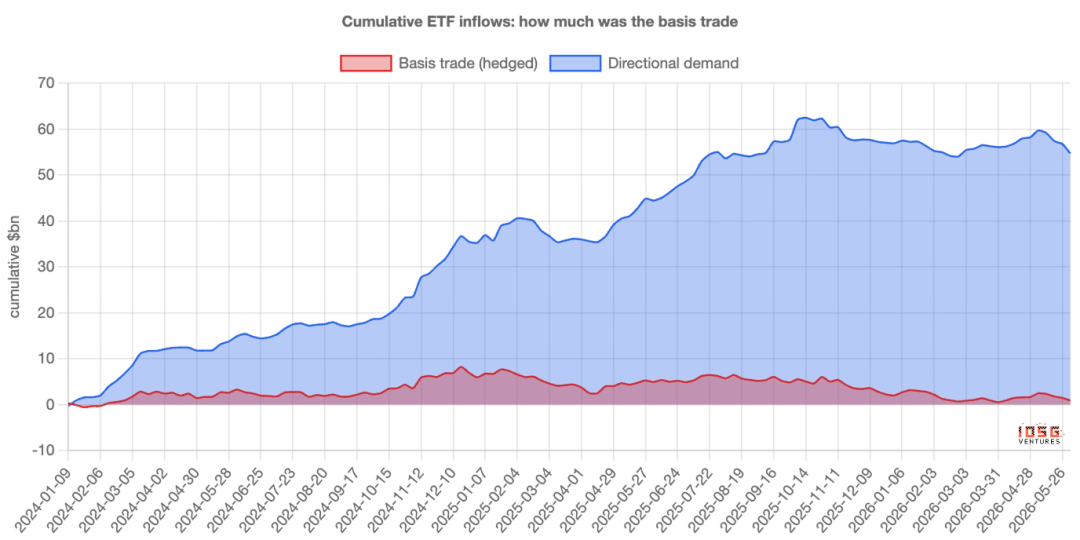
Breaking down the weekly inflows into the part explainable by futures shorting (hedging) and the rest (directional), then cumulating it since inception. Out of the approximately $55 billion cumulative inflows into ETFs, the current net amount attributed to basis trading is only about $1 billion: the rest is stable, directional buying pressure. This buying pressure is about $400 million weekly, week after week, compounding over two years, almost becoming the entirety of the mountain regardless of basis or price.
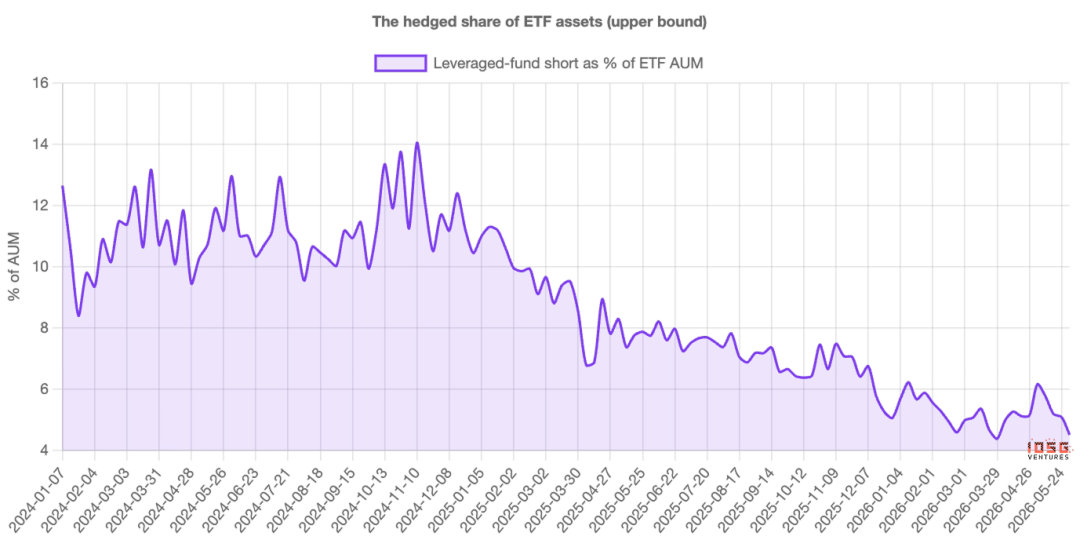
Looking at it in terms of asset allocation rather than fund flows, the picture is the same: the hedging part neared 14% of ETF assets in 2024, now around 4%-5%.
What was once a significant peak is now just a small portion.
So, a more accurate statement would be: ETF fund flows overstate the volatility of faith, not its magnitude. The weekly ups and downs are mostly "borrowed": leveraged capital comes and goes; but the assets that actually stay are mostly "owned." This trade may swirl around in fund flow data, but it has never been the mainstay of the balance.
And This Trade Is Exiting
The hedging part has not only always been relatively small in scale: it has been contracting over two years. The short positions of leveraged funds, which piled up to around $3 billion at inception, peaked around $14 billion by the end of 2024, then steadily declined to about $4.5 billion. This arbitrage trade has been unwinding throughout the range, not just recently.
This is crucial to understanding the current situation. As we entered June, hedge positions more or less halved again, with fund shorts shrinking from around $6.4 billion to $4.3 billion, while ETFs were seeing outflows of $300 million to $500 million daily. At face value, this may look like panic capitulation. However, combined with futures data, it is merely the routine clean-up of a no longer profitable carry trade. The same outflow numbers, two completely different stories.
As Basis Narrows, Demand Wanes
The cleanest signal is what happens when this trade is no longer profitable. When that $3 spread tightens to near the level where a trader can no longer earn a risk-free profit, the trade is no longer worth it.
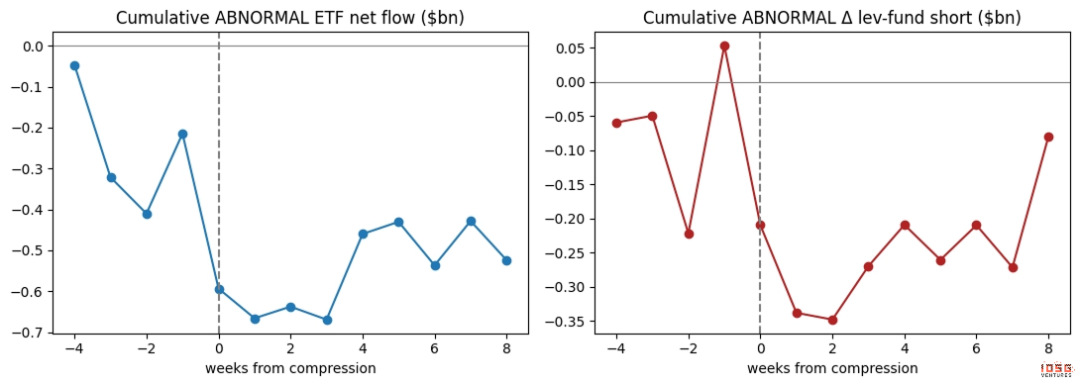
If a significant portion of weekly demand is indeed this trade, then weekly demand should weaken just as the basis narrows: and so it has. Stripping each sequence of its trend, observing moments before and after a compression: ETF inflows break below their normal pace, funds simultaneously fill shorts, both happening in sync. Demand breathes with the trade.
True believers do not care about futures basis. But this weekly "demand" obviously does.
Who Comes First, Who Comes Last, Who is Really Driving
First, this relationship is simultaneous: tightest within the same week, no clear leading or lagging; and the only directional evidence actually points in the opposite direction: ETF inflows driving shorts, not the other way around. This aligns with a logic of paired trades: buying ETF first, futures hedging following, rather than shorting out of thin air to match inflows.
Second, arbitrageurs are not the sole drivers. Flows and leveraged fund shorts move most closely, but they also resonate with directional institutional holdings: both types of buyers are active. The contention of this article is not that every inflow is a hedge; it is to say that hedged trading is the tightest, most reliable driver through weekly fluctuations.
Ethereum: Same Trade, but Almost Countless Accounts
Applying the same scrutiny to Ethereum ETFs, the pattern persists, but weaker: the link to futures shorts is looser, and the stable underlying buying is almost non-existent. The reason is clear.
Holding spot Ethereum instead of futures means giving up the staking yield Ethereum offers, about 3%-4% annually. Deducting this part, Ethereum's basis is often negative: arbitrage trades often cannot surpass its breakeven threshold. Therefore, Ethereum ETFs have neither strong faith-driven buying nor robust arbitrage positions support; they are just smaller and noisier versions of Bitcoin-related counterparts.
How to Interpret ETF Flows from Now On
The key is not to judge the price, but a method of interpreting fund flows. When the basis is generous, the expected "institutional demand" will appear strong and largely hedged: do not mistake this strength for faith. When the basis compresses, expect fund inflows and shorts to diminish together: do not misinterpret the resulting outflows as the market passing judgment on Bitcoin.
Two key numbers to watch are: the annualized futures premium relative to the T-bill rate, and the weekly net shorts of leveraged funds in the CME report. They will tell you how much of the next "demand" headline is real.
How We Calculated This
A couple of honest caveats. The basis is constructed from the CME futures contract for the nearest month to spot and excludes the last few days before expiry each time (whose very short lifespan amplifies rounding errors into false spikes); constructing the series contract by contract could sharpen the exactitude of the number but not the conclusion.
The relationship between fund flows and shorts is a strong co-ordination rather than proof that one causes the other: the point being they're two halves of the same trade. The futures short number is an upper bound on the ratio of ETF buying hedged, as some of the shorting is reallocation from elsewhere in the portfolio.
None of this changes a core. On a week by week basis, the "demand" for Bitcoin ETFs is largely an occulted rate trade rather than a faith: the fund flows measure the degree of arbitrage participation, which is far more accurate than measuring conviction. And that real buying has been genuine and patient, most of which remains, as the "bought on lease" portion has spent two years each to go back where they came from.
Original Article Link
Welcome to join the official BlockBeats community:
Telegram Subscription Group: https://t.me/theblockbeats
Telegram Discussion Group: https://t.me/BlockBeats_App
Official Twitter Account: https://twitter.com/BlockBeatsAsia