What is the latest WALL STREET NACHO Trade?

In Wall Street, the 'TACO Trade' is out, and now everyone is discussing a new trading pattern called 'NACHO'.
Since the U.S. airstrike on Iran on February 28, the Strait of Hormuz has not reopened. Now, the oil price has risen over 50% from pre-war levels, the Fed's 2026 rate cut expectations have been squashed from 2 cuts pre-war to 0 cuts. However, at the same time, the S&P 500 has hit a new all-time high, rallying for 6 consecutive weeks, marking its longest winning streak since 2024.
Wall Street has coined a name for this seemingly contradictory market state, calling it NACHO, which stands for 'Not A Chance Hormuz Opens', indicating there is no chance of the Strait of Hormuz reopening. It is the antithesis of TACO (Trump Always Chickens Out), where TACO bets on 'people chickening out', expecting Trump to back down at a crucial moment. NACHO bets on 'events being deadlocked', implying that this time the opening of the Hormuz Strait cannot be resolved with just one Truth Social post.
eToro market analyst Zavier Wong described this shift as follows: "Throughout most of the crisis, every ceasefire headline would trigger a sharp drop in oil prices, with traders continuously betting on a solution that never materializes. NACHO signifies the market's recognition that high oil prices are not a one-off shock but rather a feature of the current market environment itself."
Two Lines in Early April
March 23 was the tipping point for the TACO pattern. On that day, Trump announced a "very good and constructive dialogue" with Iran on Truth Social in the morning, ordering the Pentagon to pause strikes on Iranian energy facilities for 5 days. S&P 500 futures rebounded nearly 4% from the low within minutes, adding $1.7 trillion in market value instantly. Brent crude plummeted from $109 to $92 during trading hours.
Then Iranian officials denied the existence of the dialogue. According to Iranian state media, a "senior security official" called it market manipulation, stating the dialogue never happened. The gains were halved within two hours, with the S&P closing up only +1.15%, and Brent rebounding to $99.94.
For the first time in 14 months, Trump's "backing down" no longer worked on the market. The reason is not complicated; under the TACO pattern, backing down is one-sided, achievable with just one post. The retreat on March 23 required Iranian cooperation. When the opponent does not cooperate, the retreat turns into a lie.
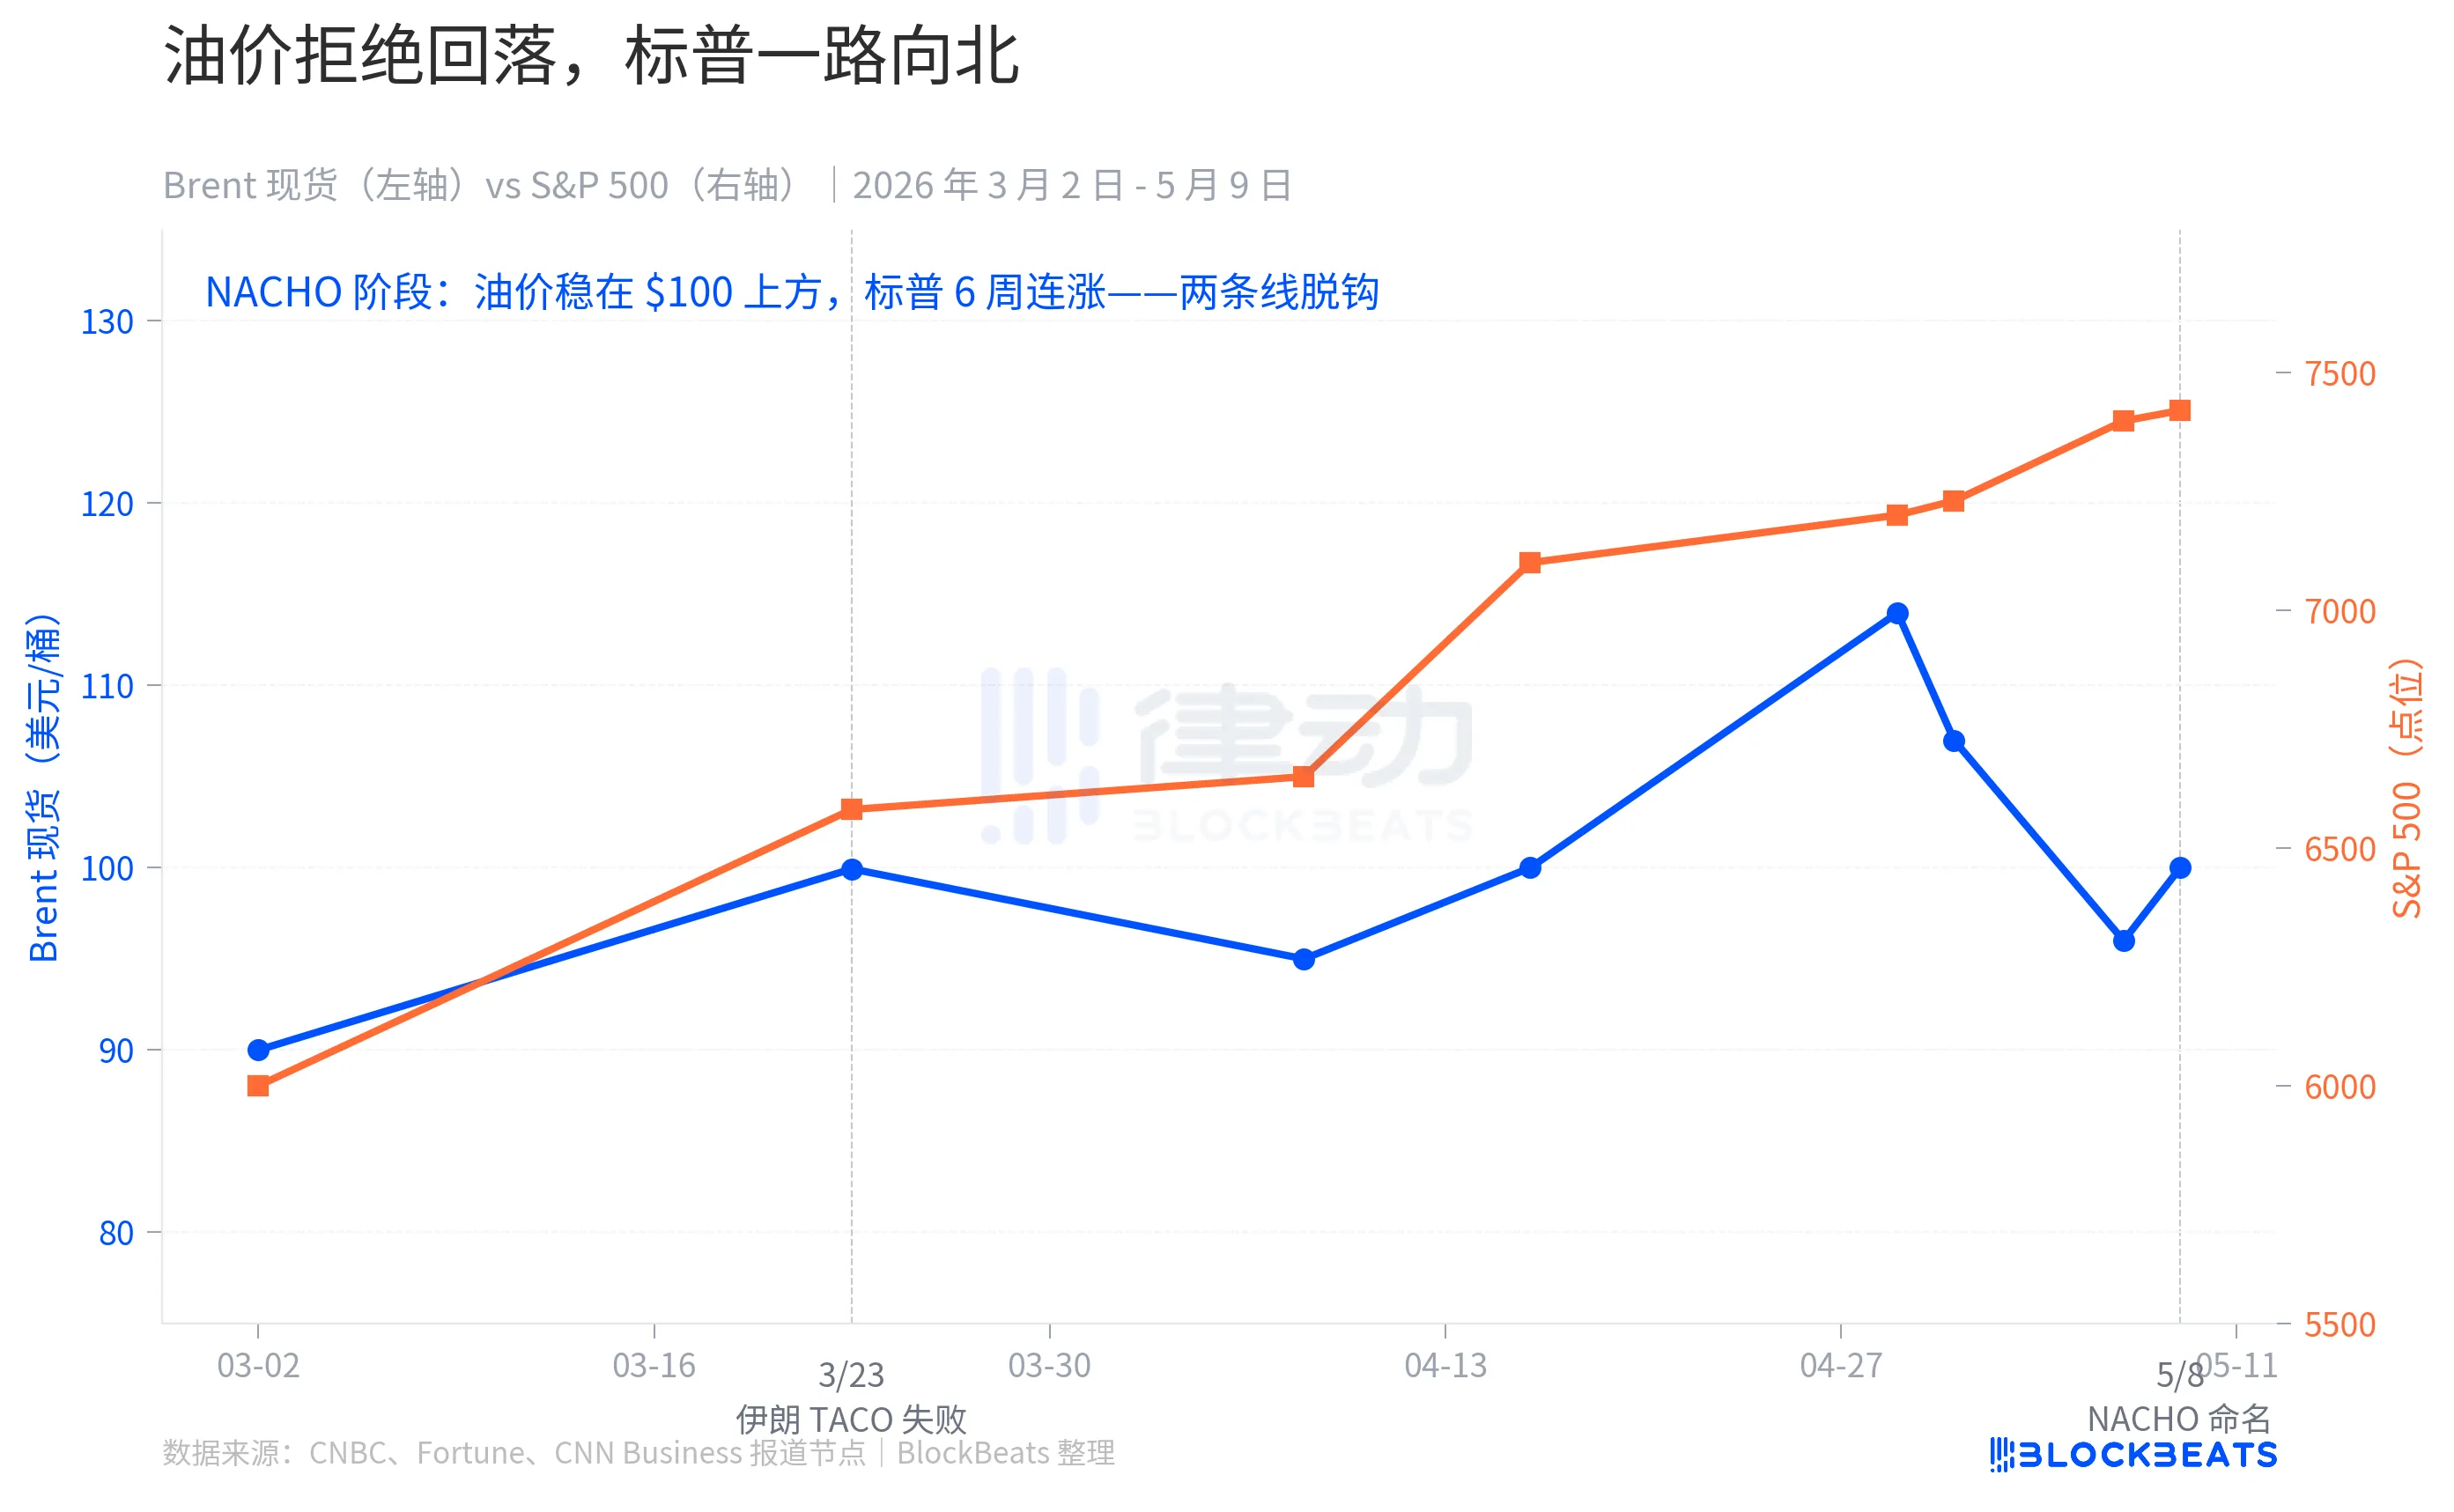
From that day on, market dynamics underwent a fundamental shift. Brent crude never fell back to pre-war levels in the following 6 weeks, with the May average price still holding at $109.57. Events included the April 7th and 8th US-Iran ceasefire agreement, oil prices briefly returning to "pre-war levels" on April 17th, and news on May 7th of the US-Iran nearing an agreement, yet each "ceasefire headline" failed to bring oil prices back to baseline.
However, the S&P kept climbing. It surged 10% in April, marking the strongest month since November 2020, reaching 7 new intraday all-time highs during the period. On May 1st, it broke through 7,230 points intraday, closing at 7,398 on May 7th.
The two lines completely decoupled in early April. During the TACO era, they moved in unison, with a threat causing oil and the S&P to fall and a retreat prompting oil and the S&P to rebound. In the NACHO era, they spoke two different languages, with oil indicating "the Hormuz situation is over" while the S&P said, "It's not my concern."
Three Markets, Three Reactions
NACHO isn't just empty talk; it's three independent derivatives markets putting real money down on the same bet.
The first layer is insurance. According to historical data from the Strauss Center, the war risk premium for the Hormuz Strait has spiked to 3.5% of vessel value during the 2003 US invasion of Iraq, and reached 7.5% during the peak of the 1984 Iran-Iraq "Tanker War" after the attack on the Yanbu Pride oil tanker. The baseline before this crisis was 0.125% to 0.25%. By early May, this rate had already reached the 1% range, with some types of insurance soaring to 3% to 8%.
In terms of insurance costs for a single Very Large Crude Carrier (VLCC) transit, the cost has jumped from around $250,000 pre-war to $800,000 to $8 million currently. The role of insurance companies is to price risk, and the significance of this layer's assumption is that if insurers refuse to provide coverage, shipowners won't take on the risk of transit without insurance. The "physical openness" of the strait and the "de facto navigation" through it are two different matters.
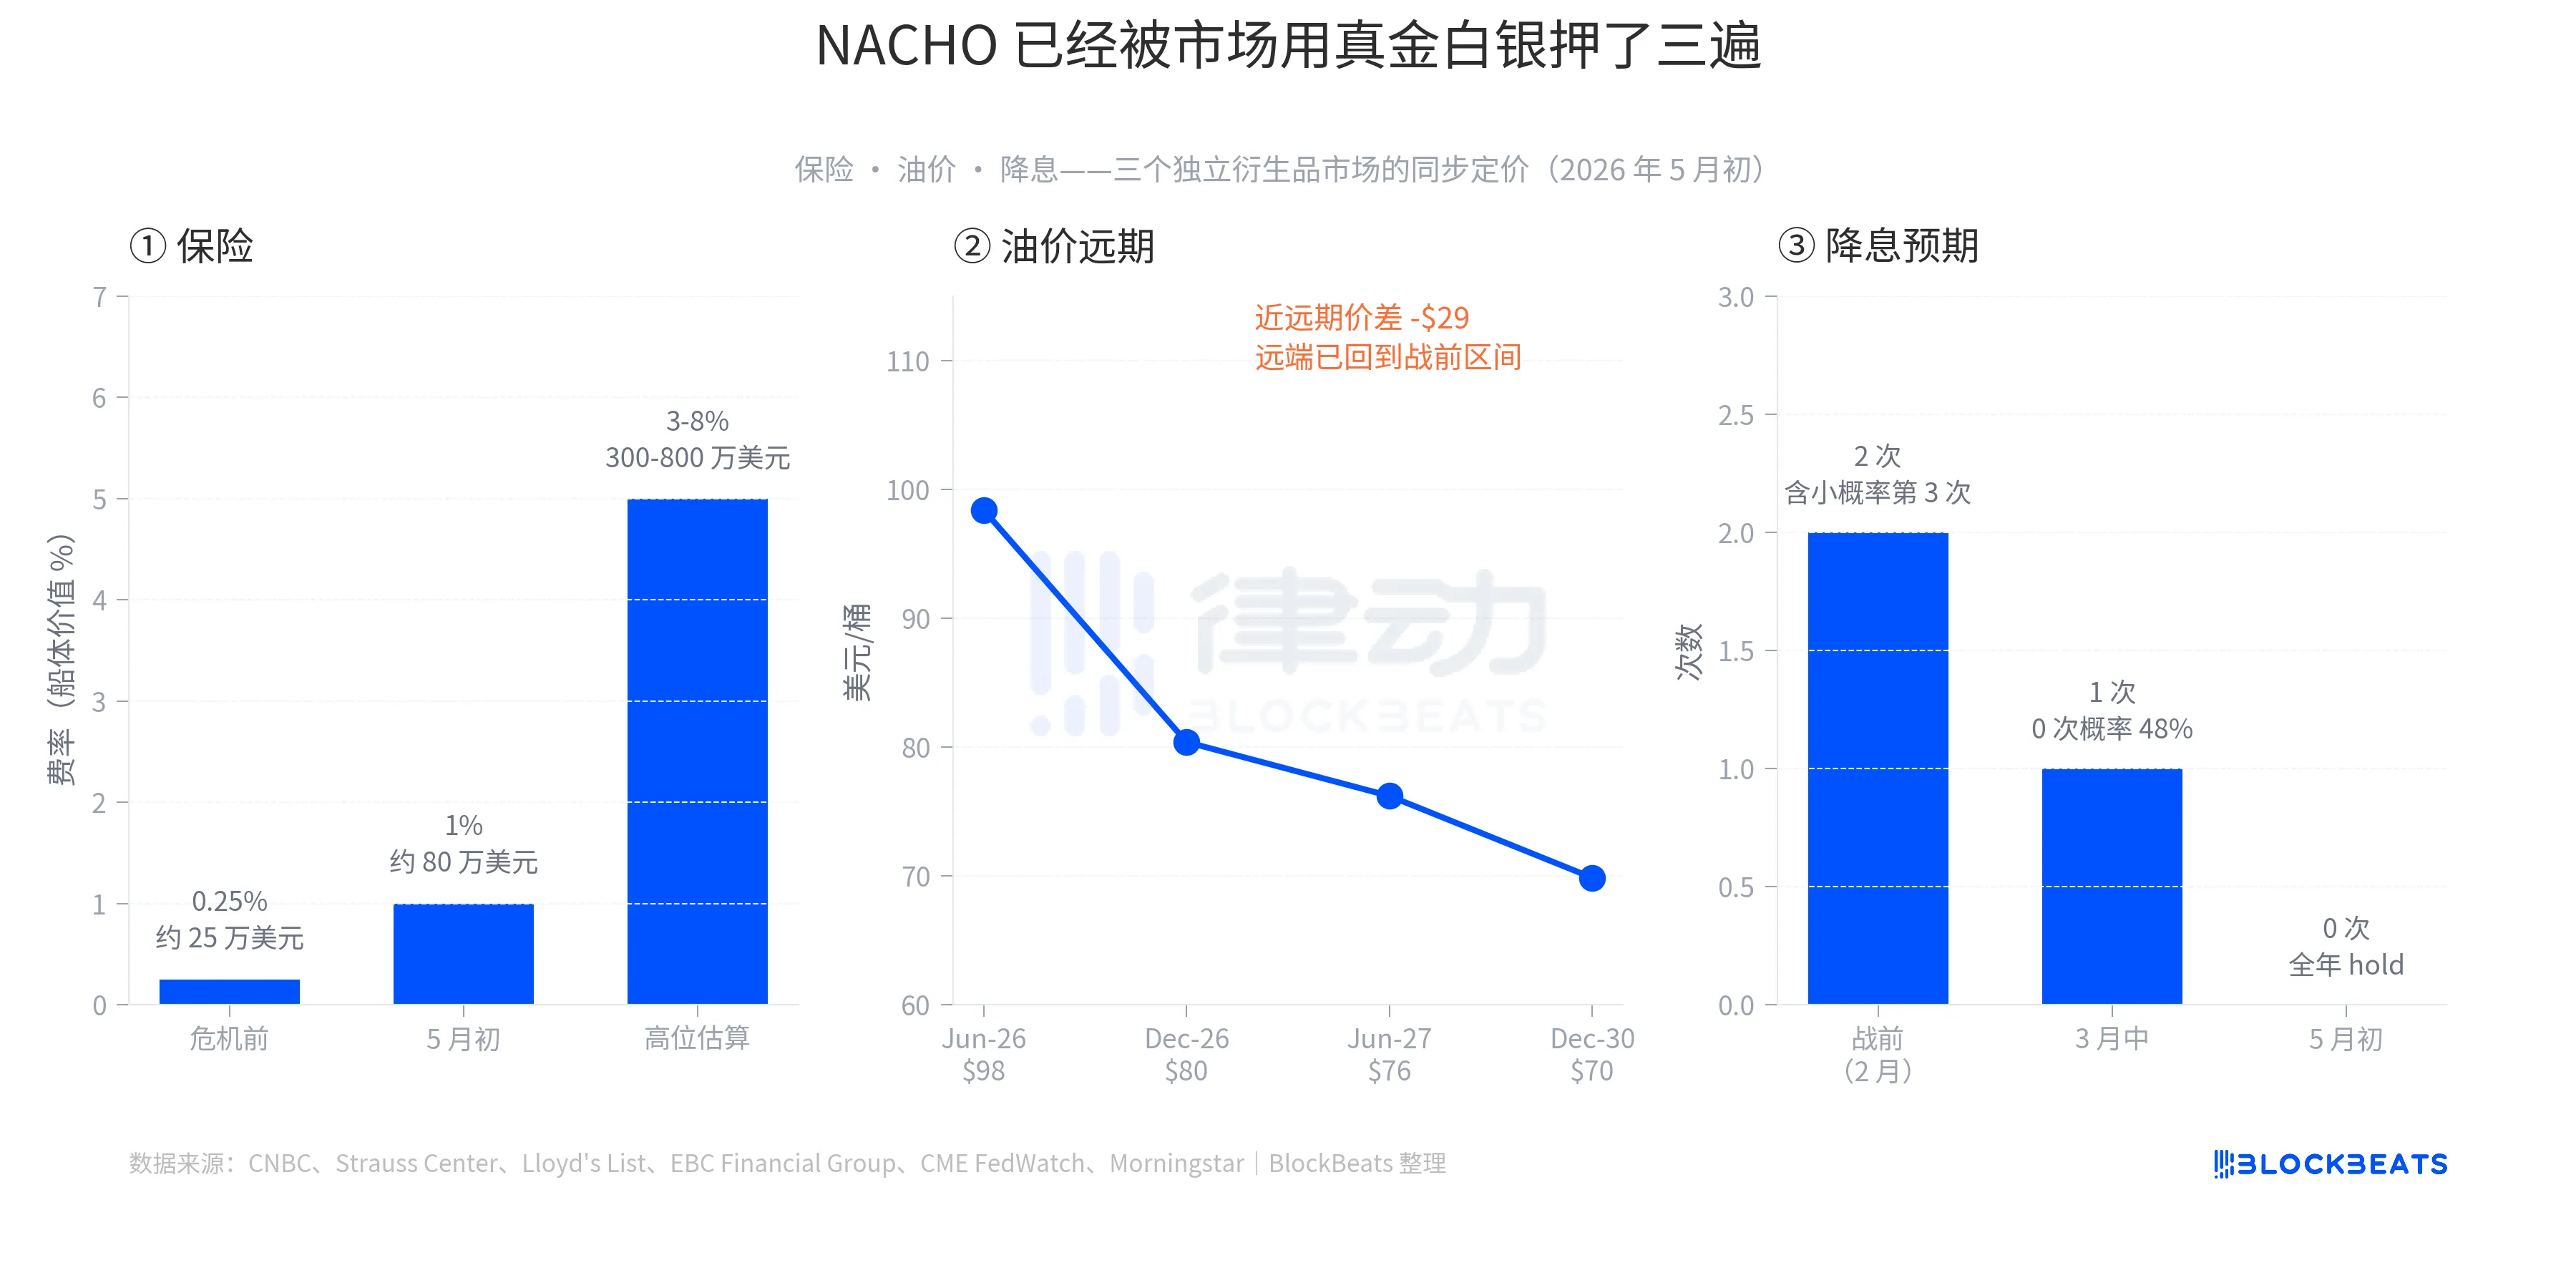
The second layer is oil prices. Data from early May shows the Brent Jun-26 contract at $98.41, Dec-26 at $80.39, Jun-27 at $76.20, and Dec-30 at $69.85. The near-month to Dec-30 price difference is around $28.5, one of the steepest contango (near-term higher than far-term) structures in the past 5 years. This curve tells a very specific story - the market believes that the spot market is tight but will eventually ease, with the forward prices returning to the $60 to $70 range pre-war. In other words, the high oil prices are not a final outcome but a window with boundaries. Yet, this window is long enough to prevent traders from betting on a sudden end.
The third layer is a rate cut. In early February 2026, the market expected the Fed to cut rates twice during the year, with a slight probability of a third cut. In mid-March, after the surge in oil prices, the probability of one rate cut decreased to 48%, and the probability of no cuts increased. On April 29, the Fed kept the rate unchanged at 3.50% to 3.75%, and on May 6, the CME FedWatch showed a 70% probability of no rate cut at the June meeting. The market has already priced in zero rate cuts for 2026. Hedge fund legend Paul Tudor Jones even said in an interview on CNBC on May 7, "There's no chance for the Fed to cut rates."
All three layers have left their mark on the derivatives market, not as a narrative, but as real actions.
Fragmented Market
The second detail of NACHO that is not easy to see is that it has already caused divergence within the market.
As of the close on May 7, the Energy sector ETF (XLE, State Street's Energy Select Sector Fund) has seen a year-to-date gain of 31.63%, the only major sector to rise throughout 2026. During the same period, the S&P 500 has risen by about 24%. The Transportation sector ETF (IYT, iShares U.S. Transportation Fund) has only seen a year-to-date gain of 8.79%, lagging behind the market by over 15 percentage points.
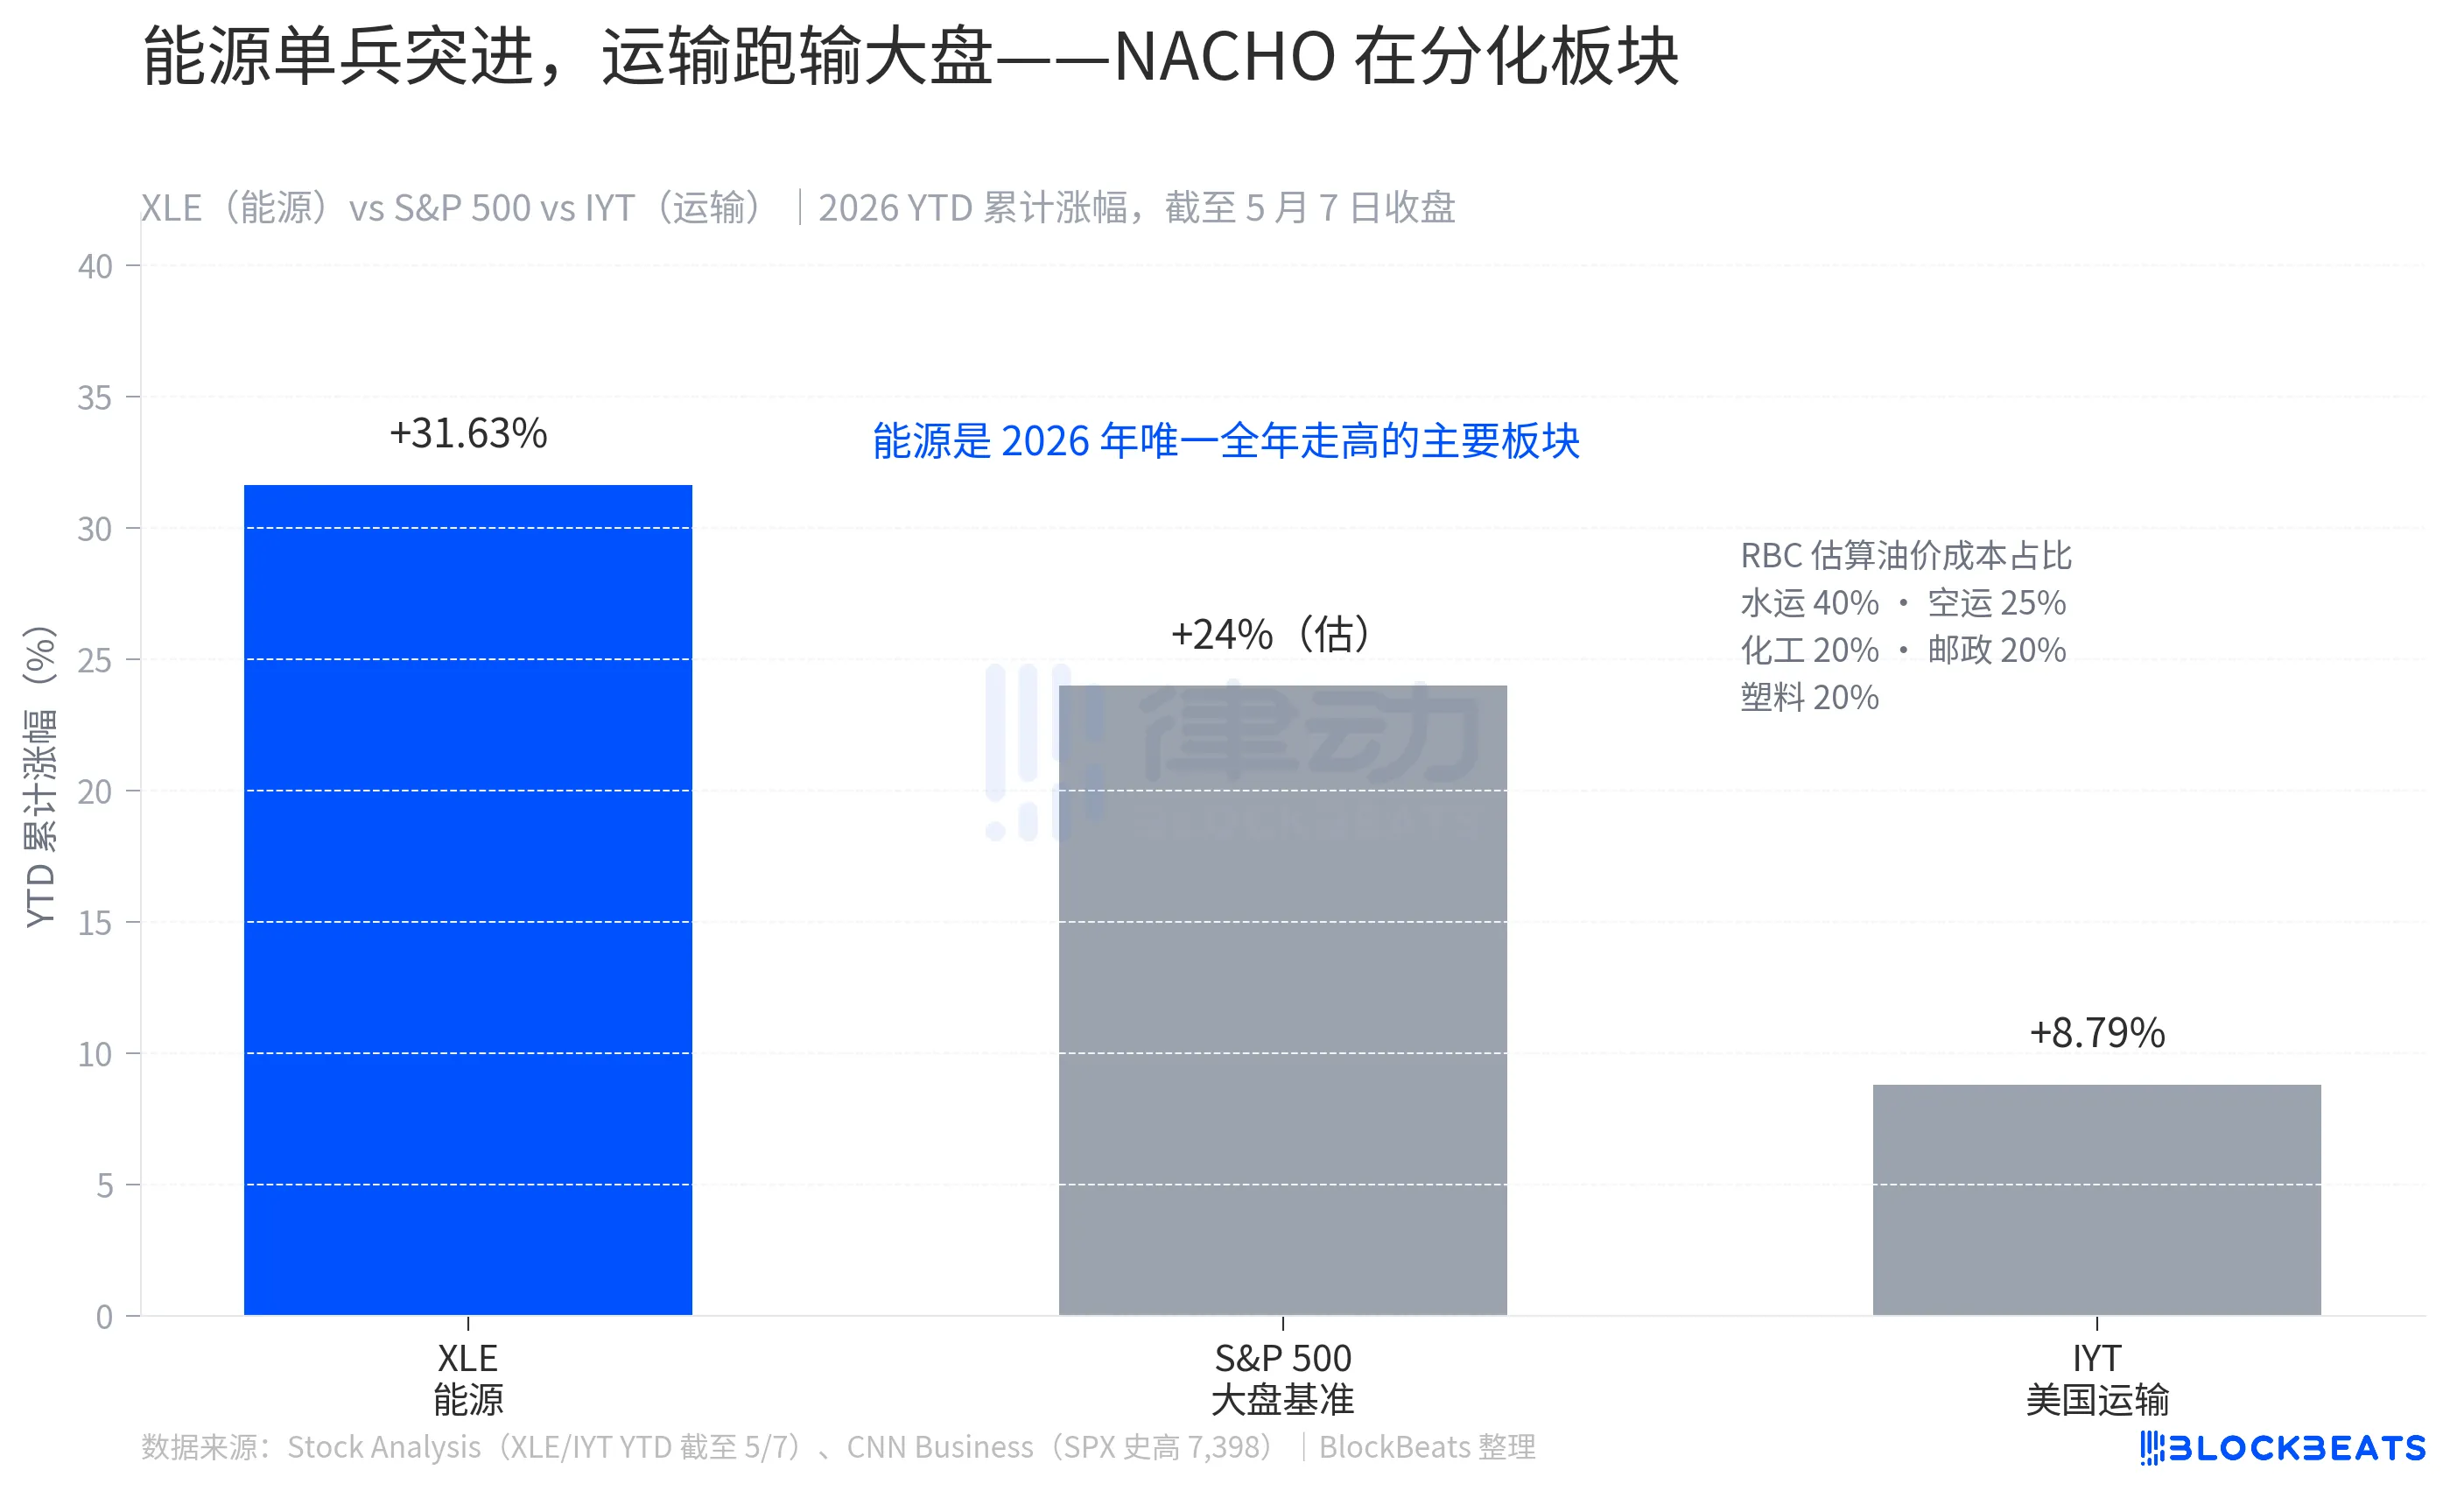
This gap is not random. According to estimates from RBC Capital Markets, oil accounts for 40% of the operating costs in the maritime industry, 25% in aviation, and 20% in chemicals, postal services, and rubber and plastics each. If oil is a significant part of your business's cost structure, NACHO will directly impact you.
The 31.63% gain for XLE is not a short-term bounce but the result of outperformance over 8 weeks. The 8.79% gain for IYT is not weakness but a situation where it is partially offsetting gains due to oil price movements while also moving with the overall market. The market has clearly shown readers how NACHO calculates the odds; just look at how much the Transportation ETF lags behind the market.
However, NACHO is not an indefinite bet; it has a very specific deadline, June 1.
According to J.P. Morgan's commodities research team, at the beginning of 2026, global commercial crude oil inventories were about 8.4 billion barrels, of which only around 0.8 billion barrels are "actually usable," while the rest are part of routine operations such as pipeline filling, tank bottom storage, and minimum end-of-line storage to maintain the system. Since the start of this crisis, around 280 million barrels have been used, leaving approximately 520 million barrels of usable inventory. J.P. Morgan stated, "Commercial inventories are expected to approach operational stress levels by early June."
The concept of "Operational Floor" is a specific physical concept. JPMorgan's explanation is that "the system will not collapse because oil is running out, but will collapse because the circulation network no longer has enough throughput." Once this threshold is crossed, businesses and governments only have two options: either squeeze the minimum inventory that must be maintained (which will damage the infrastructure itself), or wait for additional supply. If the Strait of Hormuz remains closed until September, OECD commercial inventories could fall to the so-called "operational floor." According to Fortune, European aviation fuel stocks are expected to fall below the 23-day supply threshold as early as June, which is a critical industry alert line.
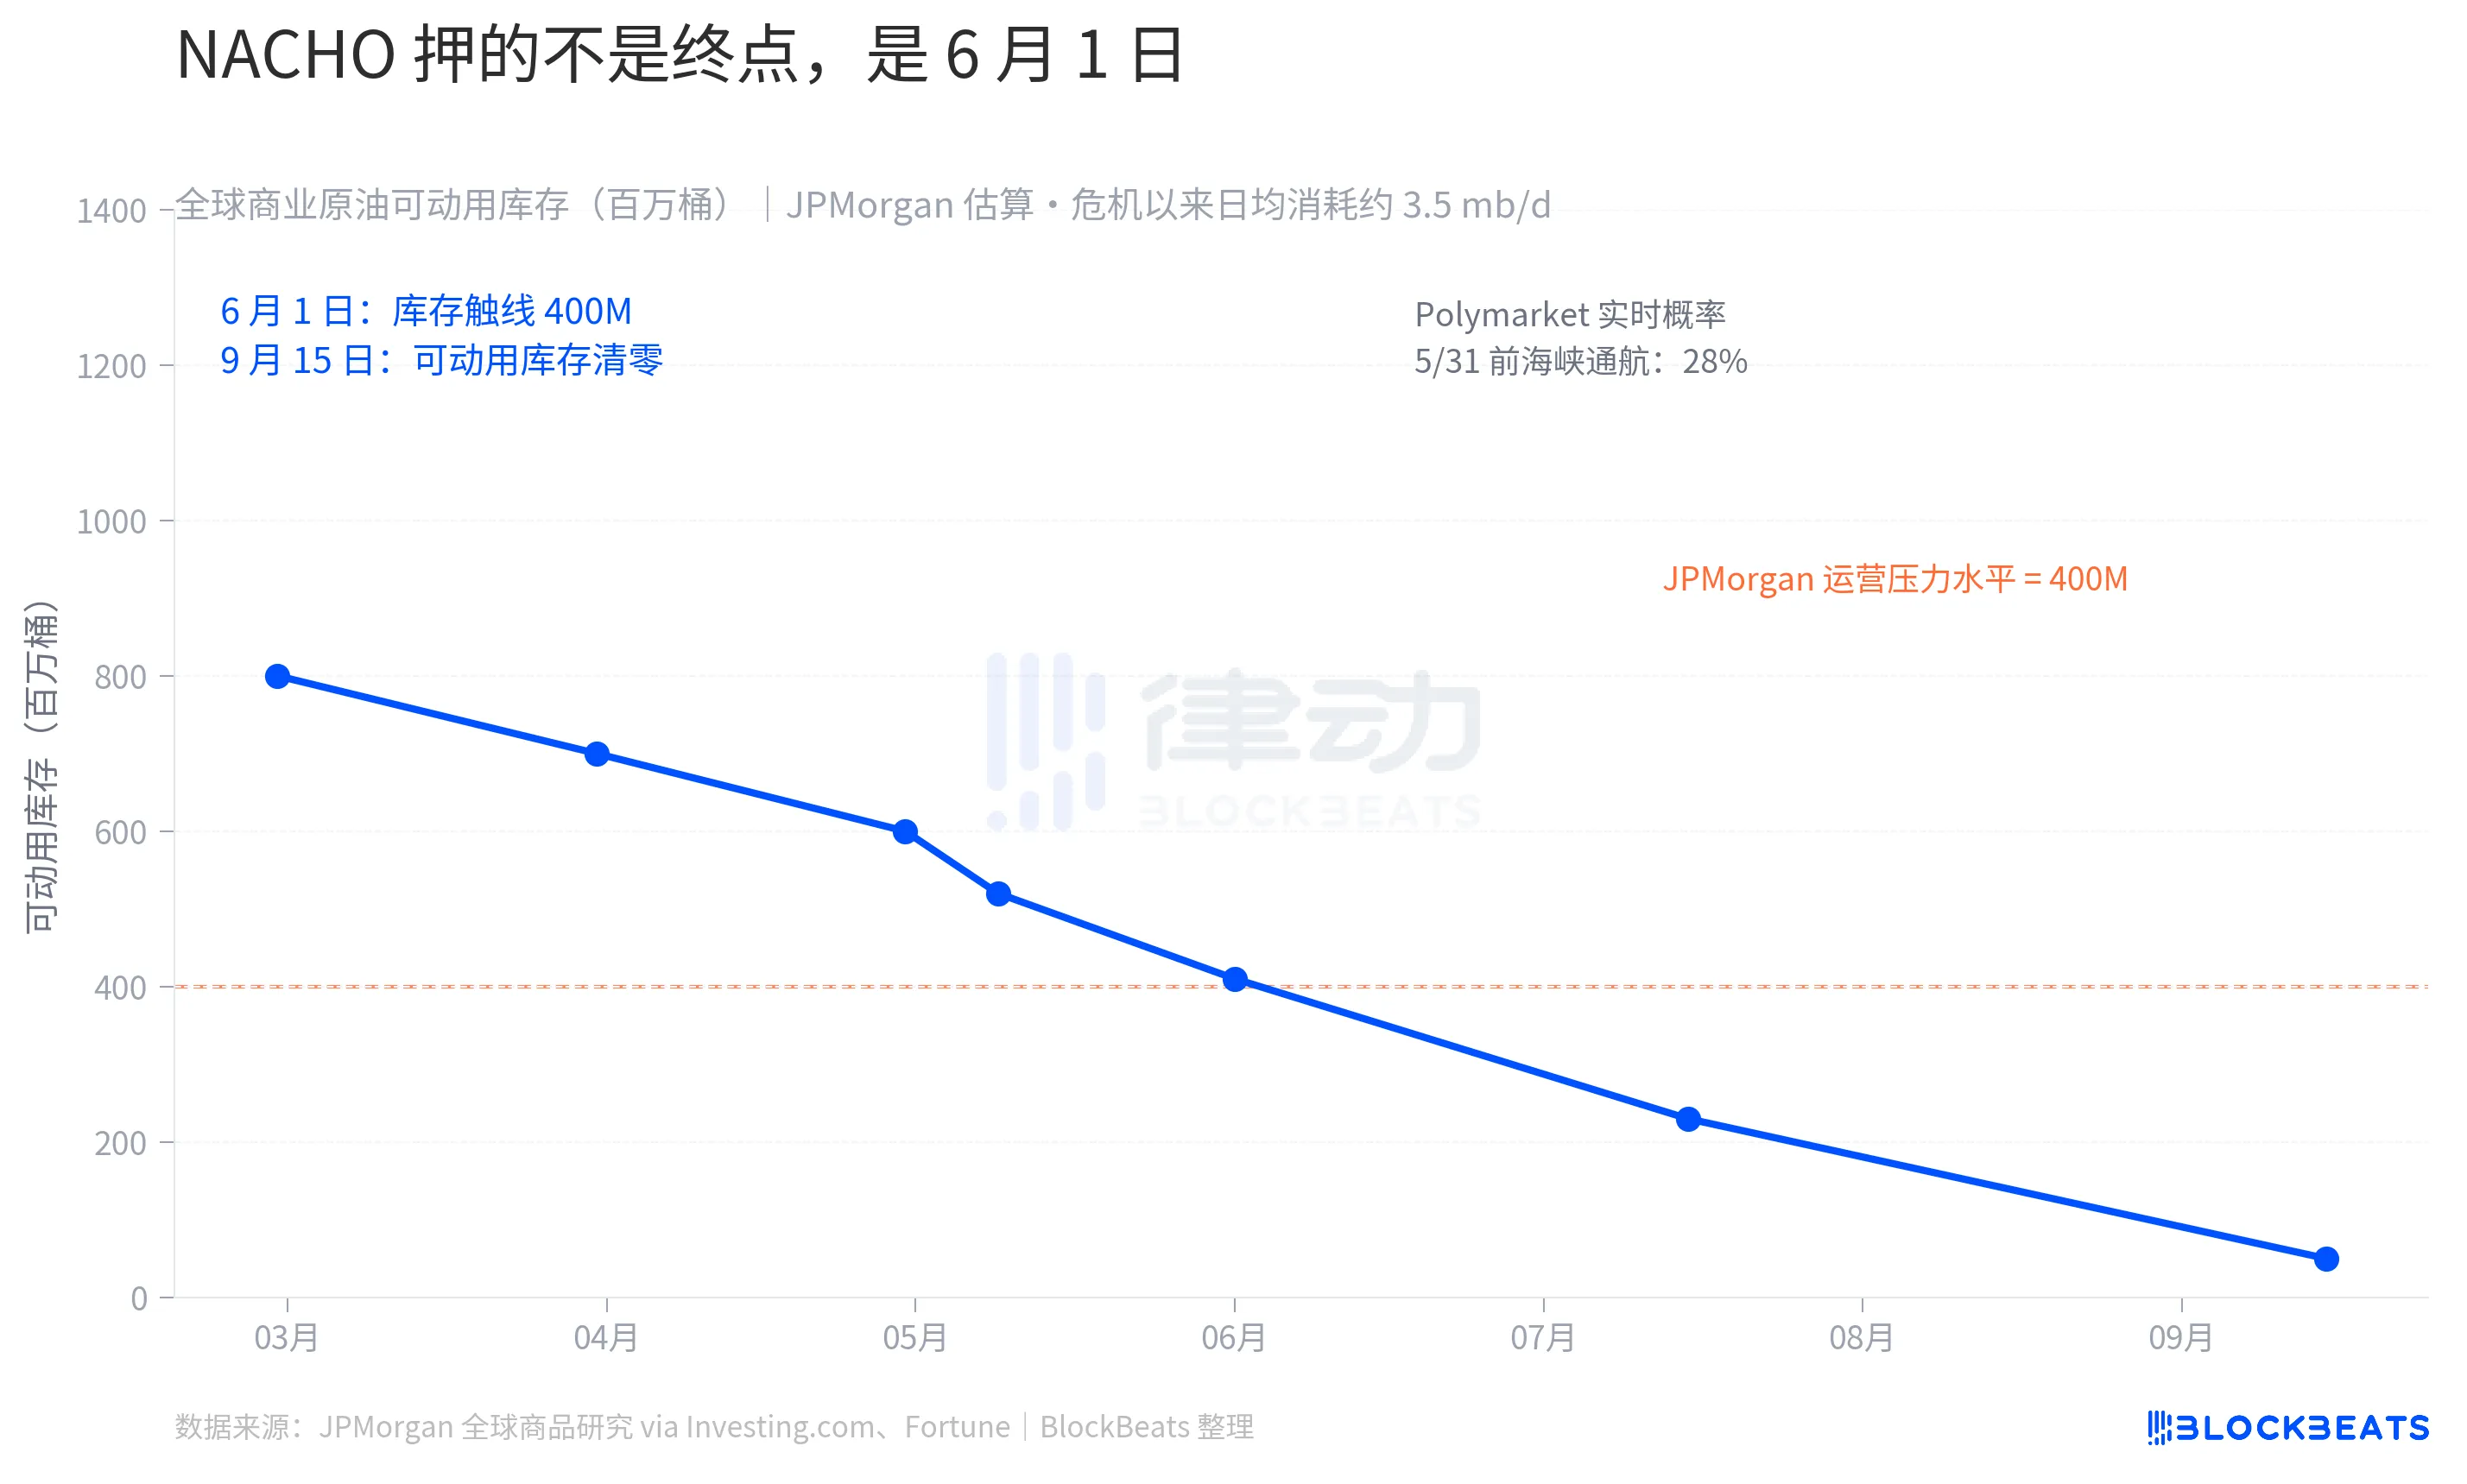
Market predictions are synchronized with the physical clock. According to Polymarket data on May 9, the probability of "normal navigation through the Strait of Hormuz before May 31" is 28%, while the probability before May 15 is only 2%. On this market, there is an active position of $9.92 million betting that NACHO will remain valid at least until May.
The market is no longer trading the next Truth Social post by Trump; instead, it is trading early June inventory data for the Strait of Hormuz.
Welcome to join the official BlockBeats community:
Telegram Subscription Group: https://t.me/theblockbeats
Telegram Discussion Group: https://t.me/BlockBeats_App
Official Twitter Account: https://twitter.com/BlockBeatsAsia