Based on on-chain data analysis, should BTC be shorted in the near future?
Original author: @SoulzBTC
Translated by: Sharon, BlockBeats
Editor's note:
@SoulzBTC is a well-known KOL in the cryptocurrency community, and also a full-time trader and technical analyst.
(The following views are the author's personal opinions and should not be used as a basis for investment decisions, nor should they be considered as recommendations or suggestions for engaging in investment transactions.)
Why has BTC surged 25% in the past 5 days? In this article, I will explain: 1. Whether you should establish a short or long position in BTC. 2. I will use on-chain data to support your analysis. 3. The background of BTC's upward trend.
Why short BTC?
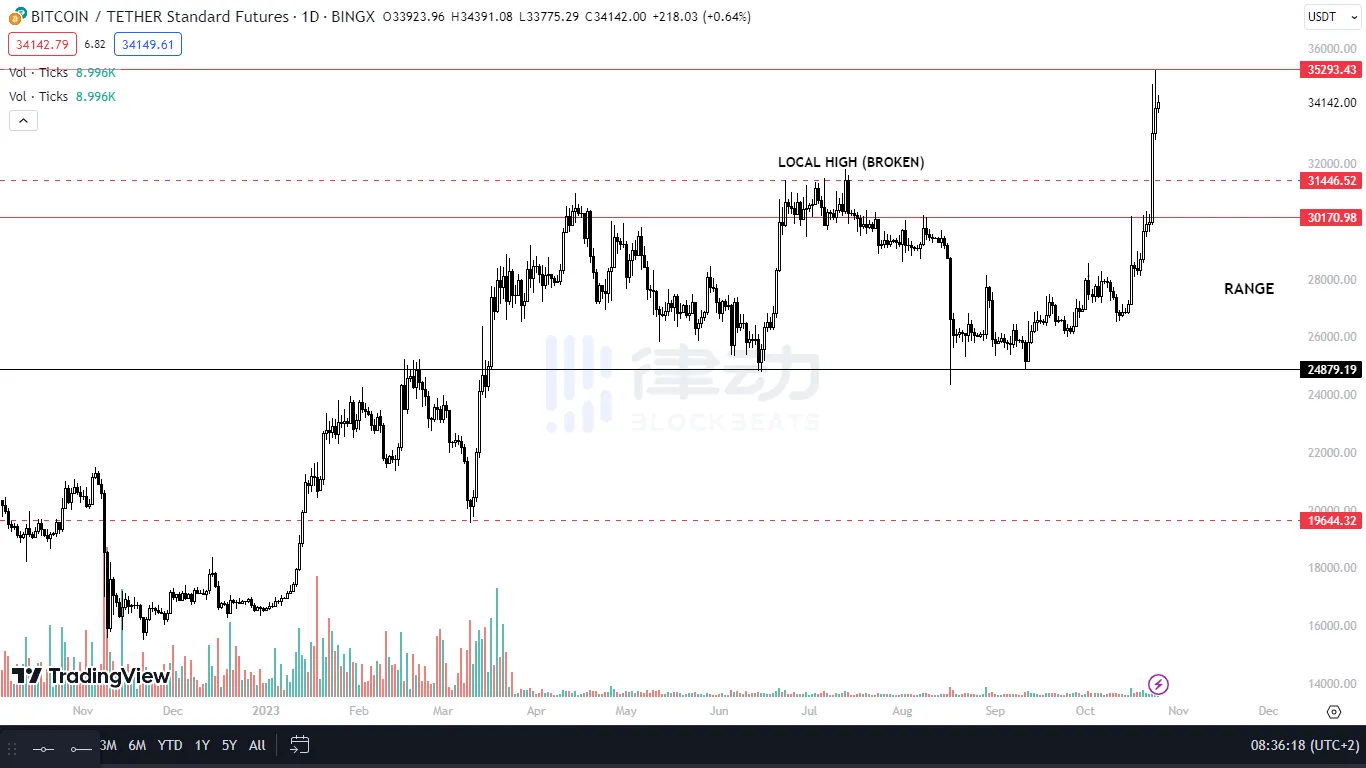
The next key resistance is at $37,330, and I highly doubt we should retest it. BTC reached its high at $35,300, so selling should start from this point. The $31,500 level must be retested and considered as a support level, as BTC did not retest it at the high.
Before BTC reaches its peak, pull up the market
Last week, I explained in a live broadcast why BTC should aim for a high point. A new range is forming, with liquidity left to us by the wick. HTF (PA) is bullish, not bearish. ETF news may appear after the scam occurs...
Using On-Chain Data Analysis for BTC
Track MM supply and demand by viewing OB data. MM's spot and PERPS are both rising. Spot OB has decreased slightly, but PERPS has not. - MM's PERPS is heavily pulled up. Therefore, I expect it to eventually decline.
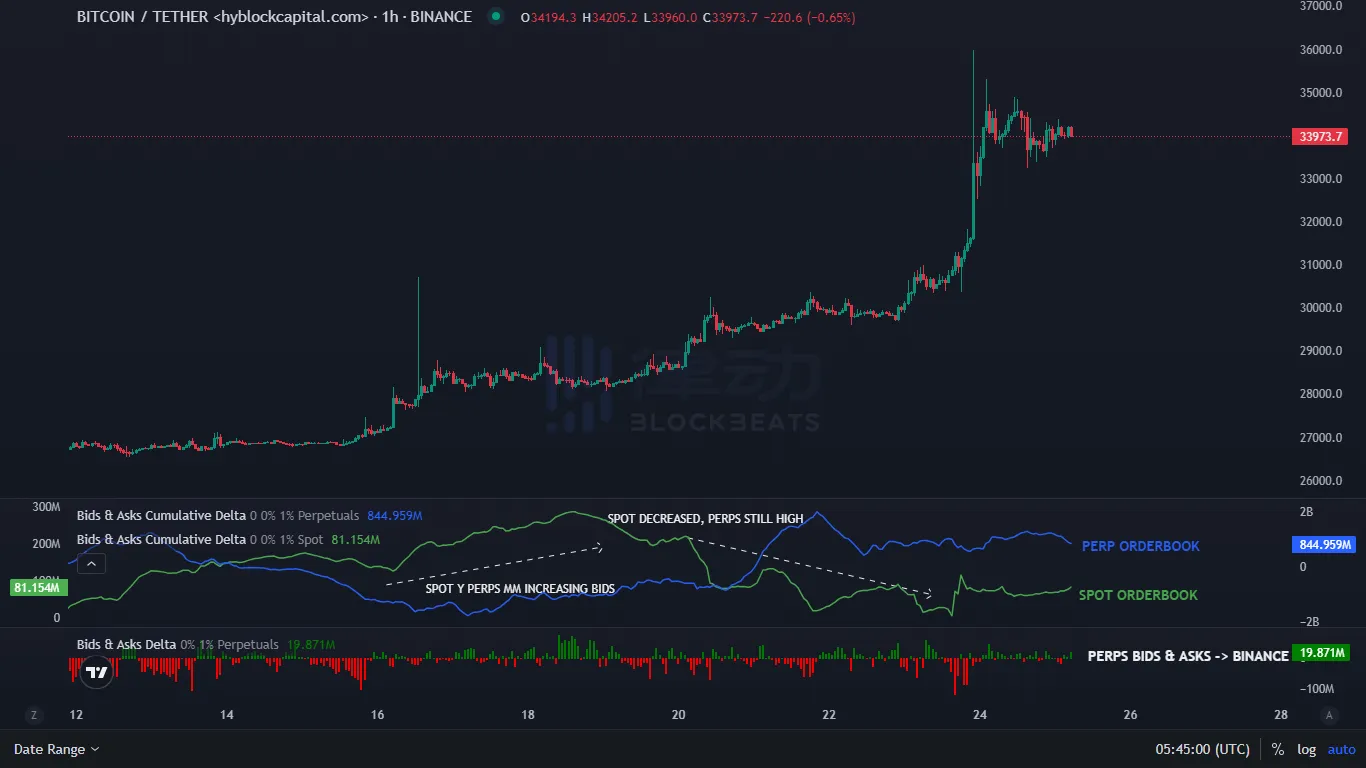
BTC Futures Settlement
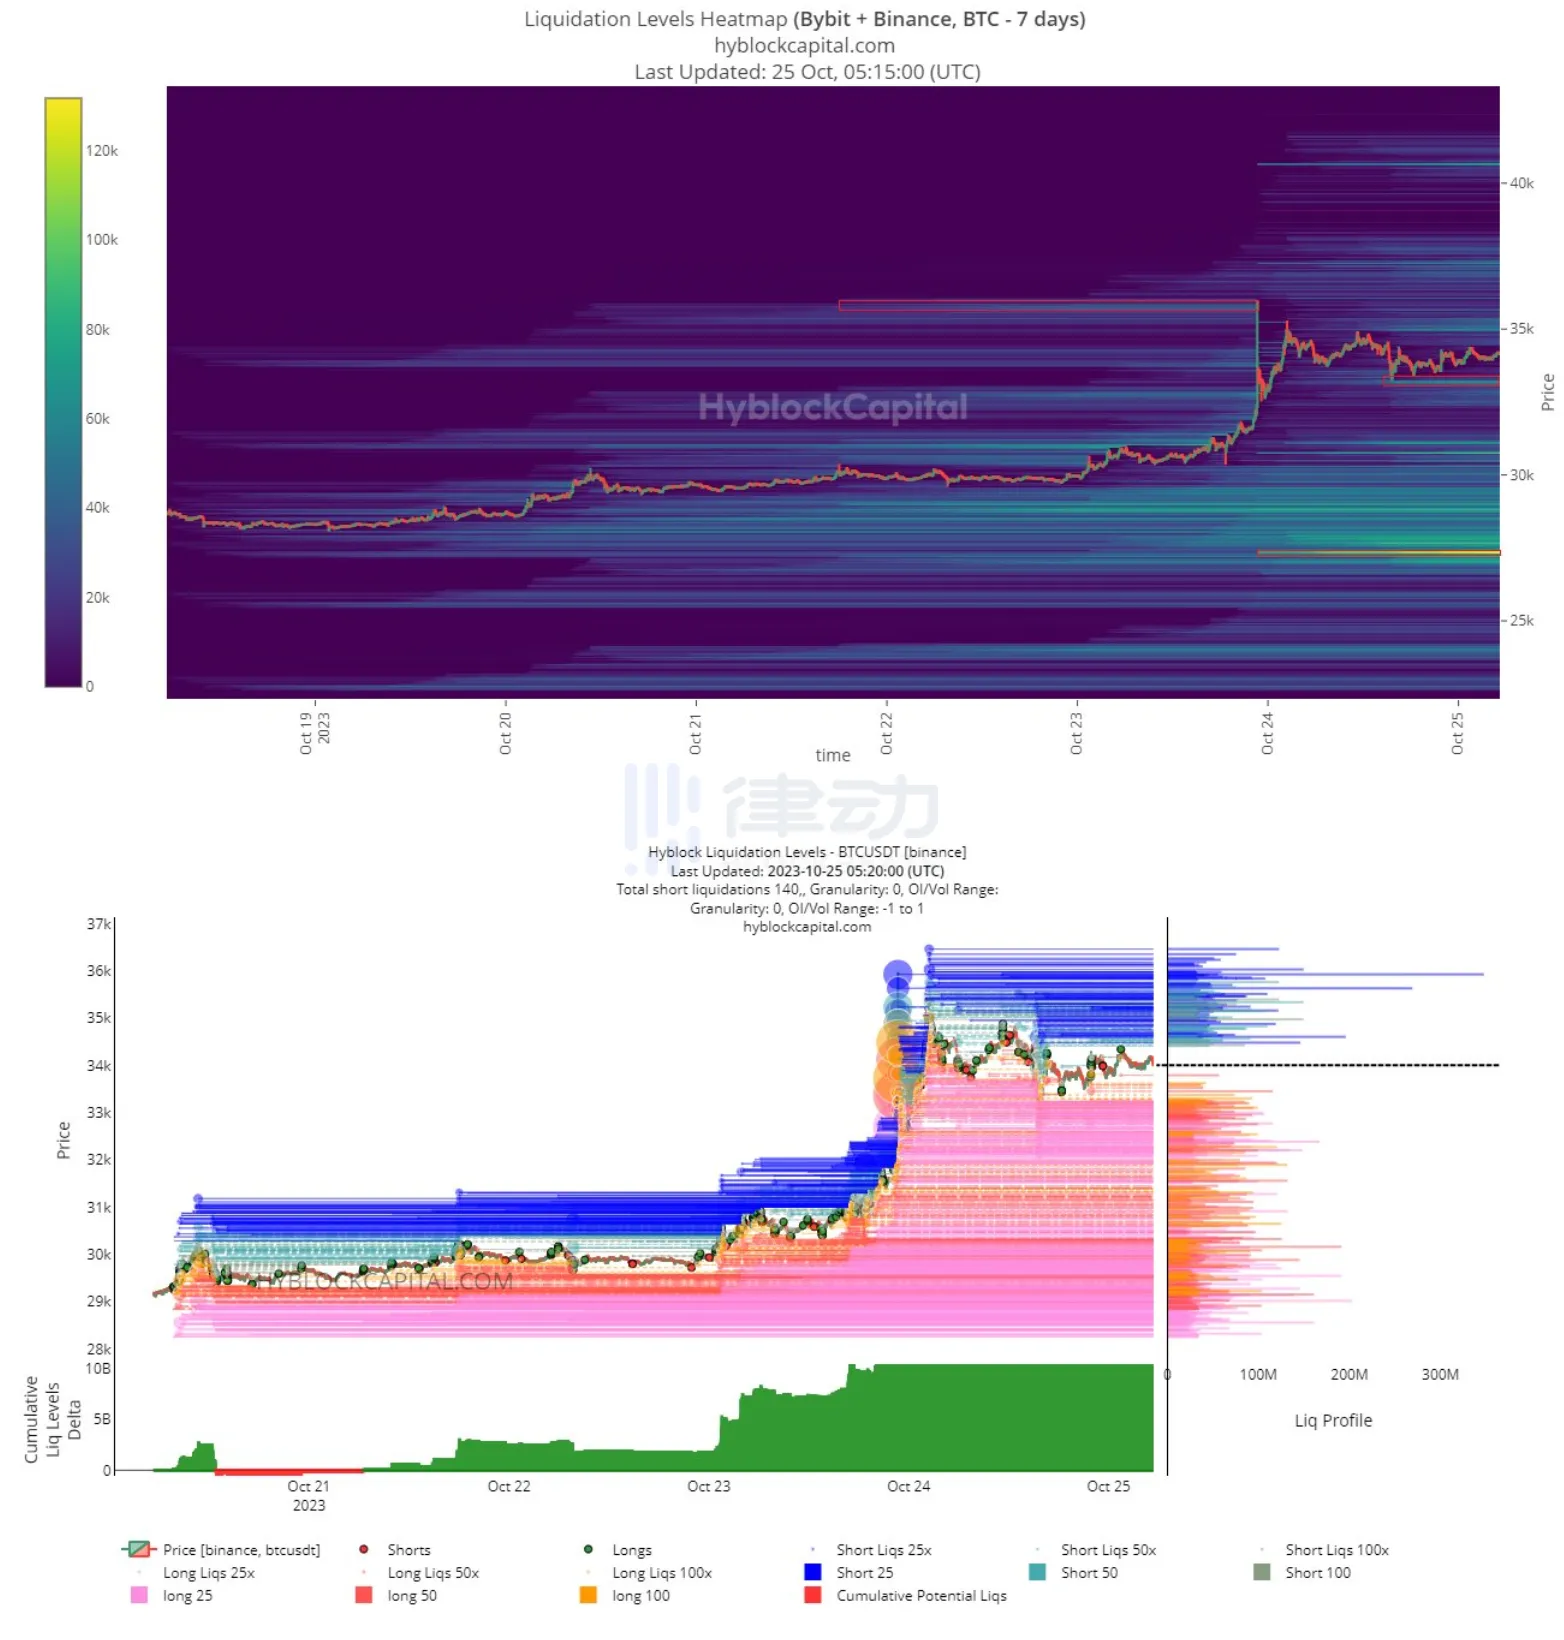
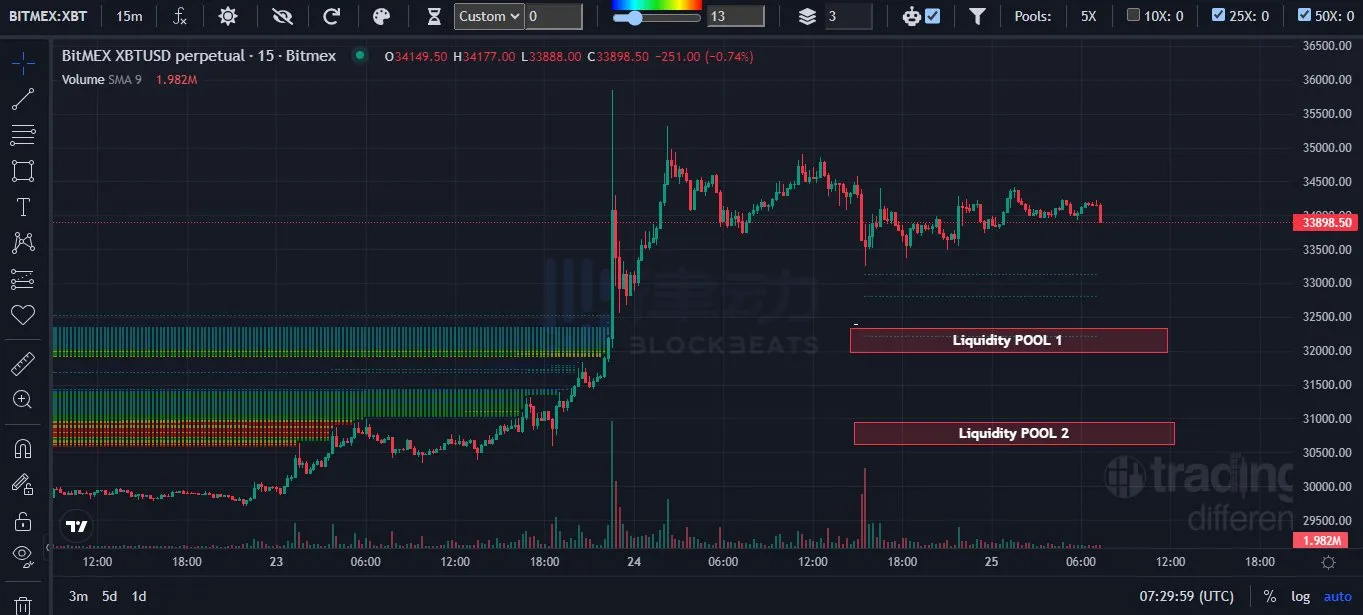
This rebound was driven by "double short squeeze", resulting in a liquidation of $54 million on October 17. An additional $125 million was added during the surge to $35,000. These events are very similar in terms of the level of destruction in January and August.

BTC Clearing Heat Map
Liquidity is below us, not above us. The highest price is $35,300. Why is the price targeting this area again? My next target is the liquidity pool marked on the chart. BTC should calm down and lower its target from here.
The Background of BTC's Rising Trend
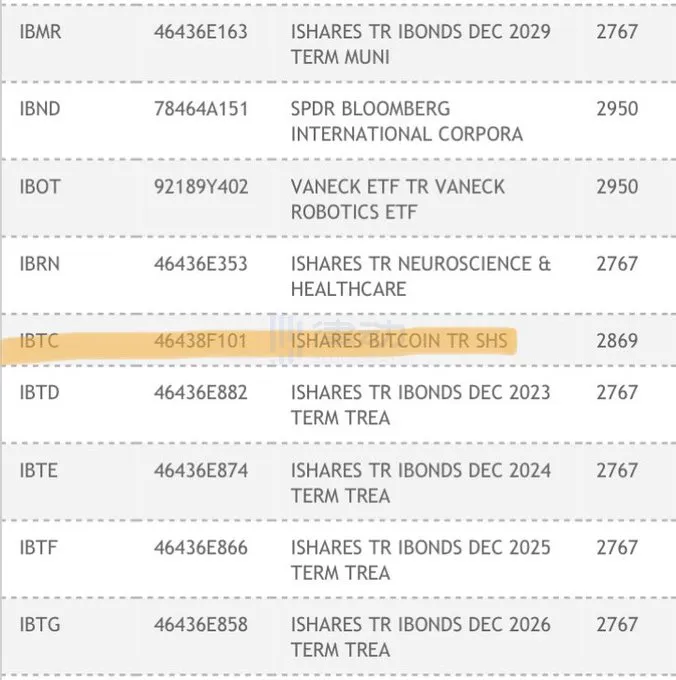
1. BlackRock's Bitcoin spot ETF IBTC listed on Nasdaq; 2. Bitcoin ETF triggers high demand from institutional and retail investors; 3. BTC PA is very sensitive to news about the approval process for spot ETFs. Even a fake news story from a week ago could stir up market sentiment.
I hope this post can help you understand the current situation of BTC.
Welcome to join the official BlockBeats community:
Telegram Subscription Group: https://t.me/theblockbeats
Telegram Discussion Group: https://t.me/BlockBeats_App
Official Twitter Account: https://twitter.com/BlockBeatsAsia

 Related Articles