Glassnode: Stablecoin dominance shifts back to Tether, speculative interest leads to explosive BTC rally

Original title: 《 Three Fallen Banks 》
Original author: Checkmate, Glassnode
Original translation: Dongxun, DeFi Road
After the most important week of 2023, the digital asset industry has lost three cryptocurrency-friendly banking institutions in the United States. However, so far, the main reaction of investors seems to be to seek safety in the least trusted major assets BTC and ETH.
Last week has become the fastest-paced and most influential week in the digital asset field this year. In just a few days, three major banking institutions in the United States entered voluntary liquidation or were taken over by US regulators, and these institutions all provide services to companies in the crypto industry.
Silvergate (SI) announced that it would voluntarily liquidate in an orderly manner on March 8 and return funds in full to depositors.
Silicon Valley Bank (SVB), the 16th largest bank in the United States, was closed and entered bankruptcy administration by the Federal Deposit Insurance Corporation (FDIC) on March 12, making the bank, valued at $209 billion, the second largest bank failure in U.S. history.
According to the Federal Reserve's announcement on the matter, Signature Bank of New York (SBNY) was also closed on March 12.
For all three banking institutions, it is expected that all deposits will be returned through reserves held or through deposit guarantees from the FDIC and U.S. regulators. The weekend market became volatile because many large digital asset companies and stablecoin issuers use one or more of these banking partners. Of particular note is USDC issuer Circle, which informed that it holds about $3.3 billion in cash in SVB, creating conditions for USDC to temporarily break the peg to $1.
This article will focus on some key impacts on the chain and in the broader market structure, including:
Several stablecoins decoupled from $1 and the shift of dominance back to Tether (USDT).
Net capital outflows from the digital asset market can be observed in both stablecoins and the two major mainstream currencies BTC and ETH.
Futures open interest hits cyclical lows despite rising volumes. Speculative interest led to an explosive rally in BTC to $22,000 and ETH back to $1600.
Bitcoin price is found trading between several popular and widely observed technical analysis pricing models. After encountering resistance at the 200-week and 365-day moving averages (~25.0k) in February, the price hit near the 200-day and 111-day moving averages (~$19.8k) this week before bouncing back.
Note that this is the first cycle in history where BTC is trading below the 200-week moving average, and from this perspective, the market is in new territory.
Real-time Advanced Chart
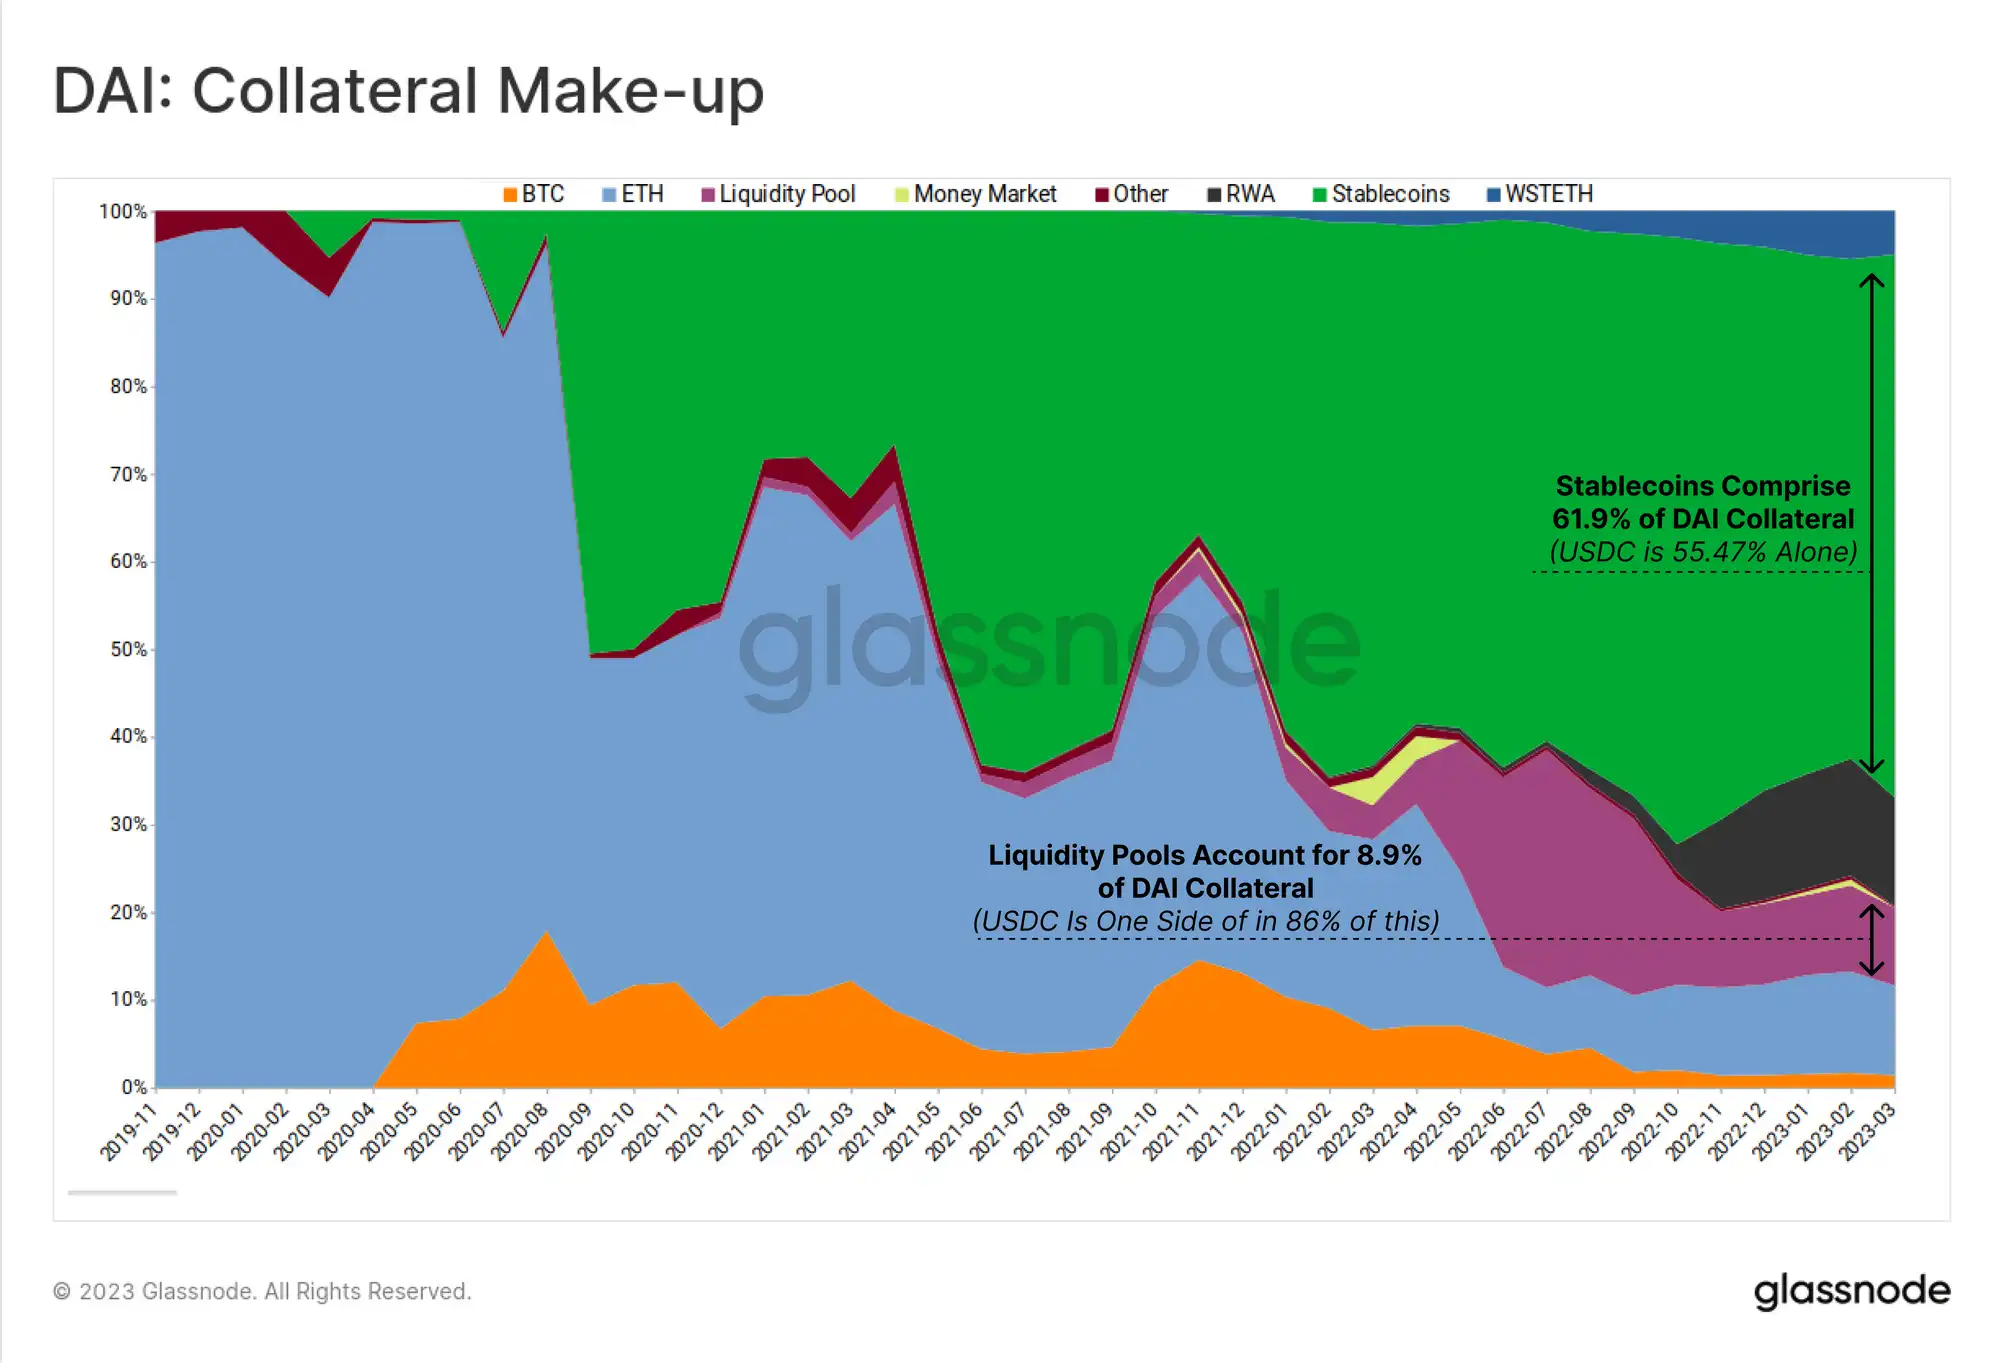
This week saw the first volatility in stablecoin prices since the collapse of the LUNA-UST project due to concerns about the partial loss of USDC backing. USDC fell to a low of $0.88, followed by DAI at $0.89, the latter as DAI is about 65.7% backed by stablecoin collateral.
Additionally, Gemini’s GUSD and Paxos’ USDP both traded just below their $1 pegs, while BUSD and Tether traded at premiums.
Tether, in particular, traded at premiums of $1.01 to $1.03 for much of the weekend. Ironically, Tether is seen as a safe haven amid concerns about broader repercussions for the heavily regulated U.S. banking industry.
Real-time advanced chart
In the case of DAI, stablecoins have become the primary form of collateral backing it, a trend that has been growing since mid-2020. USDC accounts for about 55.5% of direct collateral and has a large share of the various Uniswap liquidity positions used, totaling about 63% of all collateral.
This event has certainly opened up discussions about the long-term implications for DAI, which is purportedly a decentralized stablecoin. However, this event demonstrates how DAI's price is closely tied to the traditional banking system through its collateral mix, which also includes an additional 12.4% of tokenized real-world assets.
As we reported in mid-2022, Tether's dominance in the stablecoin market has been structurally declining since mid-2020. However, with recent regulatory moves against BUSD, and concerns related to USDC this week, Tether's dominance has risen back to over 57.8%.
USDC has held a 30% to 33% dominance since October 2022, but it remains to be seen whether supply will decrease as the redemption window reopens on Monday. BUSD has seen a sharp decline in recent months, with issuer Paxos halting new minting and dominance falling from 16.6% in November to 6.8% today.
Real-time advanced chart
Total capital outflows
Estimating true capital inflows and outflows from the digital asset markets can be tricky, but in most cases, capital initially flows in through the two major assets (BTC and ETH) or stablecoins. Therefore, the realized cap of BTC and ETH combined with the circulating supply of major stablecoins provides a fairly robust measure.
Here we can see that by this method the entire market is valued at around $677 billion, down about 20% from the ATH of $851 billion set a year ago. BTC dominance is 56.4%, ETH is 24.5%, USDT, USDC, and BUSD are 17.9%, and the remaining 1.2% is LTC.Real-time advanced chart
Based on 30-day changes, February saw the first net inflow since April 2022, peaking at +$5.8 billion/month, led primarily by BTC and ETH. However, last month, the market saw a reversal outflow of -$5.97 billion, of which 80% was the result of stablecoin redemptions (mainly BUSD) and 20% came from realized losses in BTC and ETH.
Real-time advanced chart
As news of the collapse of Silicon Valley Bank spread, investors turned to BTC and ETH for shelter, with significant outflows across the exchanges we monitor. Approximately 0.144% of BTC and 0.325% of ETH in circulation were withdrawn from exchange reserves, indicating a similar self-custodial reaction pattern to the FTX collapse.
Real-time advanced chart
In U.S. dollar terms, more than $1.8 billion worth of BTC and ETH flowed out of trading platforms last month. This is not necessarily large on a relative scale, but observing net withdrawals from trading platforms, especially in the current hostile regulatory environment, does illustrate a level of investor confidence that is worth noting.
Live Advanced Chart
On the other hand, the two major stablecoins are seeing net inflows of between $1.8 billion and $2.3 billion per month into exchanges. It is important to note that this is more than offset by BUSD’s outflows from exchanges at a staggering rate of -6.8 billion per month. Therefore, it is likely that some degree of “stablecoin conversion” is occurring.
Overall, however, this appears to be a market reaction to stablecoins, BTC, and ETH, reflecting a notable appreciation for trustless self-custody of assets.
Live Advanced Chart
Flushing Futures
Finally, we will assess the reaction expressed through the futures markets. This week, total open interest for both major assets fell to cyclical multi-year lows. The notional value of Bitcoin futures positions is $7.75 billion, accounting for about 63% of total open interest.
Live Professional Chart
For futures volumes, Bitcoin’s dominance is similar at around 60%, and has recovered after a post-FTX and year-end lull. Total volume is around $58.2 billion/day, which is about the same as for all of 2022.
Live Professional Chart
This week's price action was driven in part by a series of long and short squeezes. Approximately $85 million in BTC long positions were liquidated during the sell-off to $19,800. Subsequently, as prices recovered above $22,000, about $19 million in short positions were liquidated.
Live Professional Chart
Prior to this rally, funding rates in the perpetual swap market moved into extreme backwardation levels. Traders are paying annualized funding rates of -27.1% and -48.9% to short BTC and ETH, respectively. Traders are also much more aggressive in shorting ETH, with the BTC:ETH spread reaching 21.8%, the largest level since the FTX sell-off.
This exacerbated the liquidation in the ETH futures market. More than $48 million of shorts were liquidated when the market rebounded above $1,600, meaning that the notional value of forced liquidations was 2.5 times higher relative to BTC.This suggests that the ETH market has been used more recently to express speculative interest, fueling volatility.
Live Professional Chart
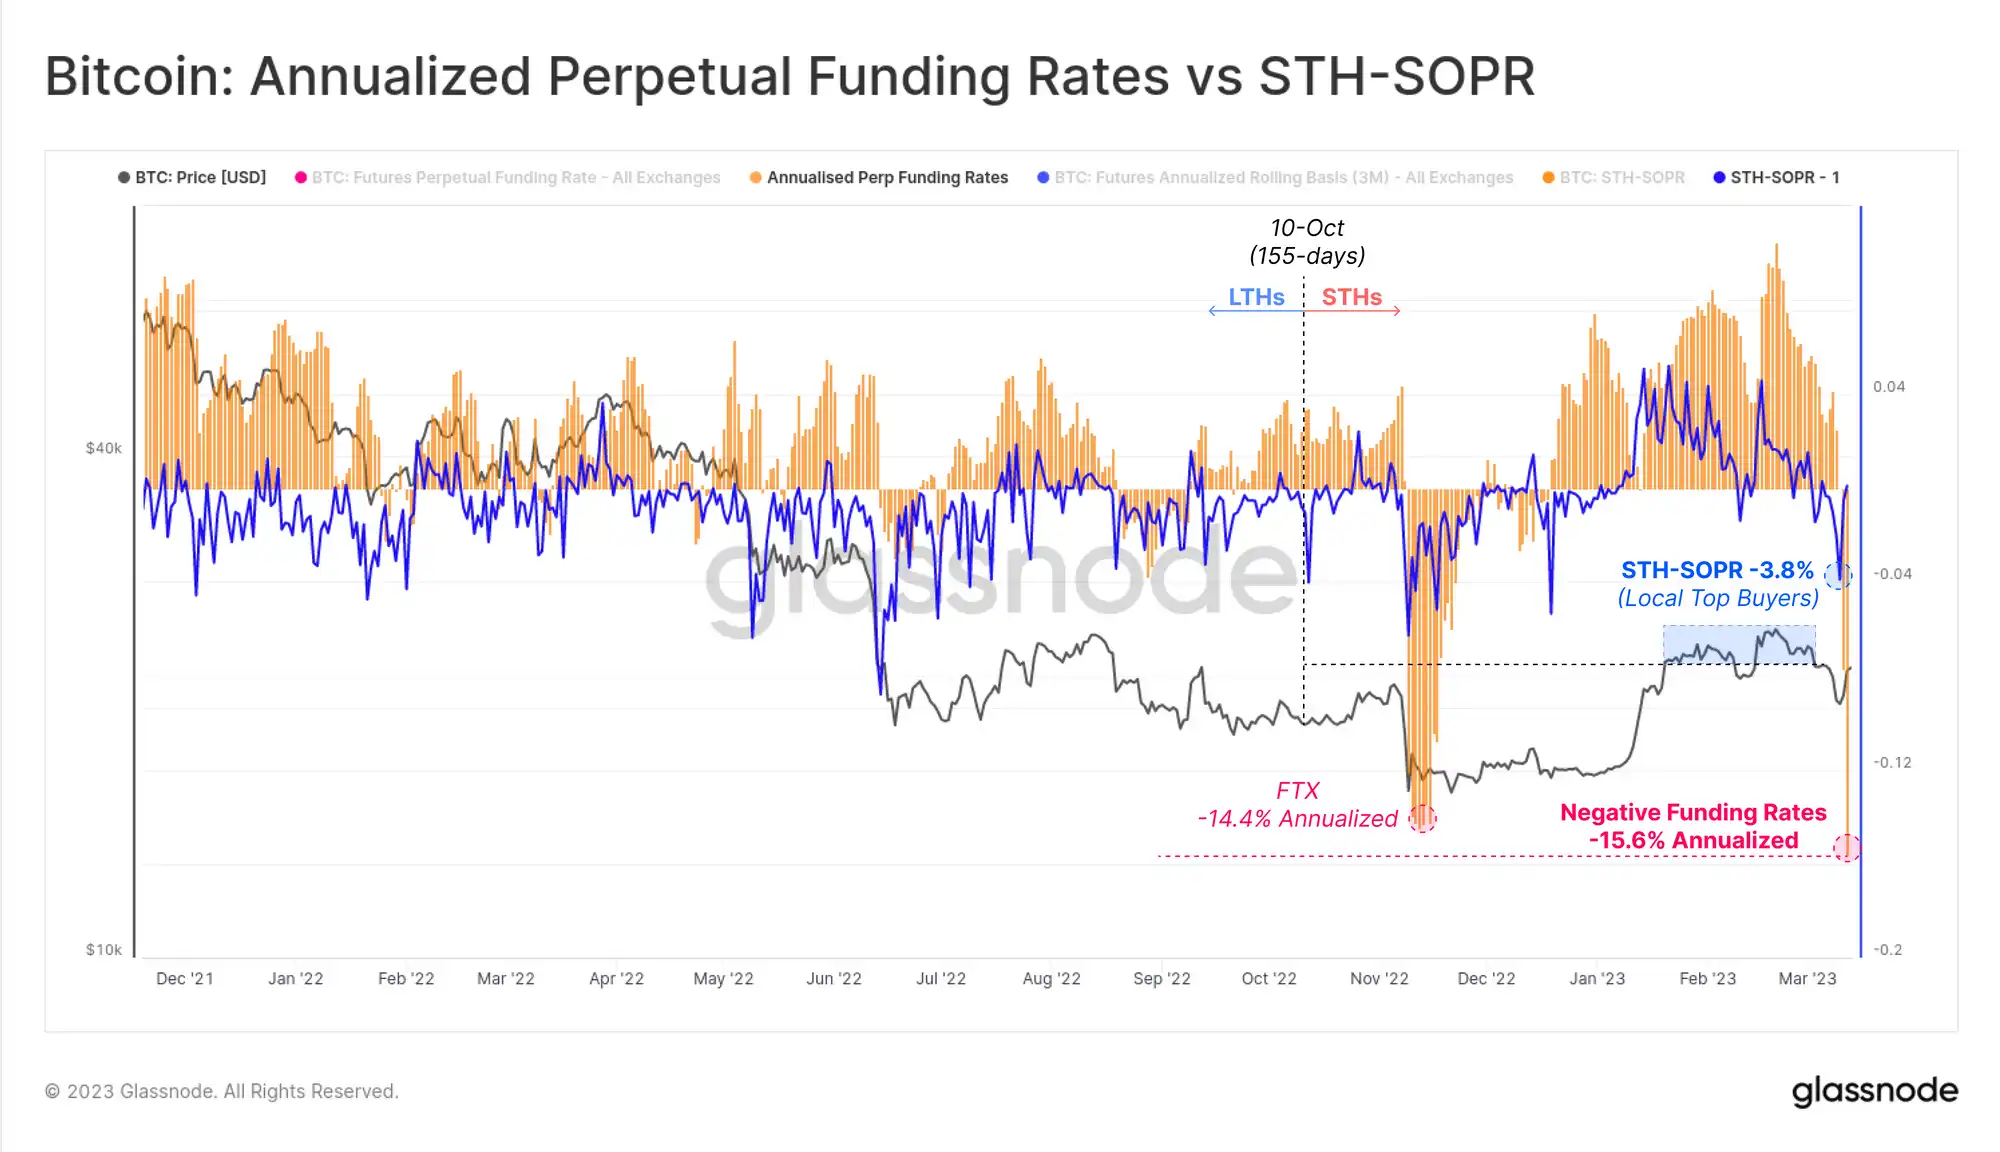
We’ll end with a final chart that overlays the on-chain reaction of short-term holders (STHs) with the reaction of the leveraged futures market. This chart shows STH-SOPR minus 1, plotted on the annualized futures funding rate, as follows:
By the age threshold we defined of 155 days, almost all STH coins are likely to be in profit, with the exception of those acquired near local highs.
Based on our defined 155-day age threshold, almost all STH coins are likely to be in profit, with the exception of those Tokens acquired near local highs. The return value of STH-SOPR (minus 1) is -3.8%, a relatively large realized loss, indicating that local "top buyers" are currently dominating spending. The direction and performance of STH-SOPR tends to correlate with the funding rate. The two indicators reflect a different but significant subset of the BTC market, one representing spot/on-chain and the other representing leveraged futures.
With this as a backdrop, it appears that most of the Tokens spent this week were realized losses by local top buyers (other holders were relatively dormant). This occurred before futures entered a sharp spot premium, with traders opening speculative short positions.
As news of the bank deposits being guaranteed spread, a strong rally pushed BTC to over $22,000 and ETH to over $1,600, catching much of the market off guard.
Conclusion
After the most influential week of 2023, the digital asset industry is short of three crypto-friendly banking institutions in the United States and finds itself in an increasingly hostile regulatory environment. As traditional financial markets closed over the weekend, some stablecoins saw a deviation from their $1 peg, recovering on news of guaranteed deposits on Sunday.
Investors have reacted somewhat similarly to the post-FTX environment, with a net shift of stablecoins to trading platforms and away from custody of BTC and ETH. However, more broadly, the industry has experienced net capital outflows of approximately $5.9 billion in the last month.
The industry, and indeed the global financial system, remain in uncharted waters. This week in many ways reinforced why Satoshi Nakamoto created a trustless, scarce digital asset in the first place.
Original link
Welcome to join the official BlockBeats community:
Telegram Subscription Group: https://t.me/theblockbeats
Telegram Discussion Group: https://t.me/BlockBeats_App
Official Twitter Account: https://twitter.com/BlockBeatsAsia

 Related Articles