Glassnode 2022 on-chain Data report: DeFi deleveraging; Tether's market share is stable

Title: On-Chain Data Report 2022: BTC, ETH and Stablecoin
Original source: Checkmate, Glassnode
The DeFi way
We explore the state of the bitcoin, Ethereum, and stablecoin markets as the chaotic, turbulent, and brutal year of 2022 comes to an end. This retrospective analysis will be the last edition of the year, and we look forward to returning in an exciting 2023.
2022 has been one of the most chaotic, turbulent and brutal years, not just for the digital asset industry but for financial markets more broadly. After decades of extremely easy credit, tightening conditions have led to severe and rapid shrinkage in most asset classes, following a U-turn in central bank monetary policy.
This issue of on-chain analysis will be our last for the year (unless a major industry event inspires us). In this article, we will introduce:
Volatility, derivatives and futures leverage. The severity of last year's realized losses. The supply structure and concentration on the Bitcoin chain. Bitcoin mining cools. The supply dynamics after the Ethereum merger. The evolution of Ethereum's gas consumption dominance. Trends and dominance of stablecoin market.
Quiet futures markets
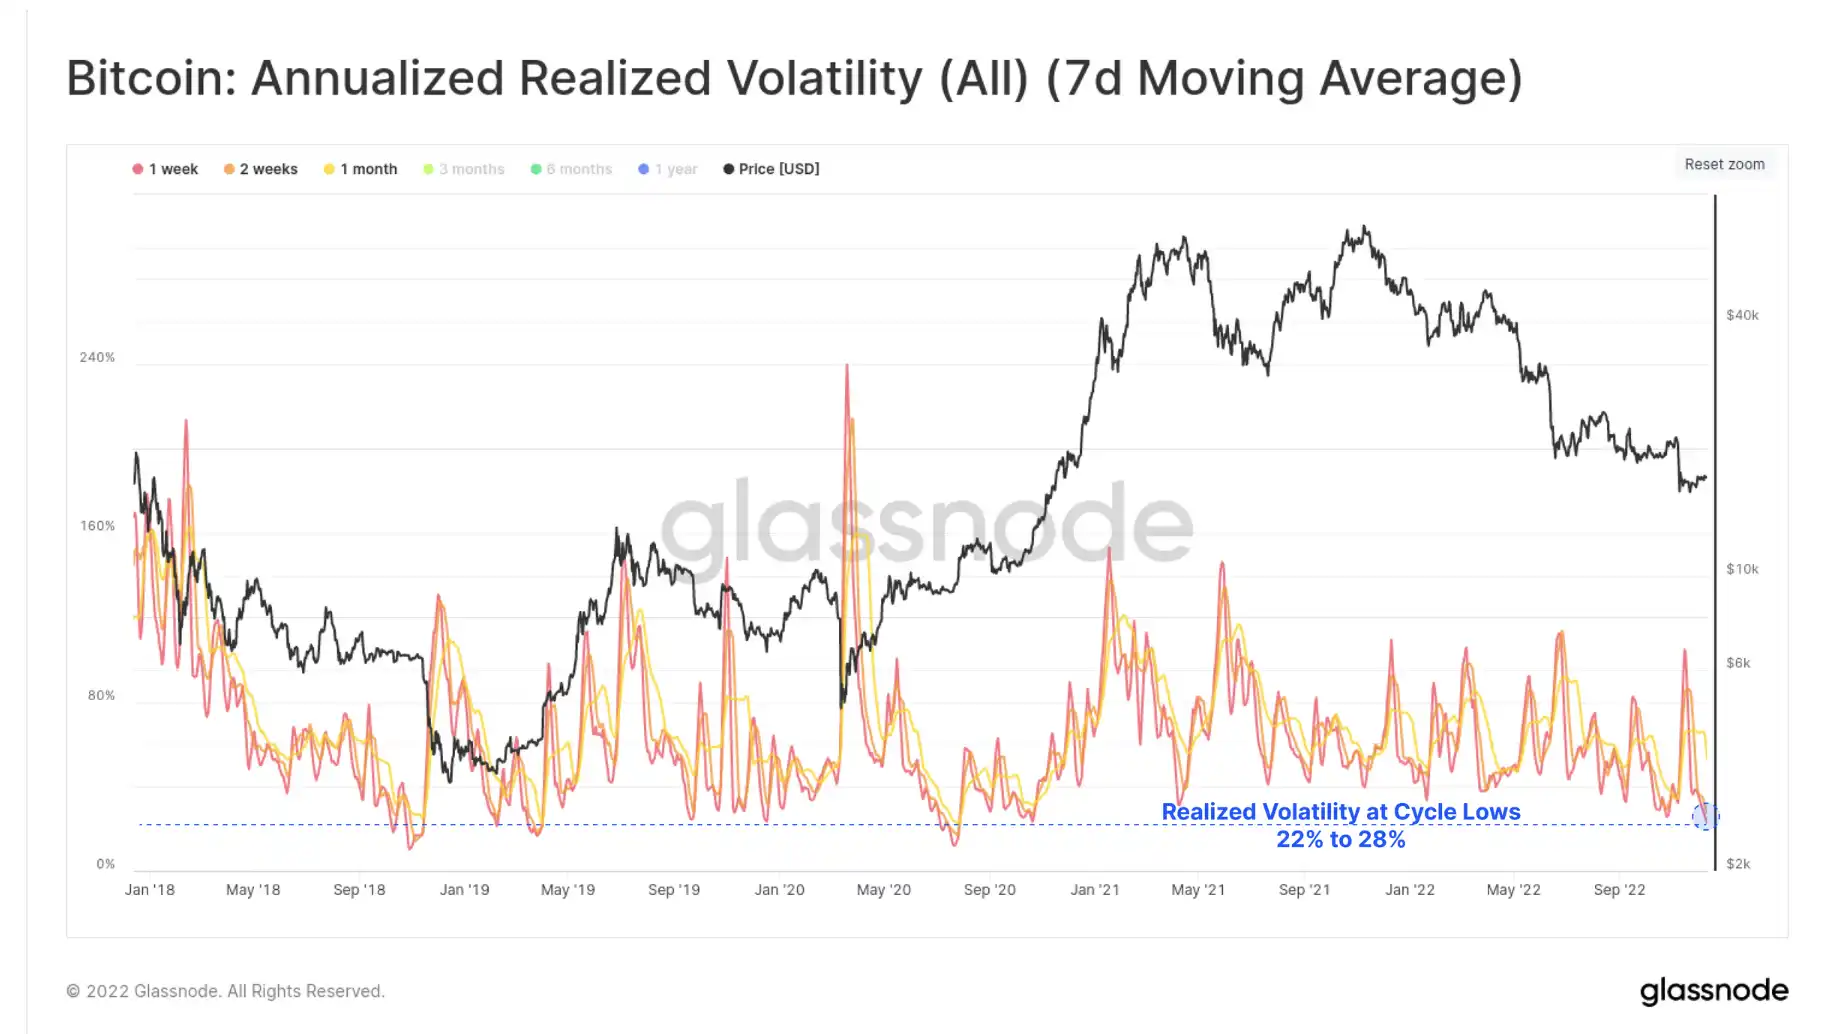
After a truly chaotic year, the bitcoin market has gone very quiet heading into December. BTC's short-term realized volatility is currently at multi-year lows of 22% (1 week) and 28% (2 weeks), marking the lowest volatility since October 2020.
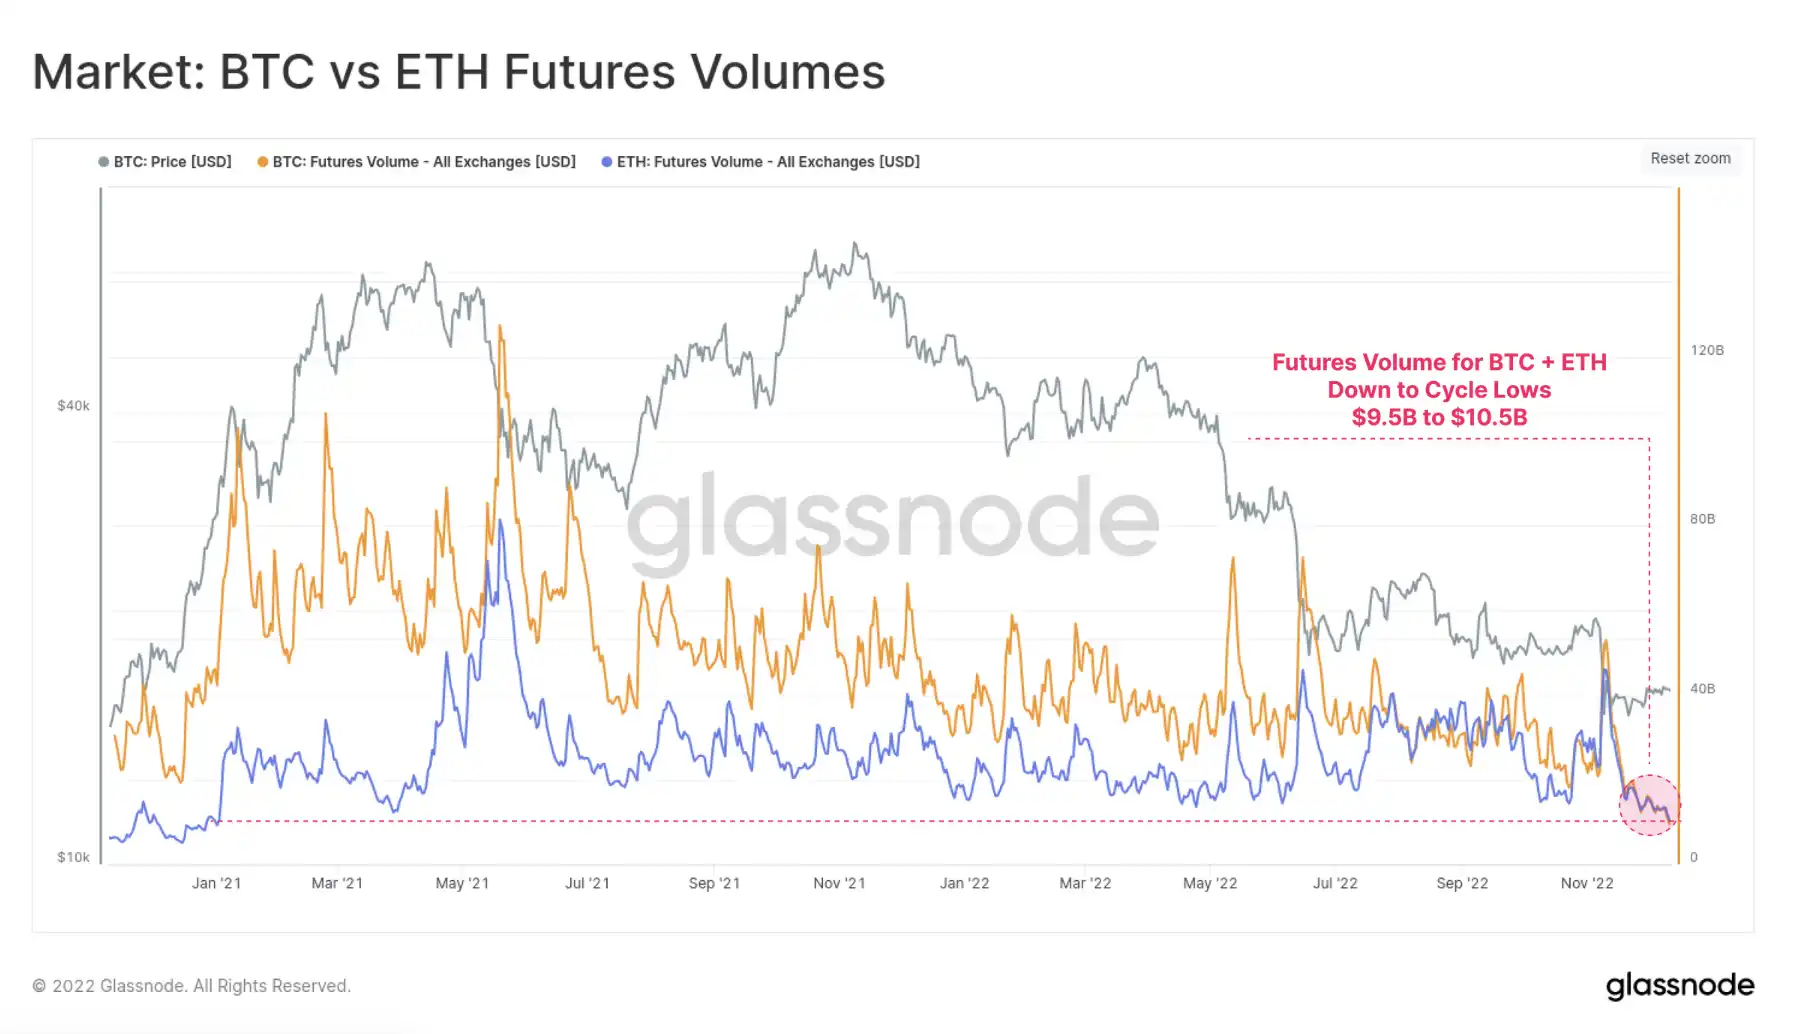
Futures trading volumes have also been sluggish and are now approaching multi-year lows. The current trading volume of the BTC and ETH markets is similar, between $9.5 billion and $10.5 billion per day. This shows the dramatic impact of tighter liquidity, widespread deleveraging and damage to many lending and trading desks in the sector.
Futures trading volumes have also been sluggish and are now approaching multi-year lows. The current trading volume of the BTC and ETH markets is similar, between $9.5 billion and $10.5 billion per day. This shows the dramatic impact of tighter liquidity, widespread deleveraging and damage to many lending and trading desks in the sector.
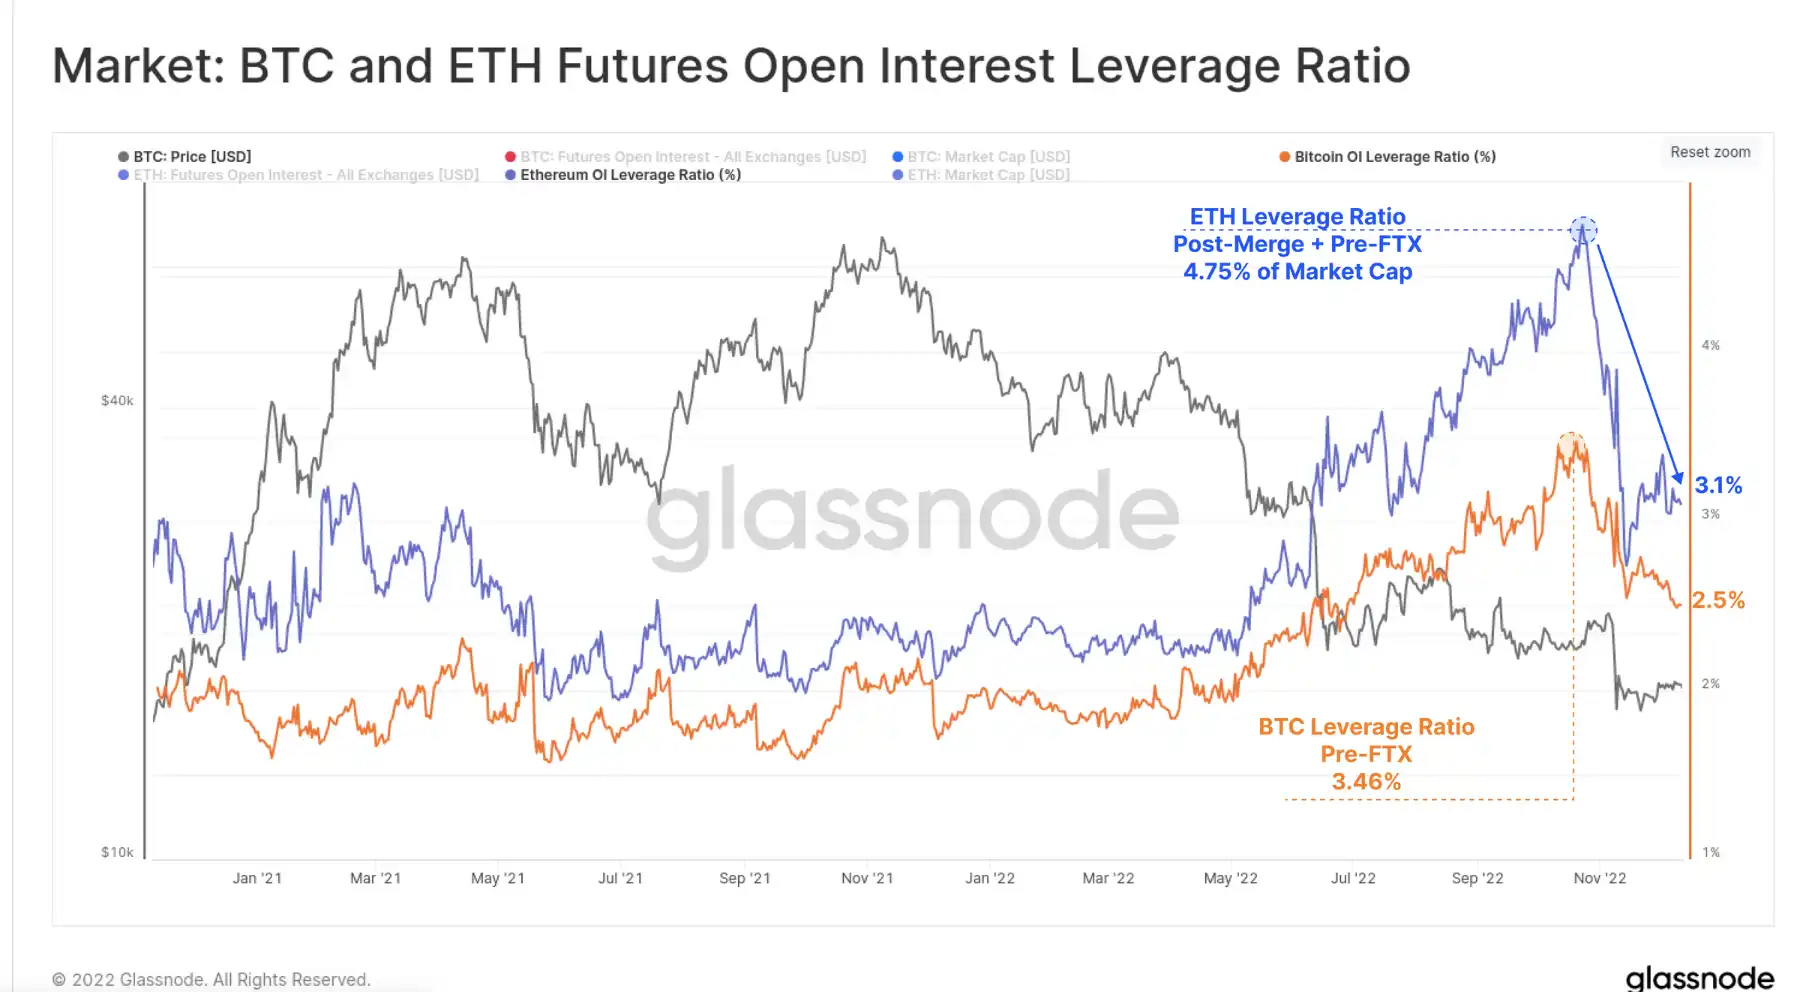
Open interest in the futures market has been sharply reduced following the FTX crash. The chart below shows the leverage ratio, calculated as the ratio of open interest in the futures to the market value of the corresponding asset.
For ETH, the build-up and unwinding of futures leverage in November was significantly more severe, possibly as a result of the remaining "merger trades" being unwound. ETH's open interest as a percentage of market value decreased from 4.75 percent to 3.10 percent of market value. BTC leverage peaked the week before ETH market and has fallen from 3.46 per cent of market capitalisation to 2.50 per cent in the past month.
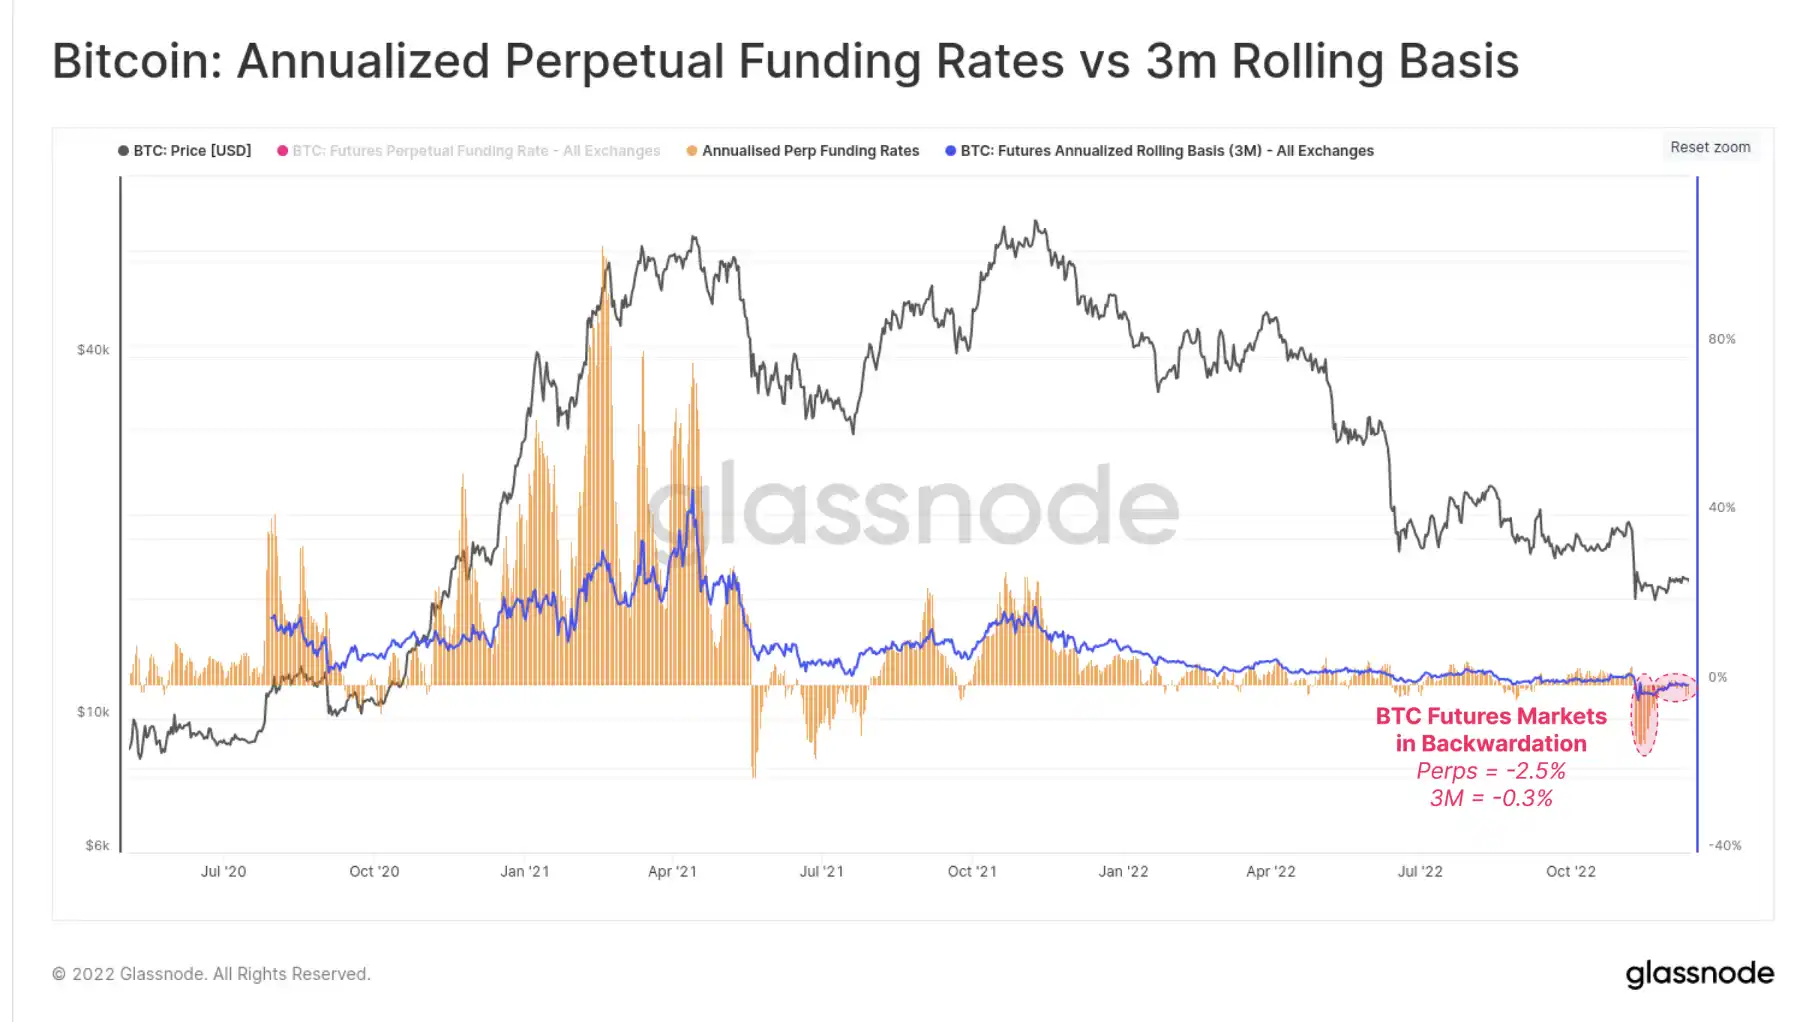
Bitcoin futures and perpetuals are both in backwardation, on an annualized basis of -0.3% and -2.5%, respectively. Sustained periods of backwardation are uncommon, and the only comparable period is the consolidation period between May and July 2021. This suggests that the market is relatively "hedged" against further downside risk and/or that there are more short speculators.
Market pullback
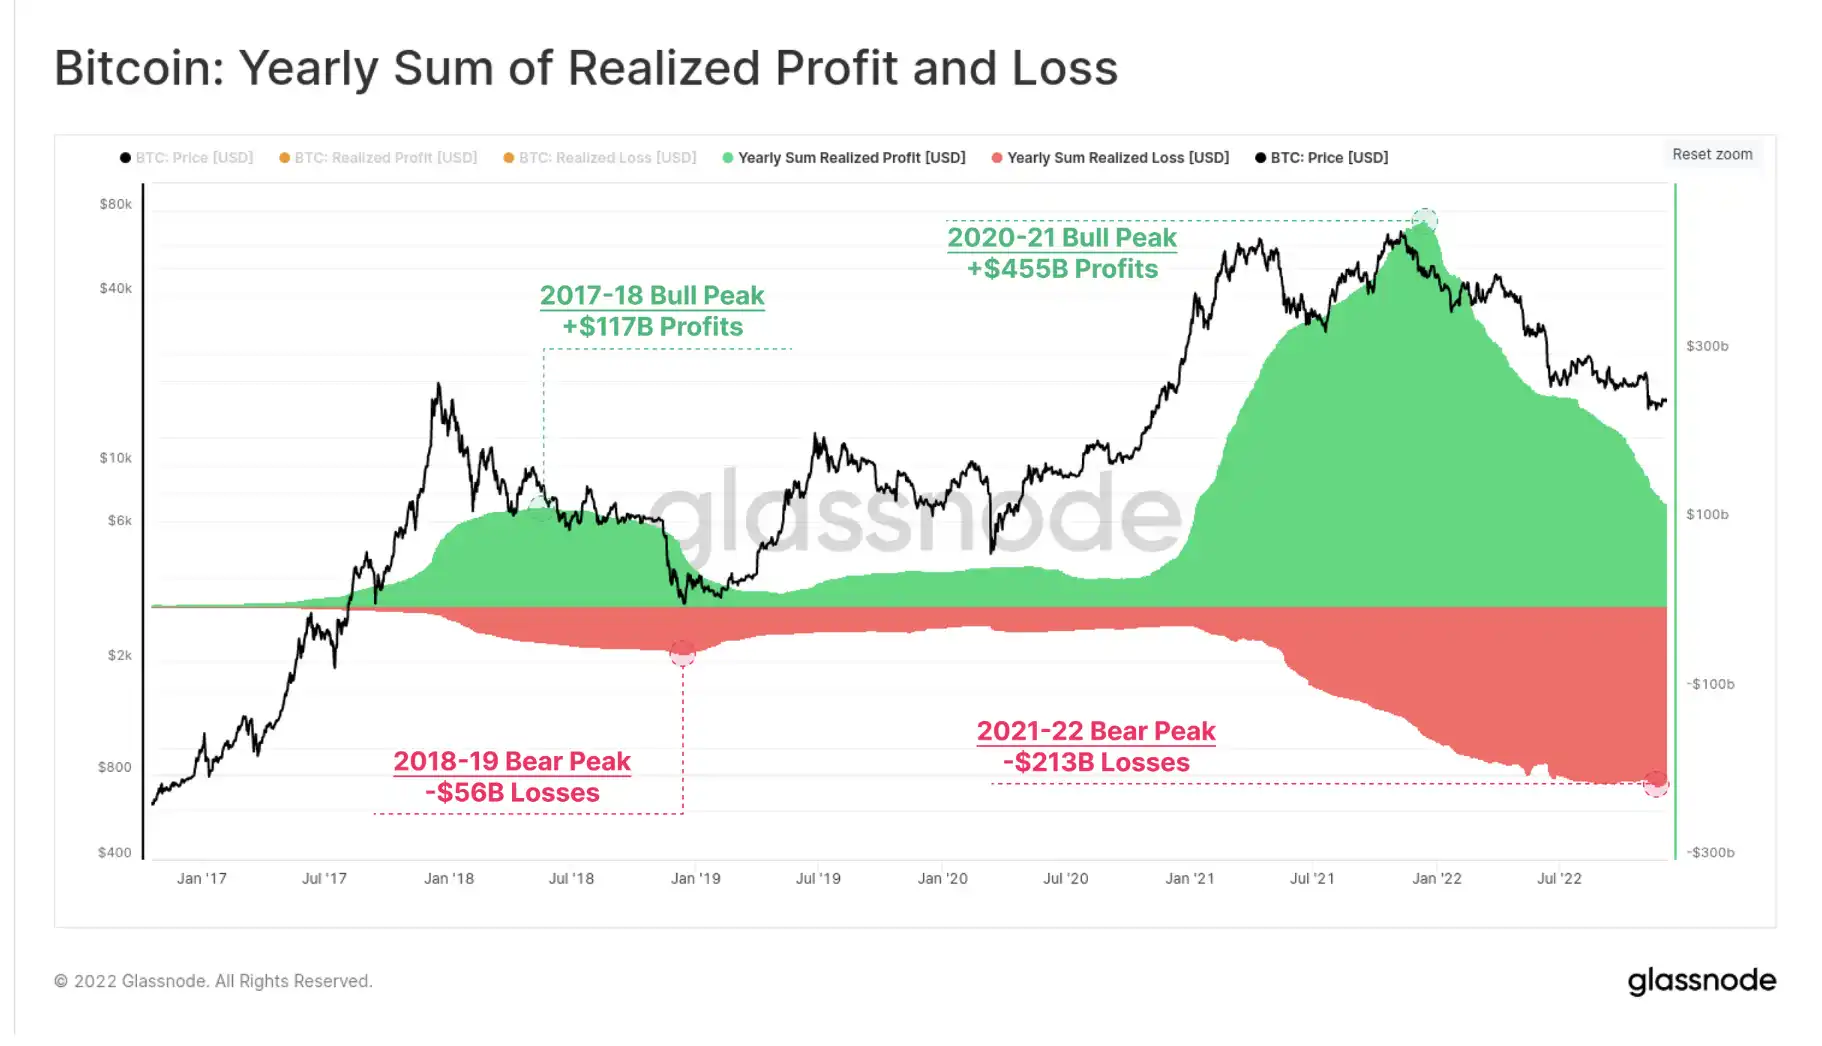
The excess liquidity bubble of the 2020-21 era of easy monetary policy produced record annual total realisable on-chain profits. Bitcoin investors moved money onto the chain, reaping more than $455 billion in annual profits, peaking shortly after ATH in November 2021.
Since then, the bears have dominated the market, which has given back more than $213 billion in realized losses. That's equivalent to 46.8 percent of the 2020-21 bull market's profits, which is very similar to the relative size of the 2018 bear market, when the market gave back 47.9 percent.
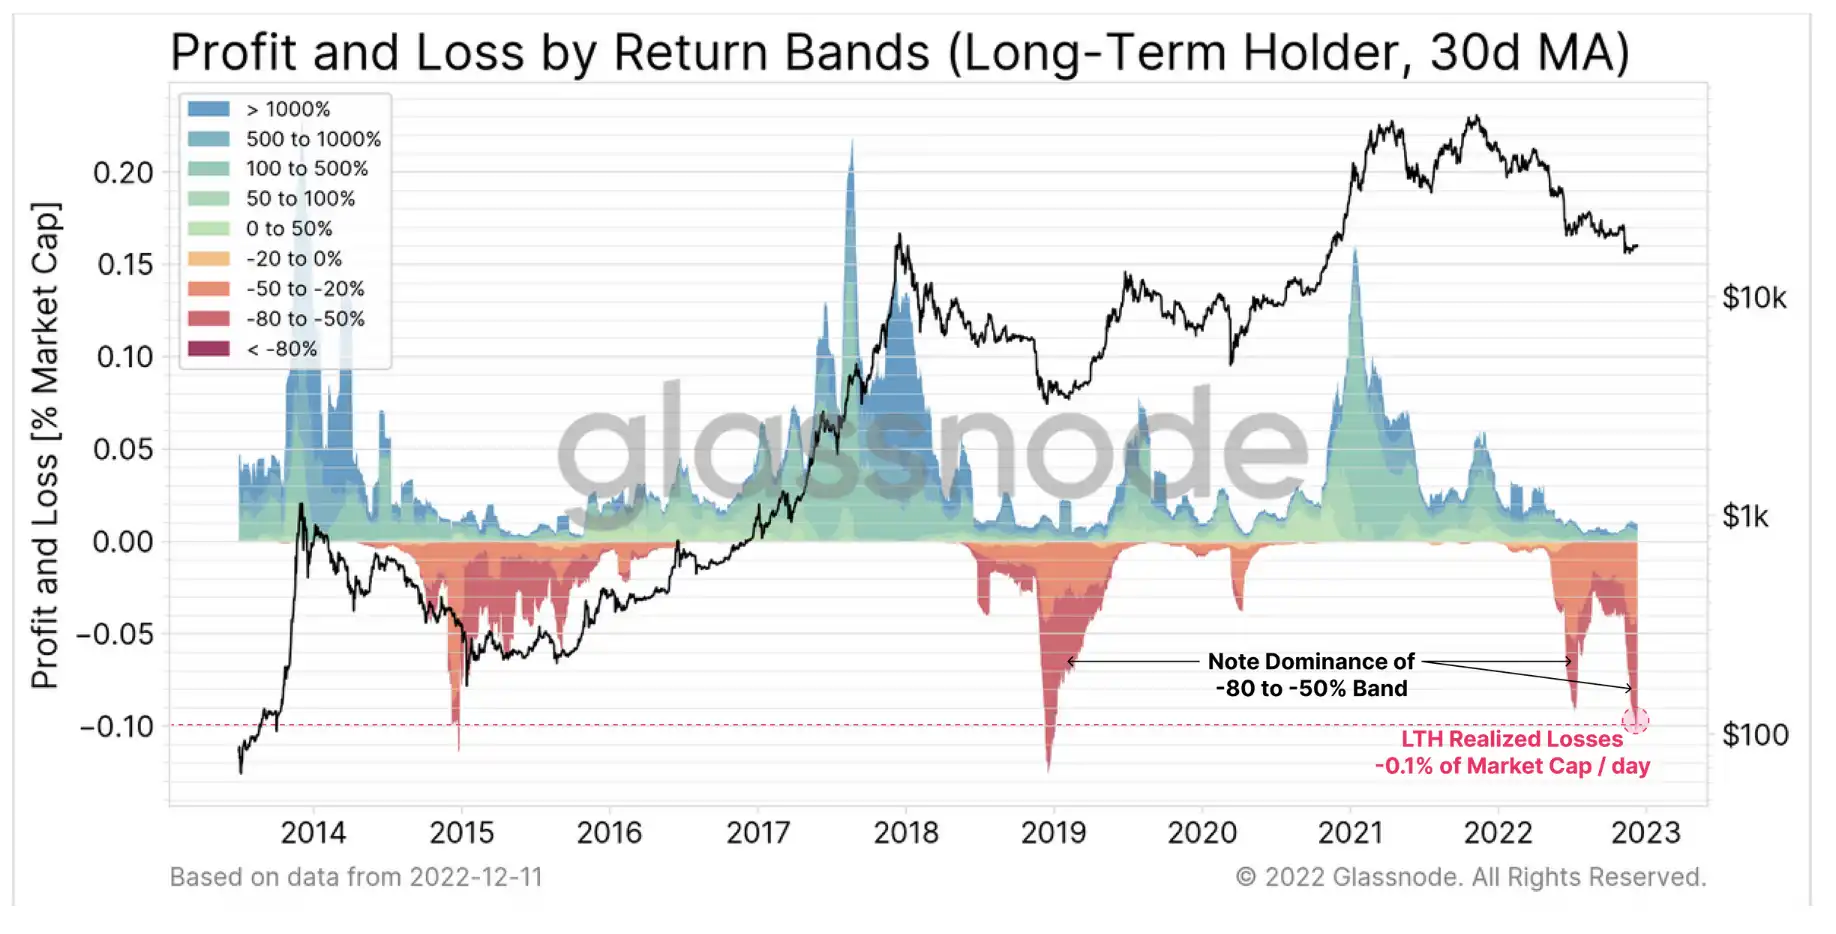
Of note is the contribution of long-term holders (LTH), who have achieved the two largest relative loss peaks in history during this cycle. By November, LTH's losses peaked at minus 0.10 per cent of market value per day, matching only the cycle lows of 2015 and 2018. The sell-off in June was equally impressive when it reached -0.09% of market value per day, with LTH's dominance locking in losses of -50% to -80%.
Take the long view
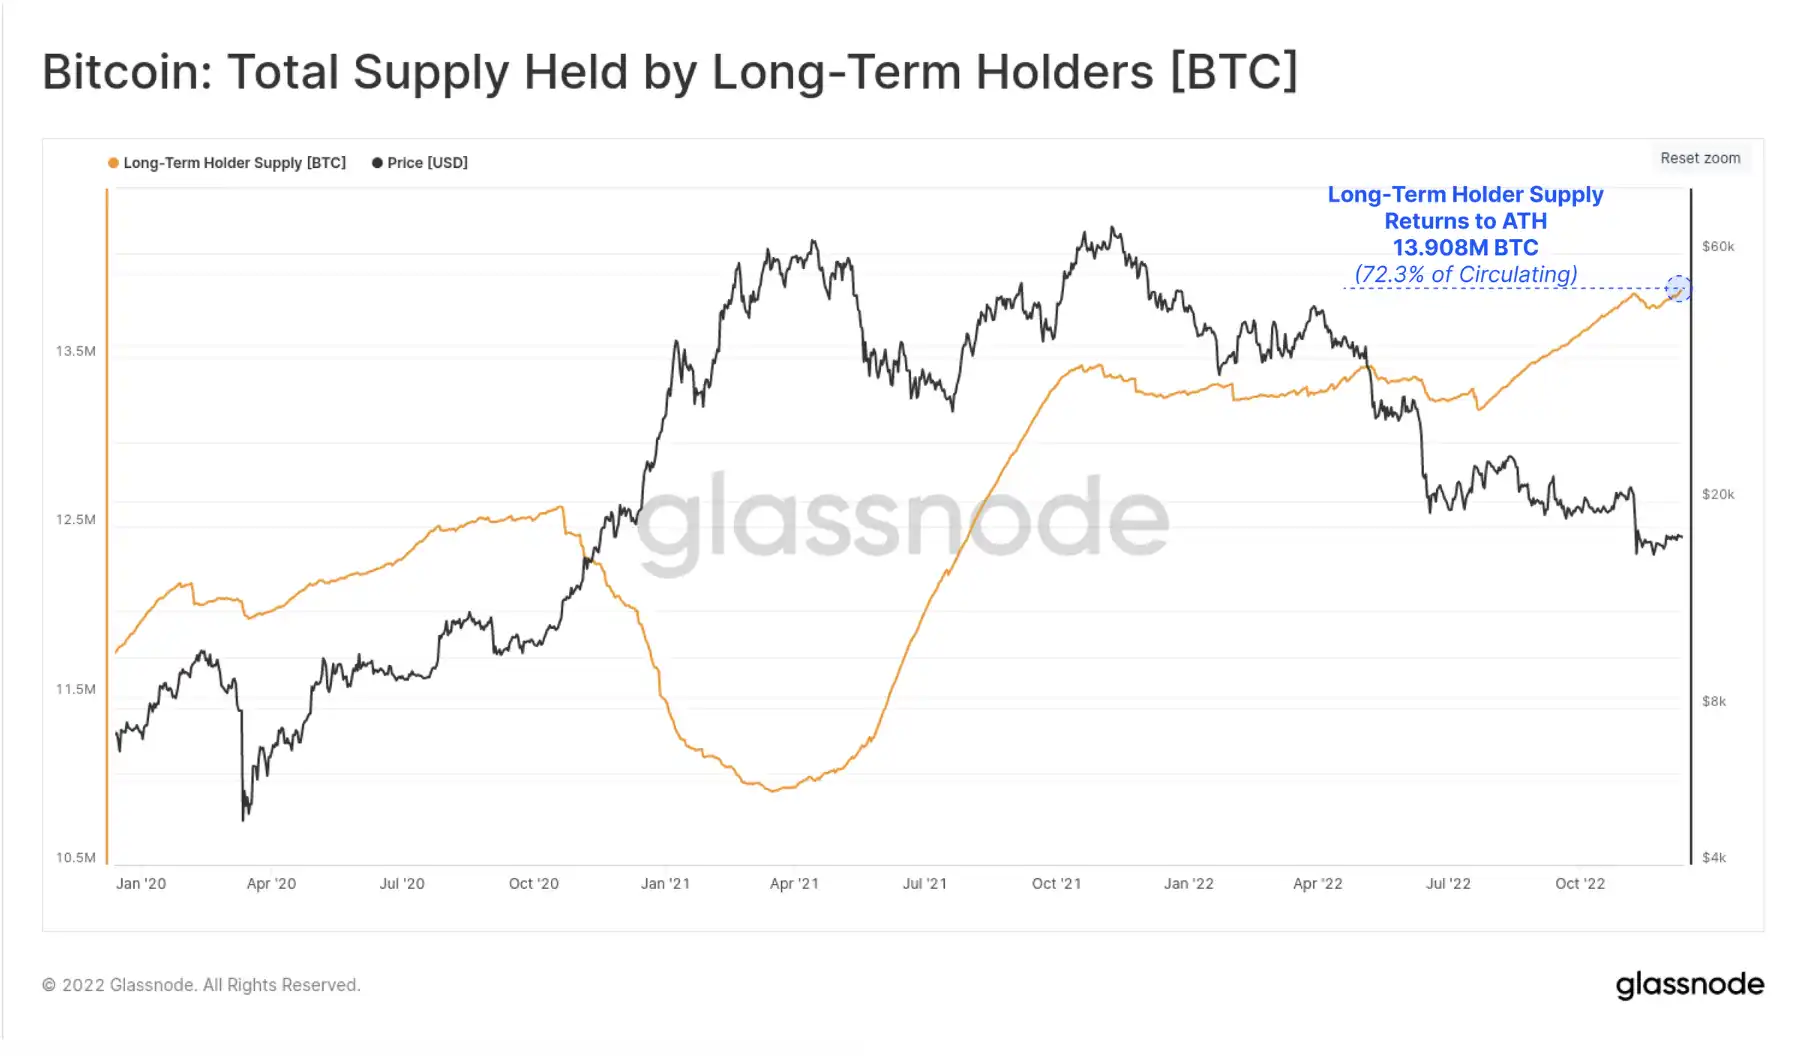
Despite these surprisingly large losses, the age of the coin supply and the HODL propensity of those who remain continue to rise. Long-term holder supply has completely reversed the panic spending after the FTX fiascos, recording 13.908 million BTC of new ATH (72.3% of outstanding supply).
The near linear upward trend of this indicator reflects the large BTC overweight that occurred in June 2022 and July 2022, immediately following the deleveraging event triggered by 3AC and the failed lenders in the space.
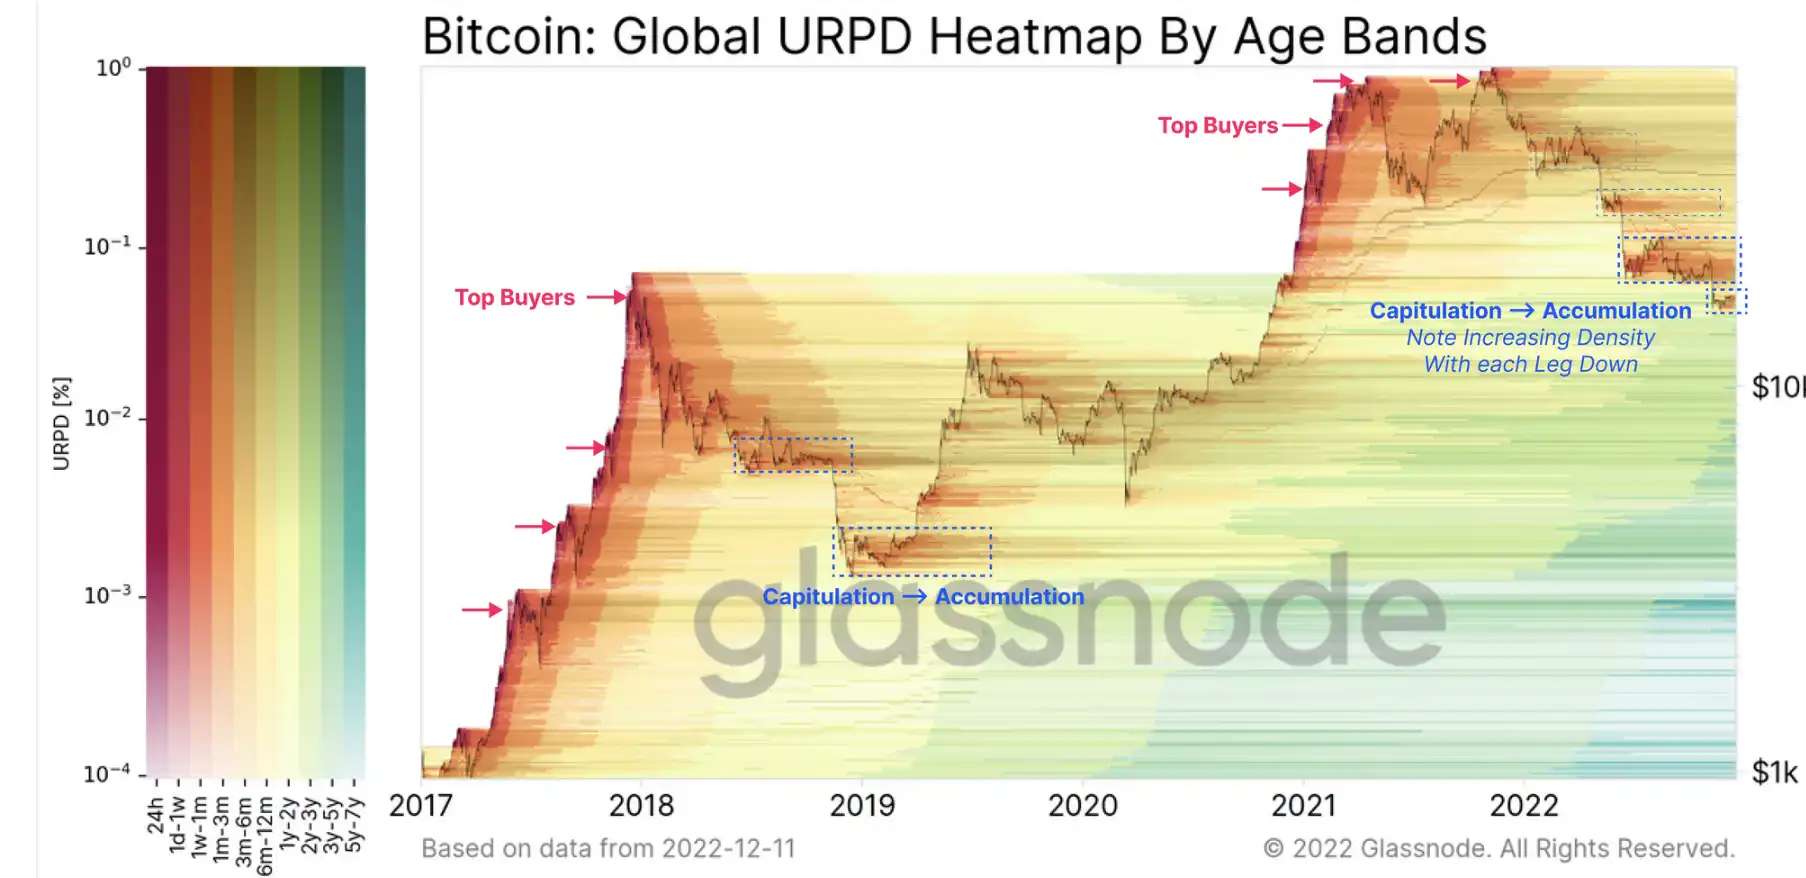
The figure below provides a view of the supply density and distribution of coins colored by coin age segment.
Note: Warm colors indicate a large distribution of old coins, which usually occur at market tops and surrender bottoms. Cooler colors indicate maturity, as investors accumulate and leave unused BTC. A deeper bar indicates a heavier coin density (and vice versa).
After each market decline in 2022, we can see an increase in BTC redistribution density (and therefore reaccumulation). In particular, the June 2022 to October 2022 area stands out, with many BTCS acquired in the $18,000 - $24,000 range, and they are now aged into the 6 + month range (hence the increase in LTH supply above).
Hard times for miners
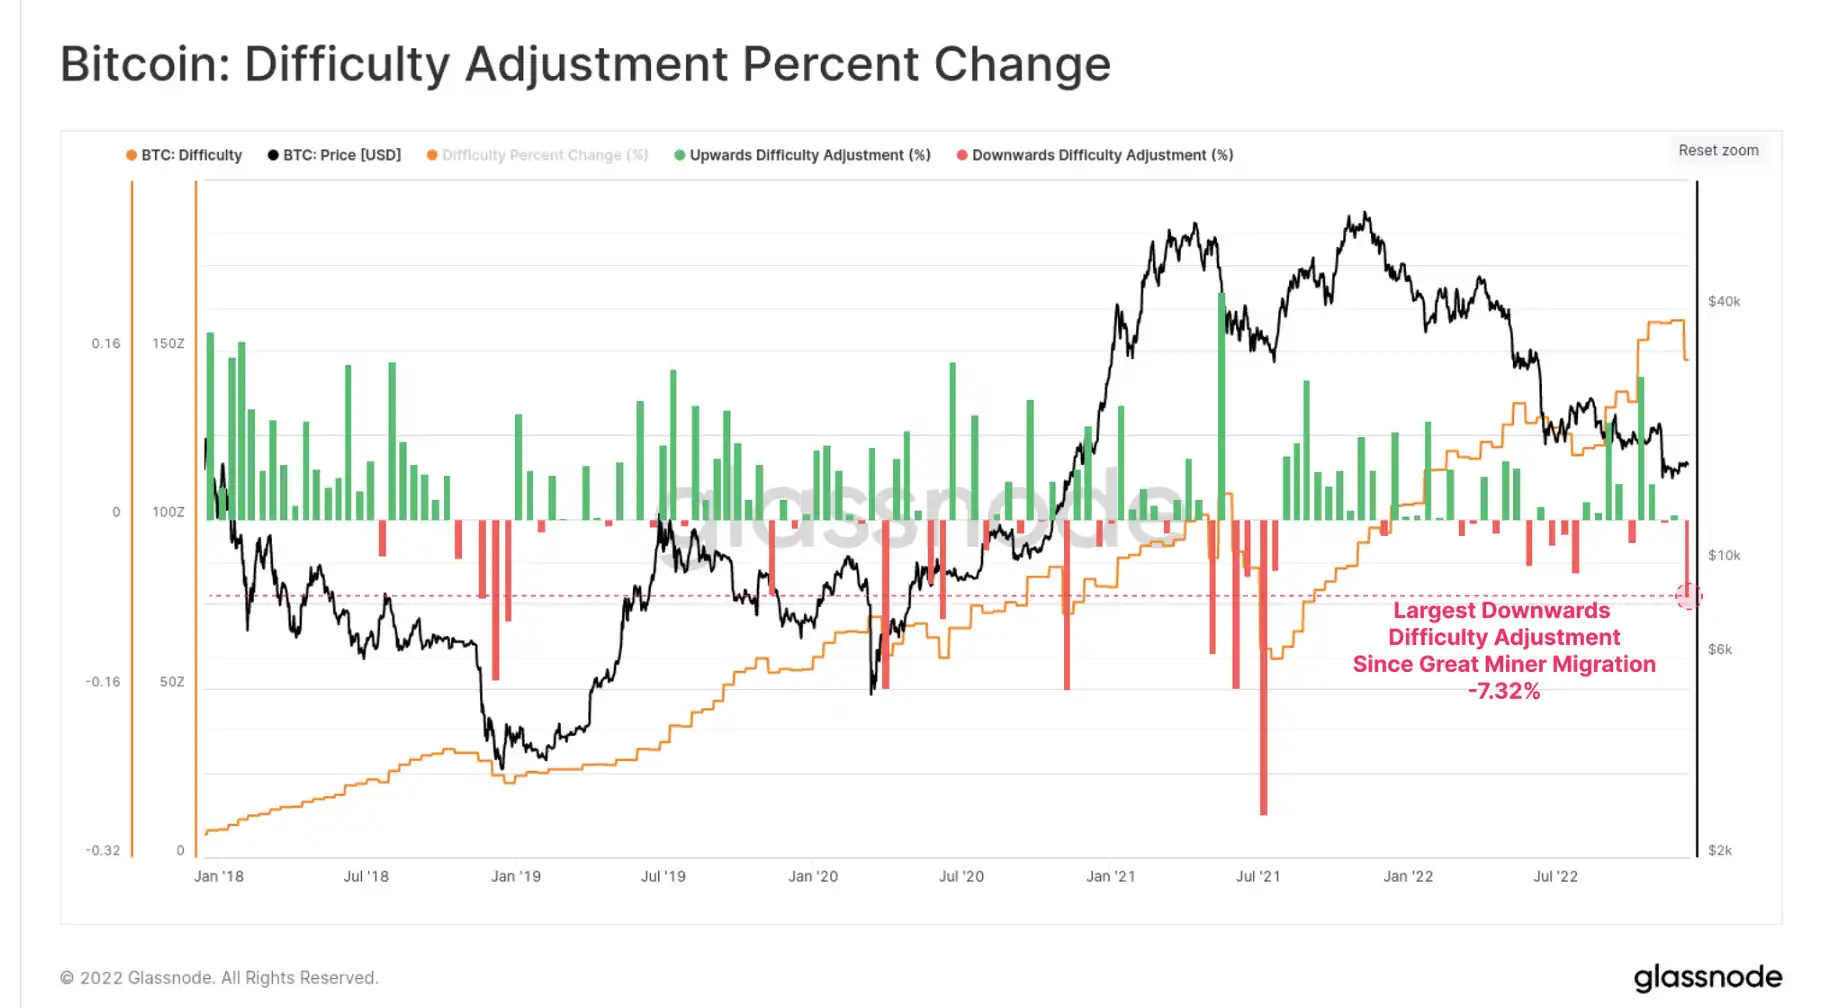
Last week saw the biggest cut in mining difficulty since the Great Migration in July 2021. A 7.32% drop in difficulty means that a significant portion of the active computing power is turned off, which is likely due to ongoing revenue pressures.
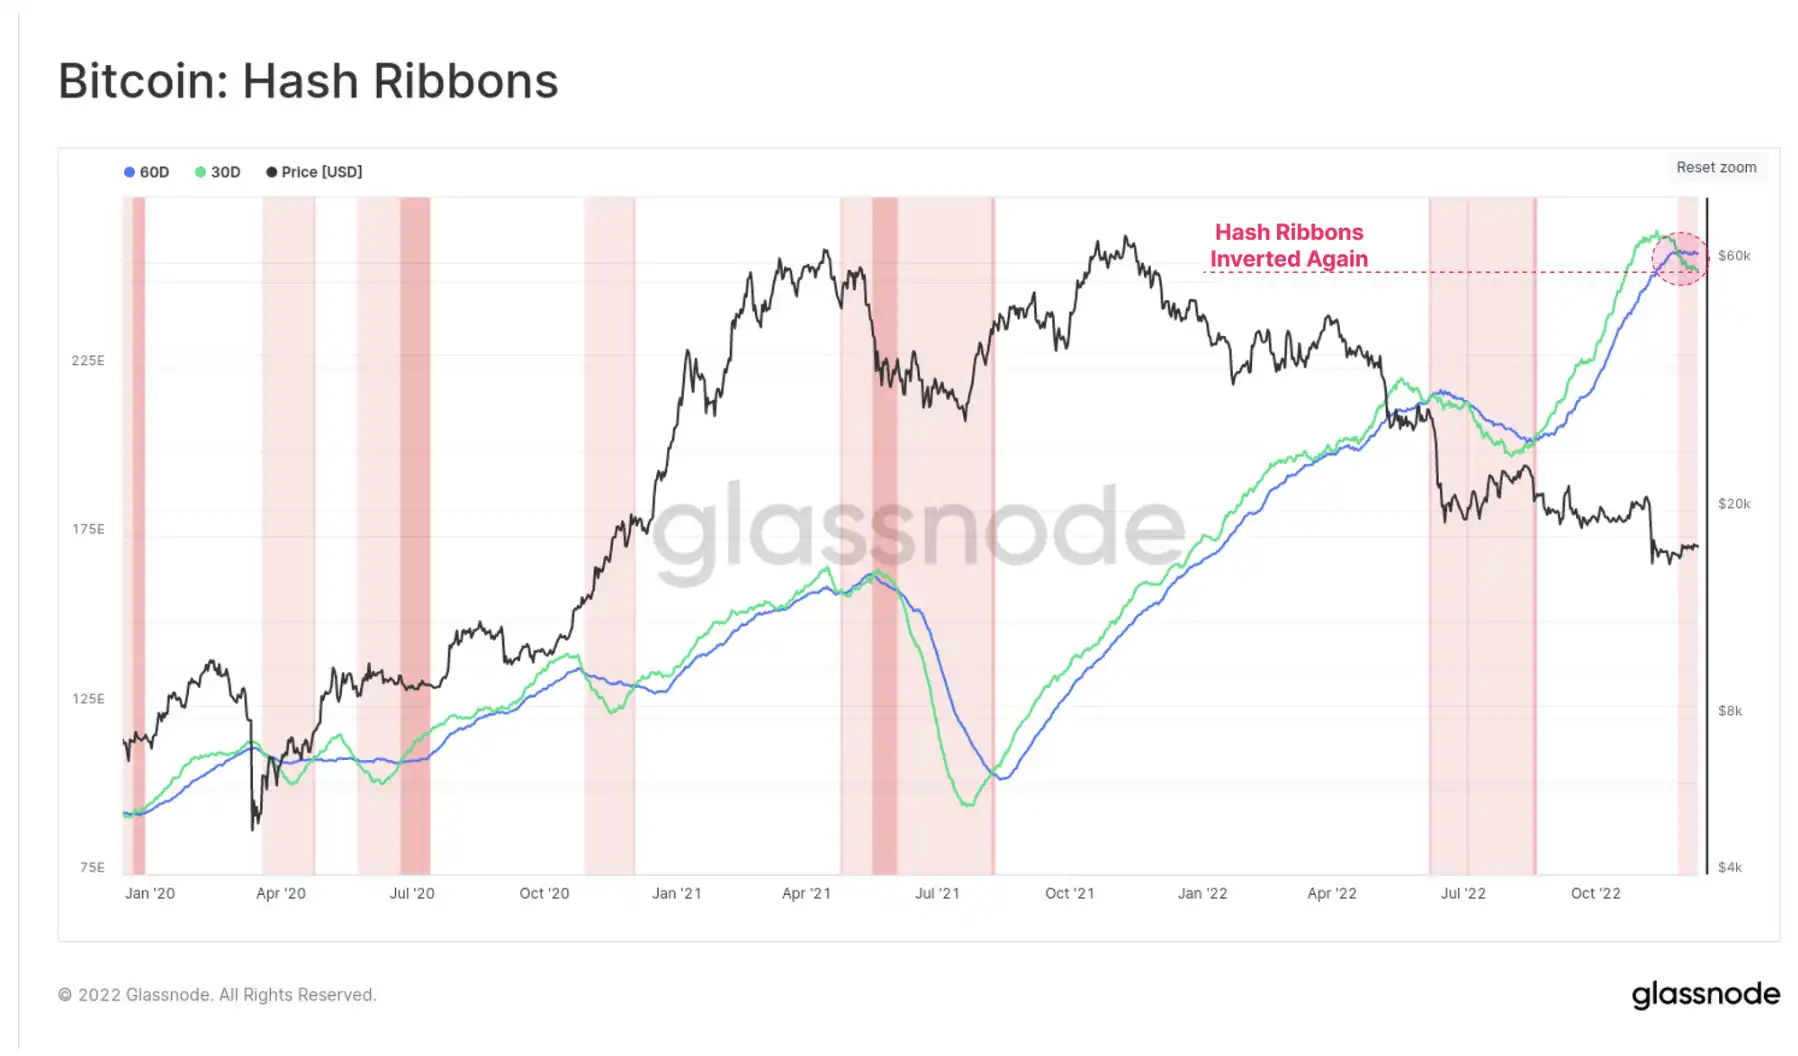
This caused the band to reverse again, with the crossover occurring in late November. This suggests that mining is under enough pressure that some operators are shutting down ASIC mines. This is usually related to miners' income streams being lower than their OPEX payouts, thus making ASIC miners unprofitable.
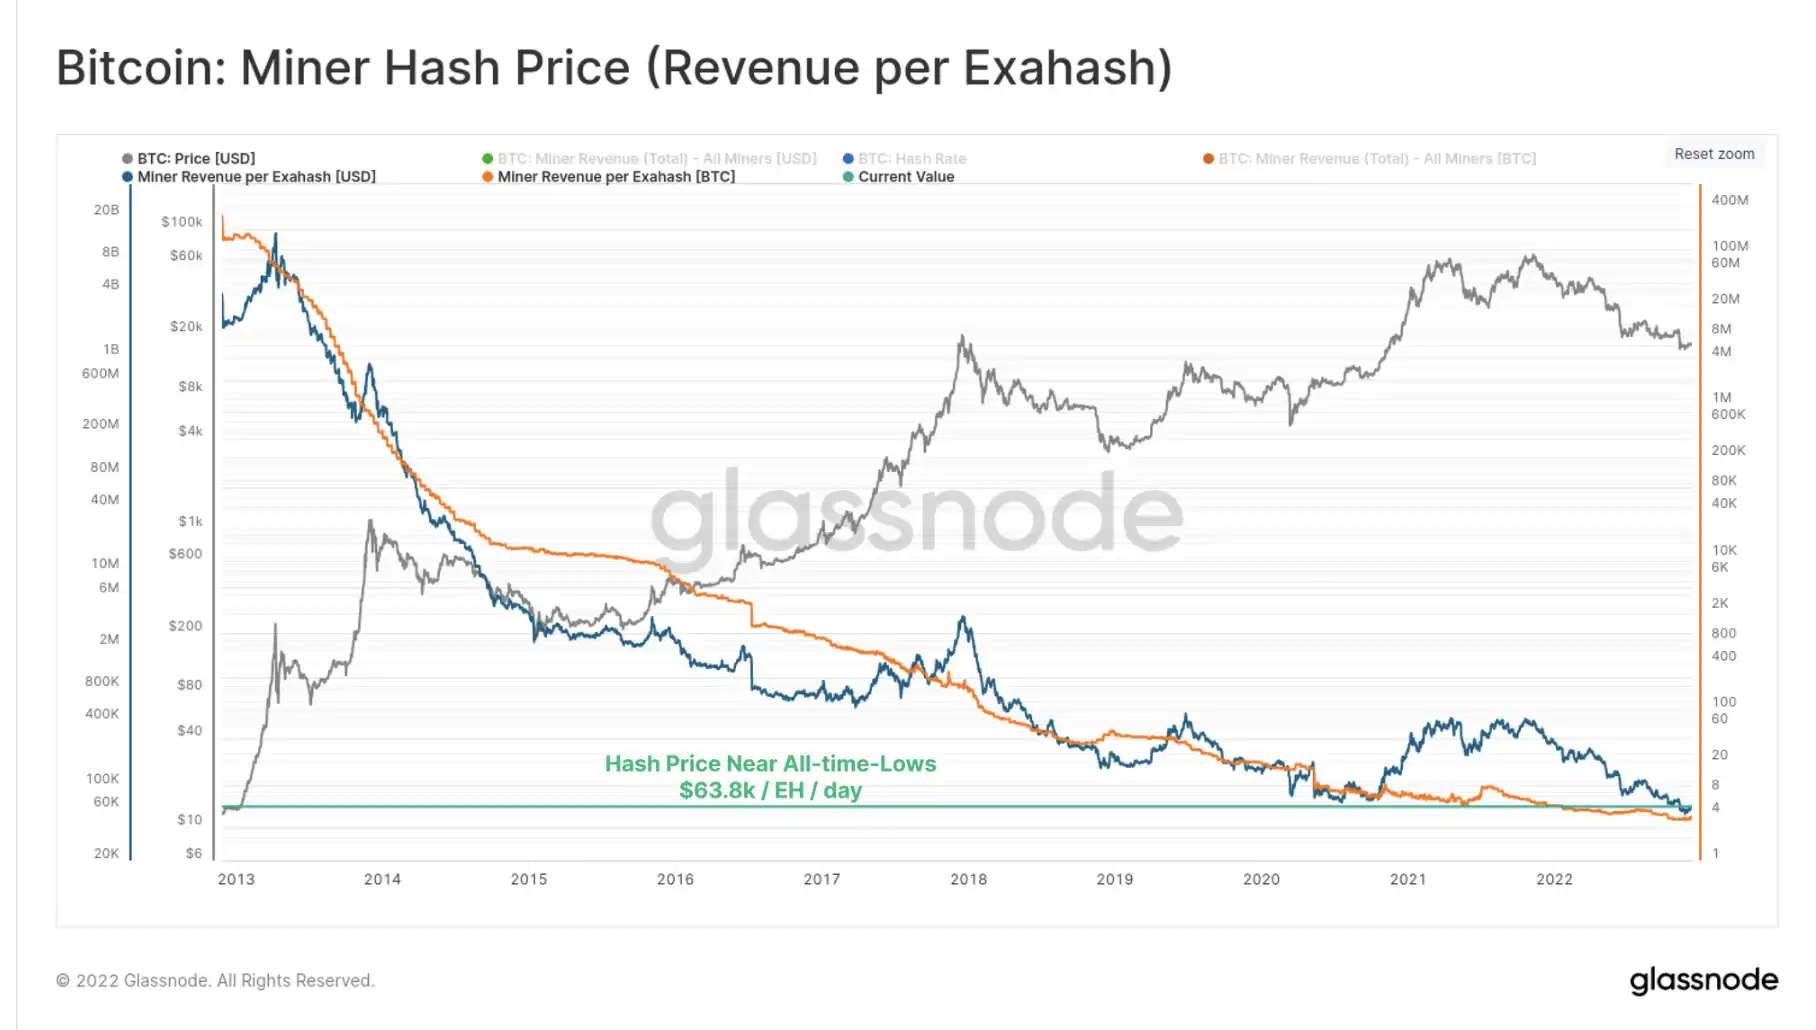
However, this is not surprising given that the price of computing power is only slightly above its historic lows. While the spot price (around $17,000) is 70% higher than it was in October 2020 (around $10,000), the amount of computing power competing to find the next bitcoin block is now 70% higher.
After the Ethereum merger
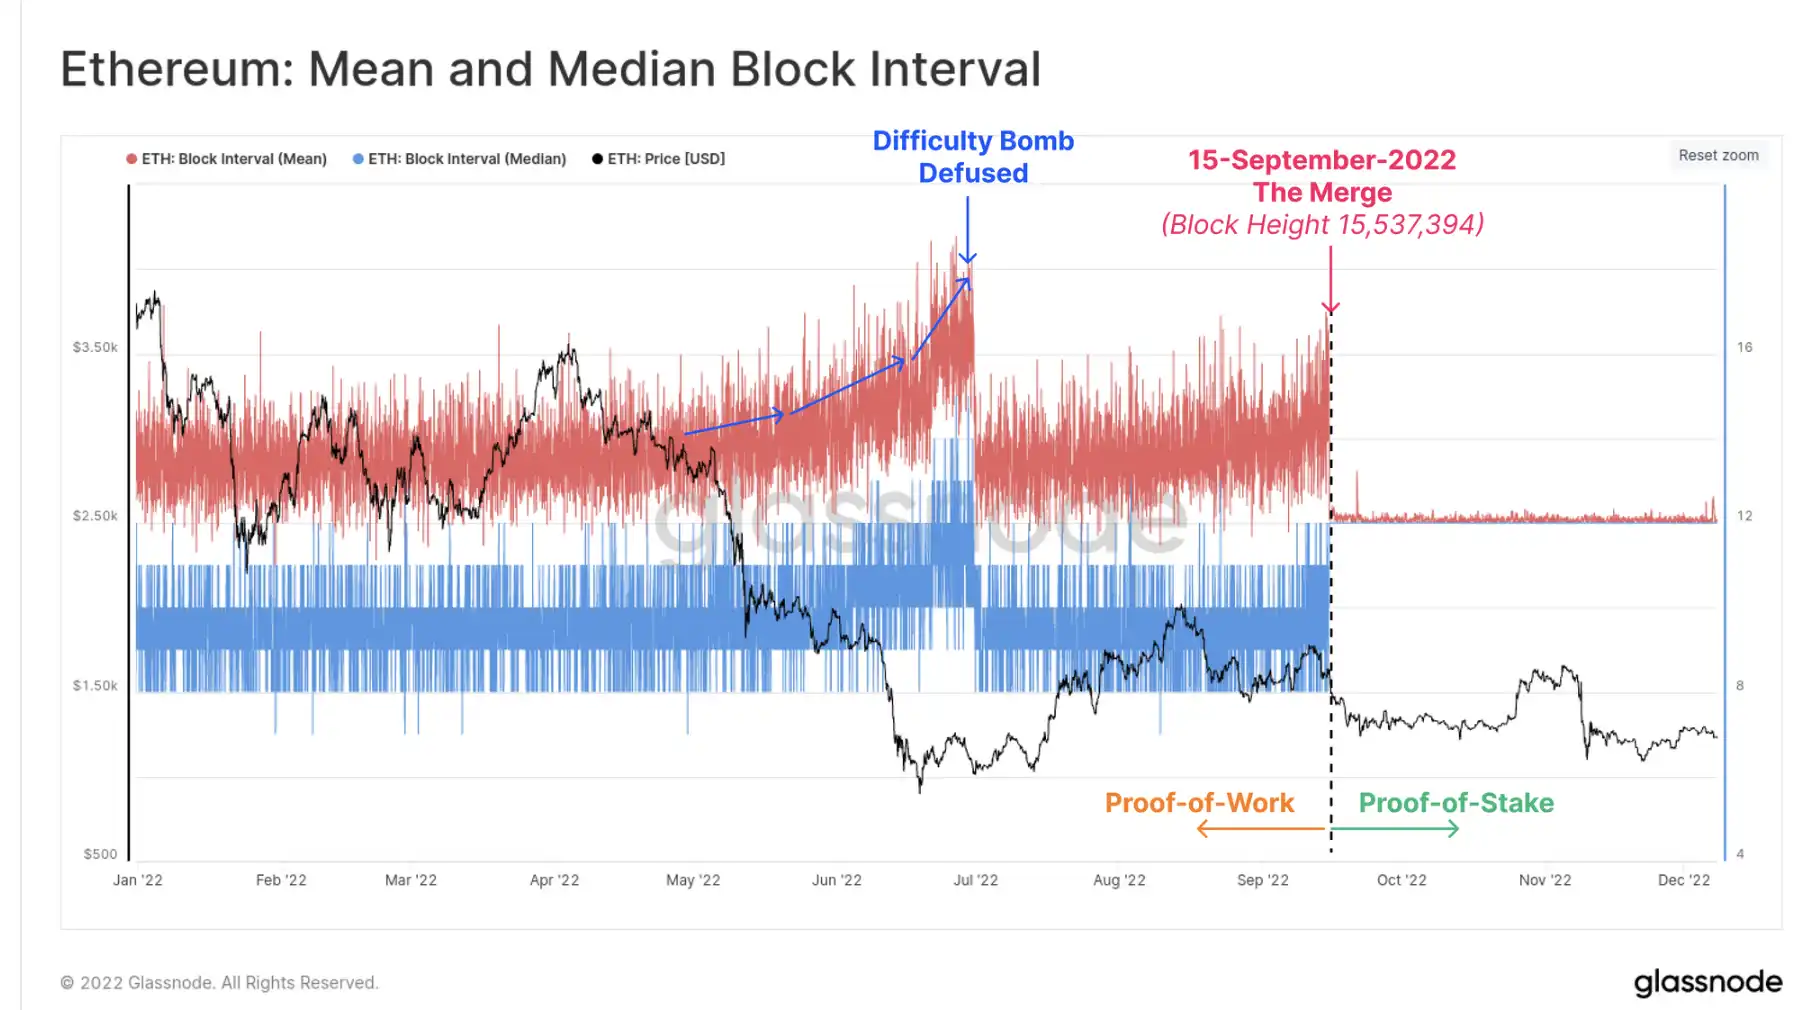
The Ethereum merger was completed on September 15, arguably the most impressive engineering feat of the year. To visualize the immediacy of events, the figure below shows the mean and median block intervals during 2022. It is obvious that we can observe where the natural and probabilistic variability of proof-of-work (PoW) ends and when the 12-second block time of precise, pre-determined proof-of-interest (PoS) kicks in.
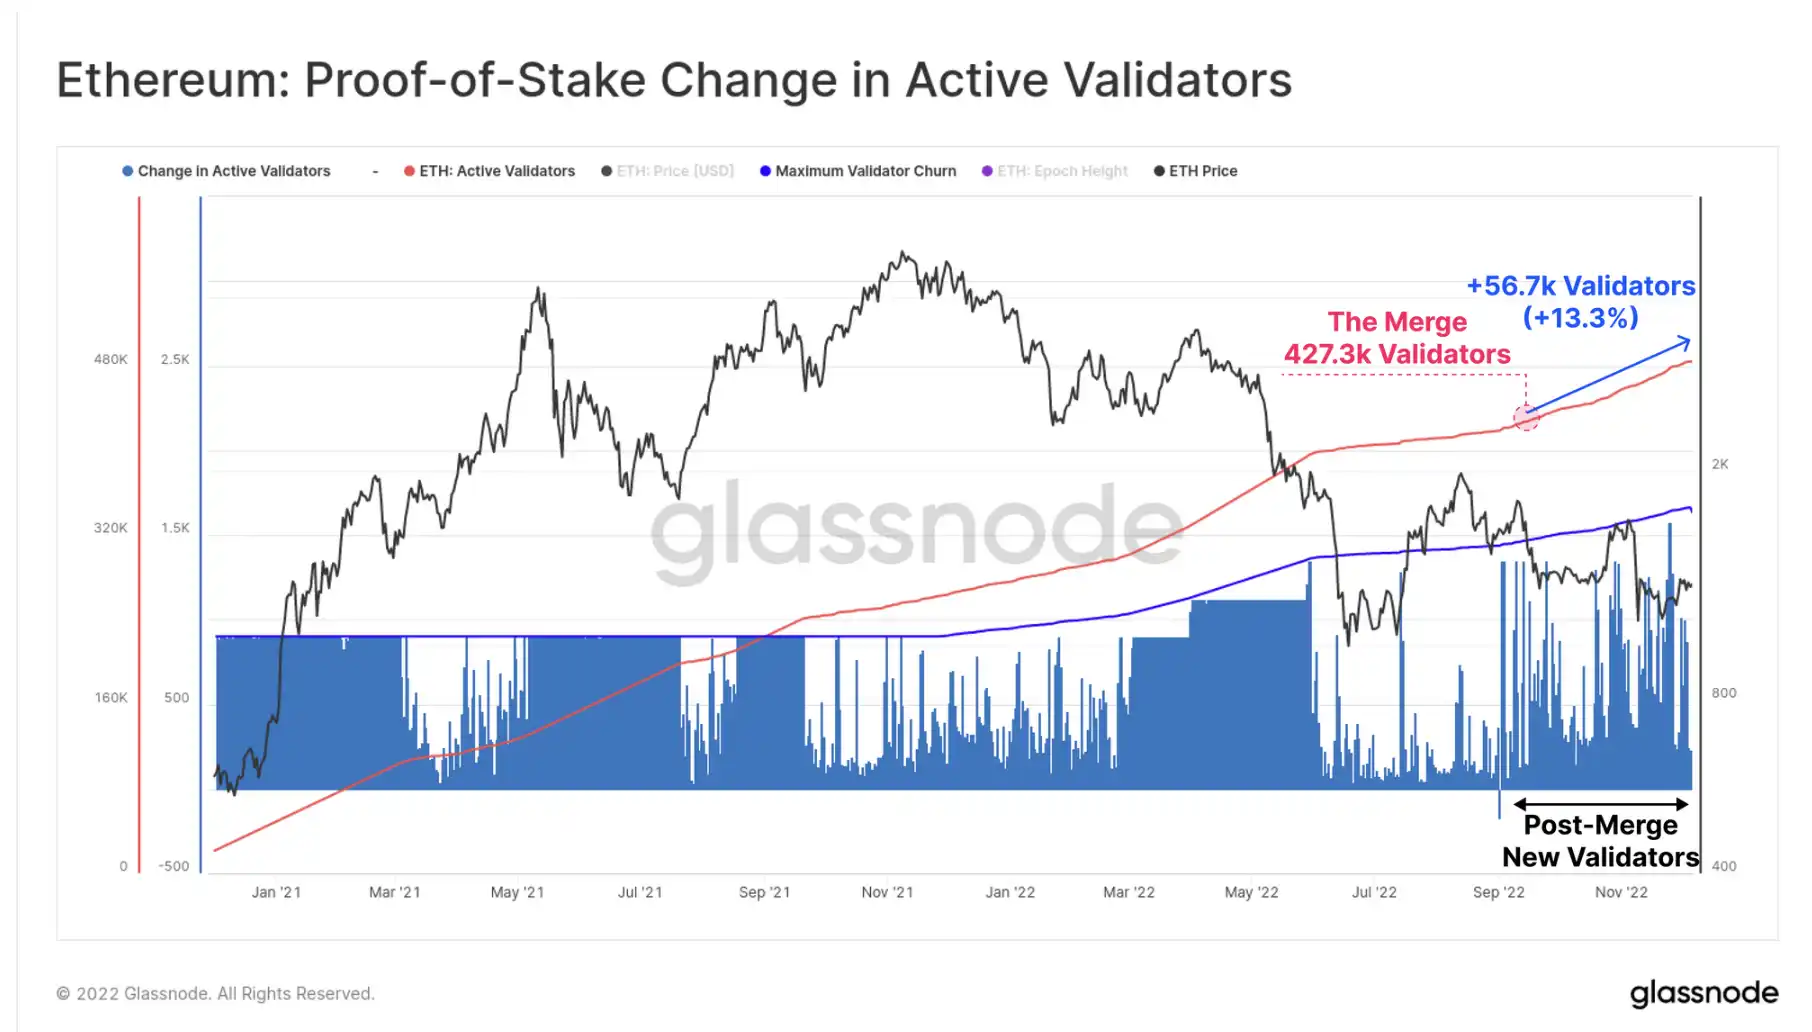
Since the merger, the number of active Ethereum validators has increased by 13.3%, and there are now more than 484,000 in operation. This brings the total amount pledged to 15.618 million ETH, equivalent to 12.89% of the supply in circulation.
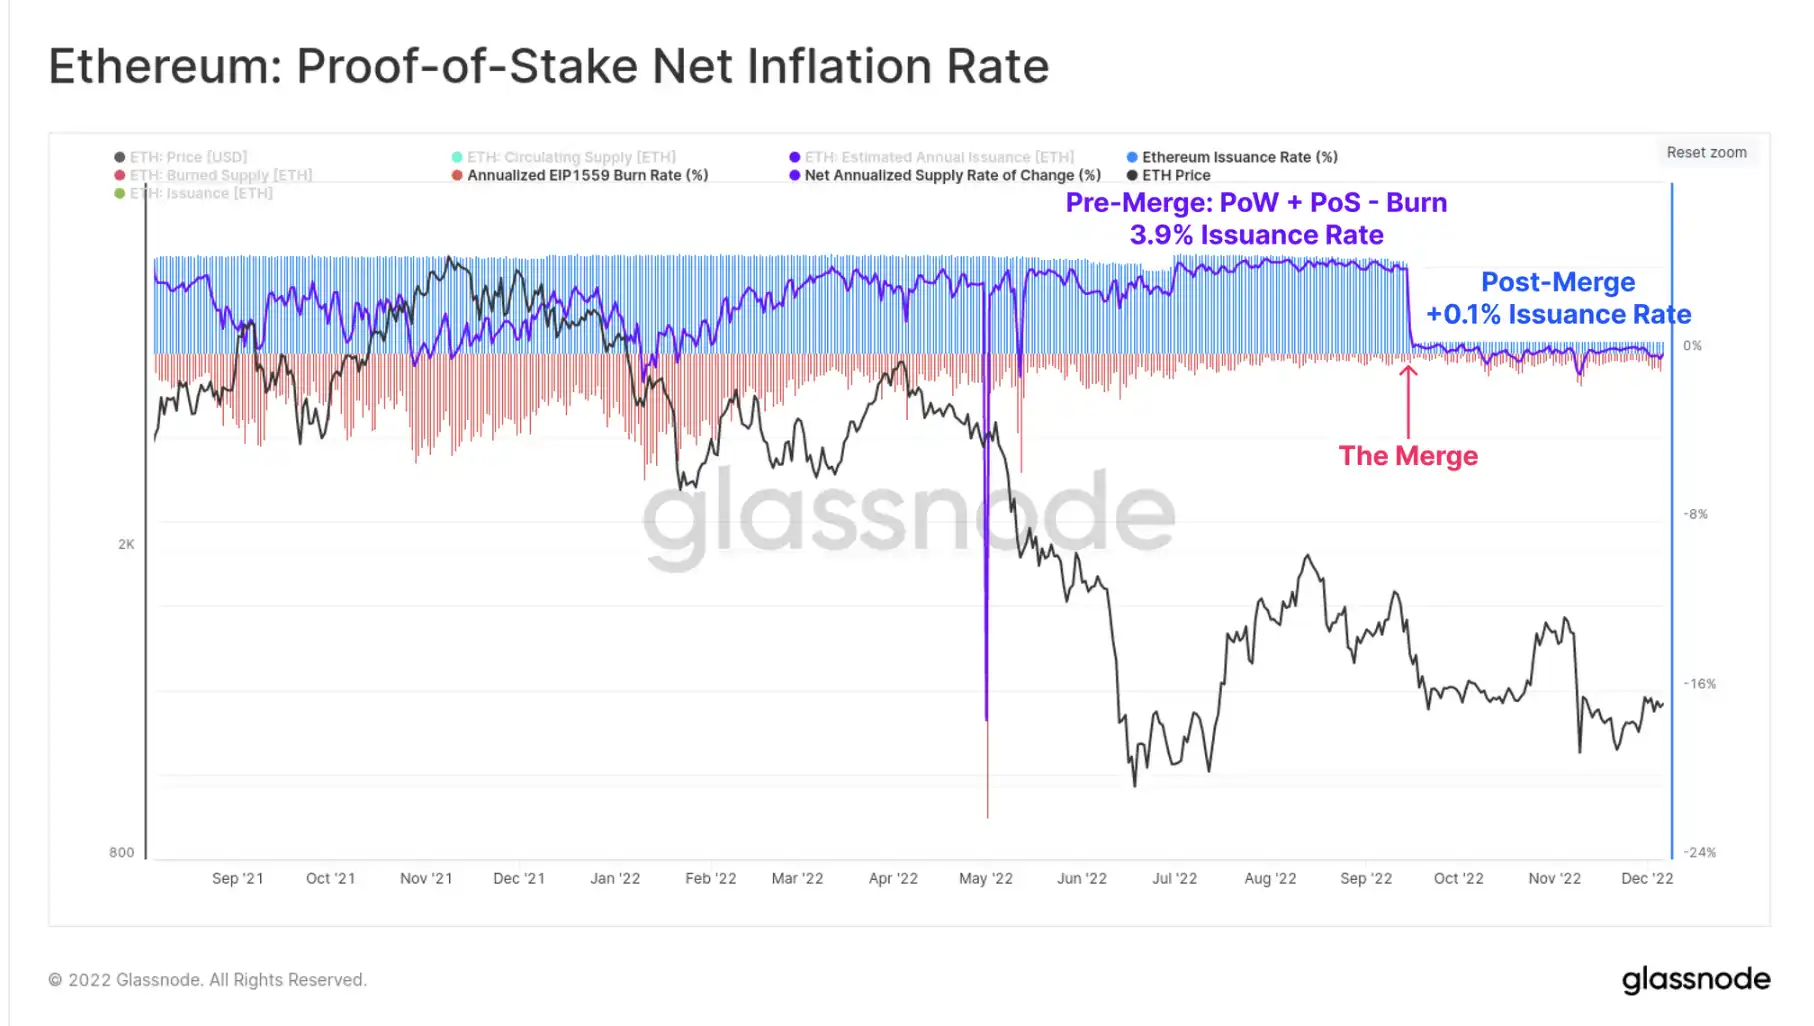
With the transition to Proof of Equity (PoS), Ethereum monetary policy was adjusted to a significantly lower emissions program. The notional release rate (blue) is around +0.5%, but after taking into account the EIP1559 burning mechanism (red), this almost completely cancels out the release. That compares with a net inflation rate of +3.9% before the merger, showing just how dramatic the change in issuance has been.
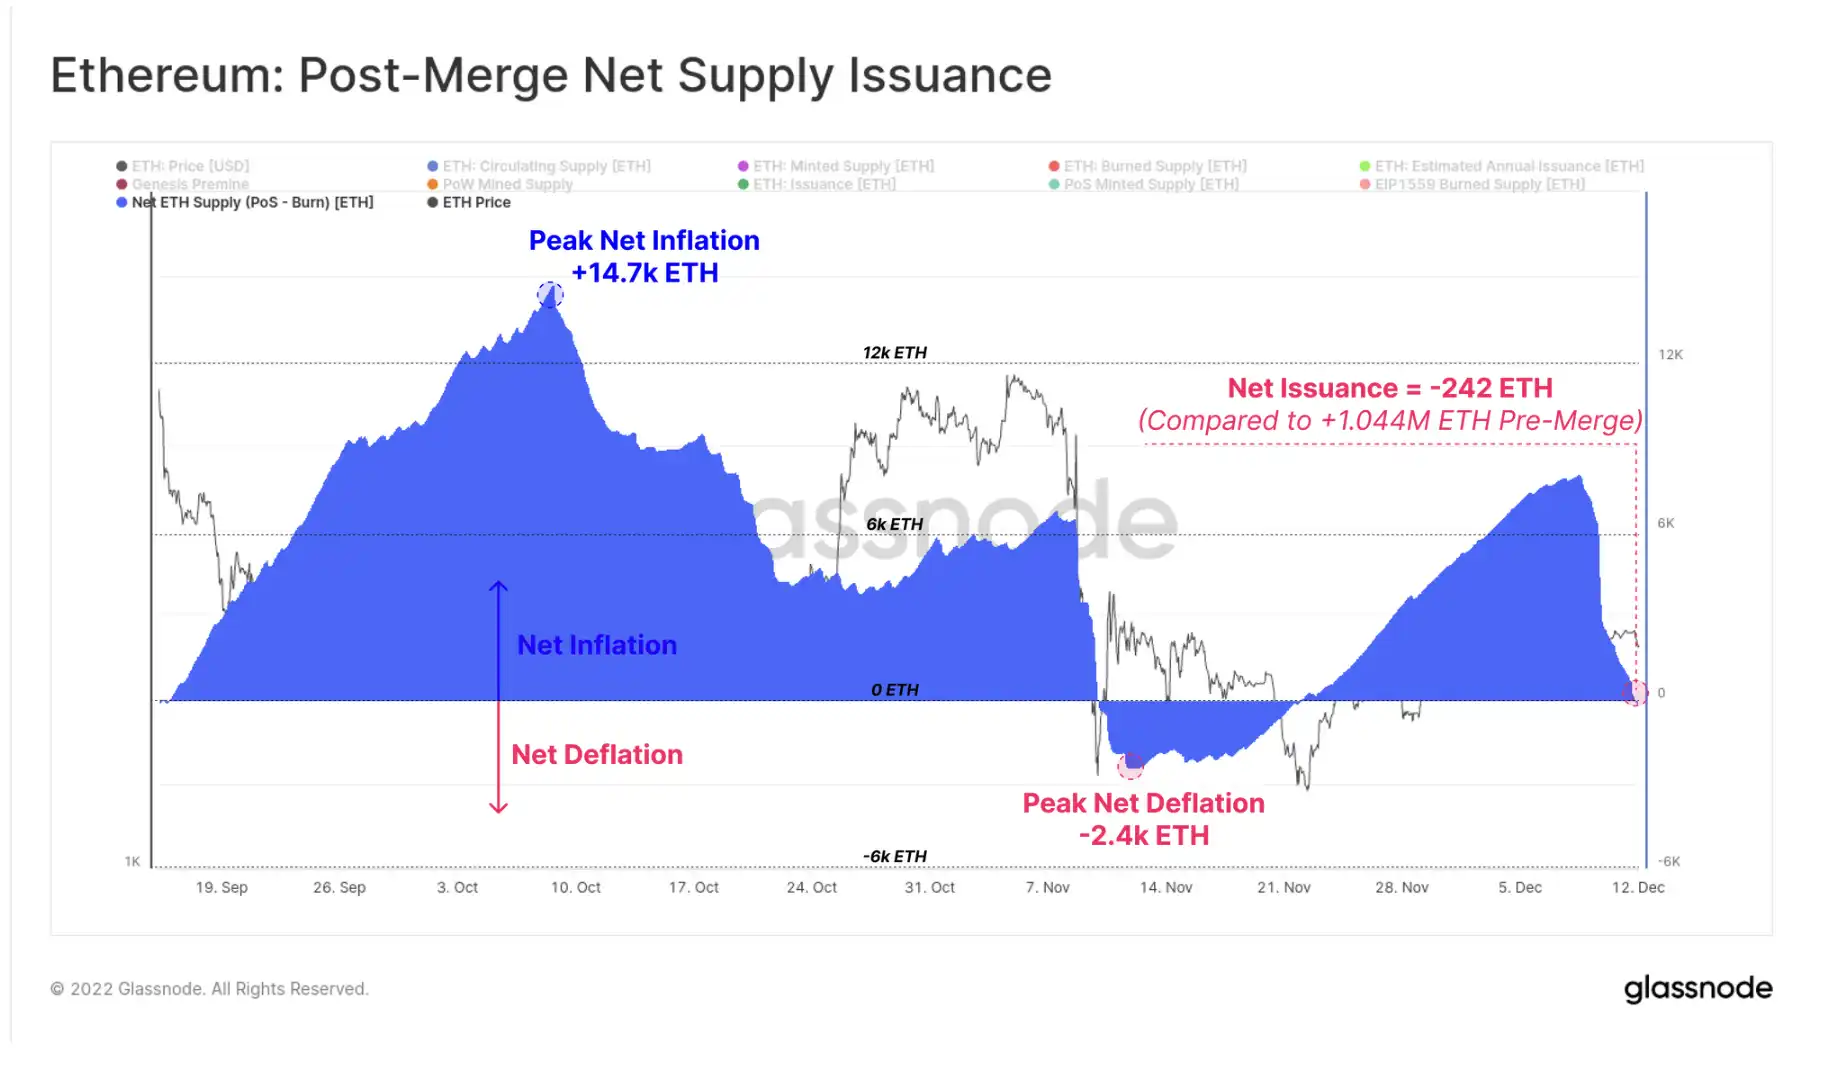
At the time of writing, the change in ETH supply since the merger has just turned into a net contraction, with ETH supply now 242 ETH lower than at the time of the merger. This compares with an estimated 1,044,000 ETH that should have been added under the previous issuance plan.
DeFi deleveraging
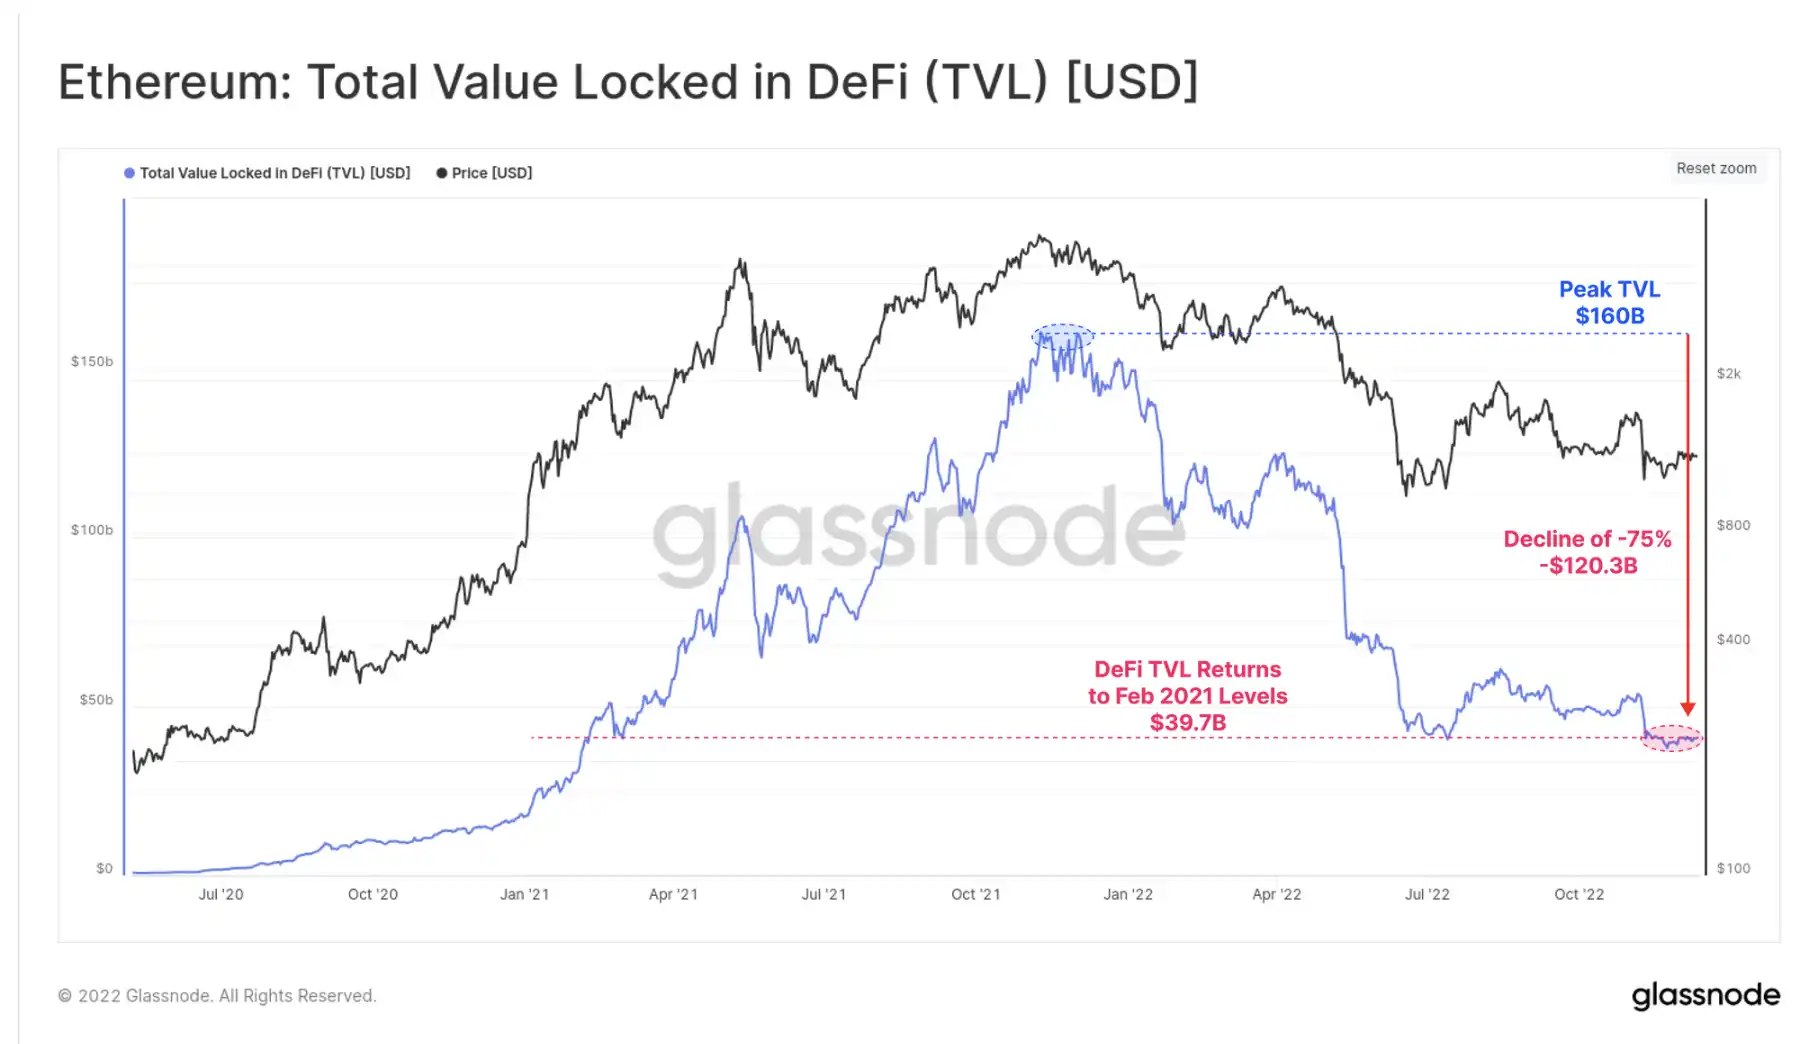
The total value locked in DeFi has fallen sharply as token prices have fallen sharply and liquidity has contracted severely. After the market peaked at $160 billion in November 2021, DeFi TVL fell by more than $120.3 billion (-75%). That brings the value of DeFi collateral down to $39.7bn, back to where it was in February 2021.
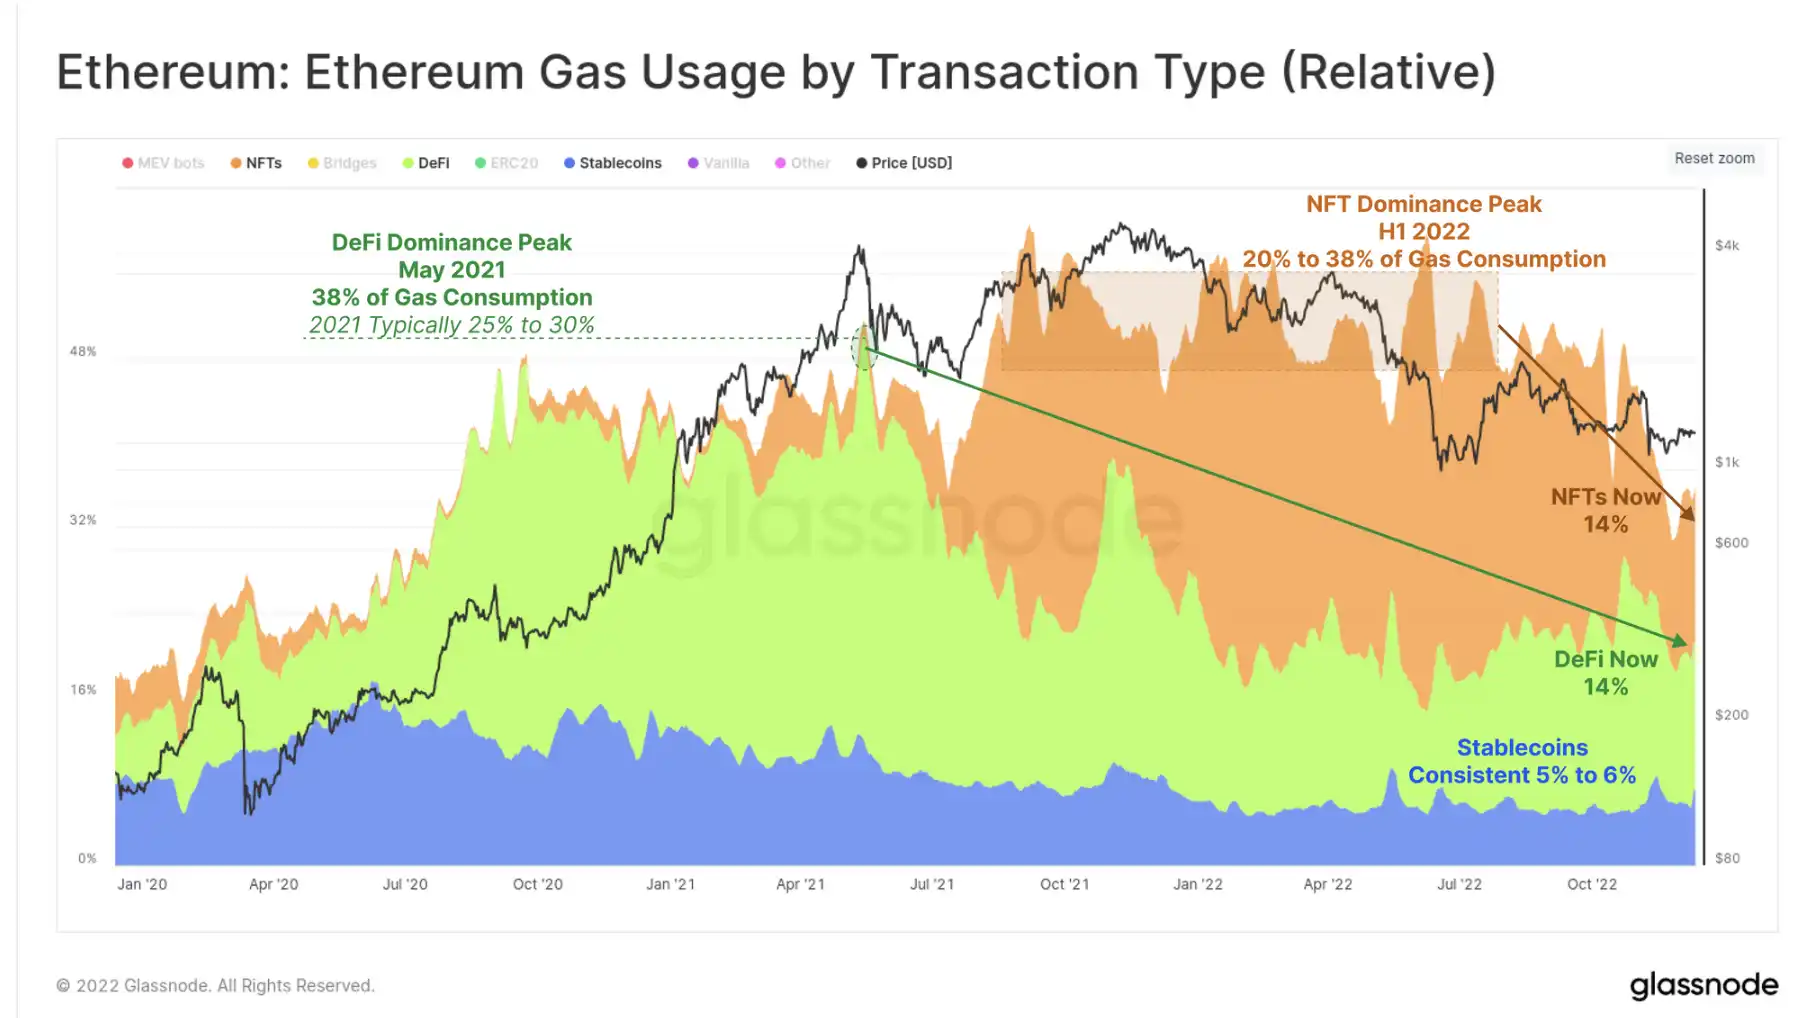
The dominance of gas consumption by type of transaction is also indicative of a change in market preferences over the past two years. DeFi agreements accounted for 25-30 per cent of all gas consumption from July 2020 to May 2021, but have since fallen to just 14 per cent.
During a similar boom-bust cycle, NFT-related deals accounted for 20 to 38 percent of gas usage by the first half of 2022, but that has also fallen to 14 percent dominance. Stablecoin In the whole year to maintain a stable 5 to 6 percent of the dominant position.
Stablecoin Out of
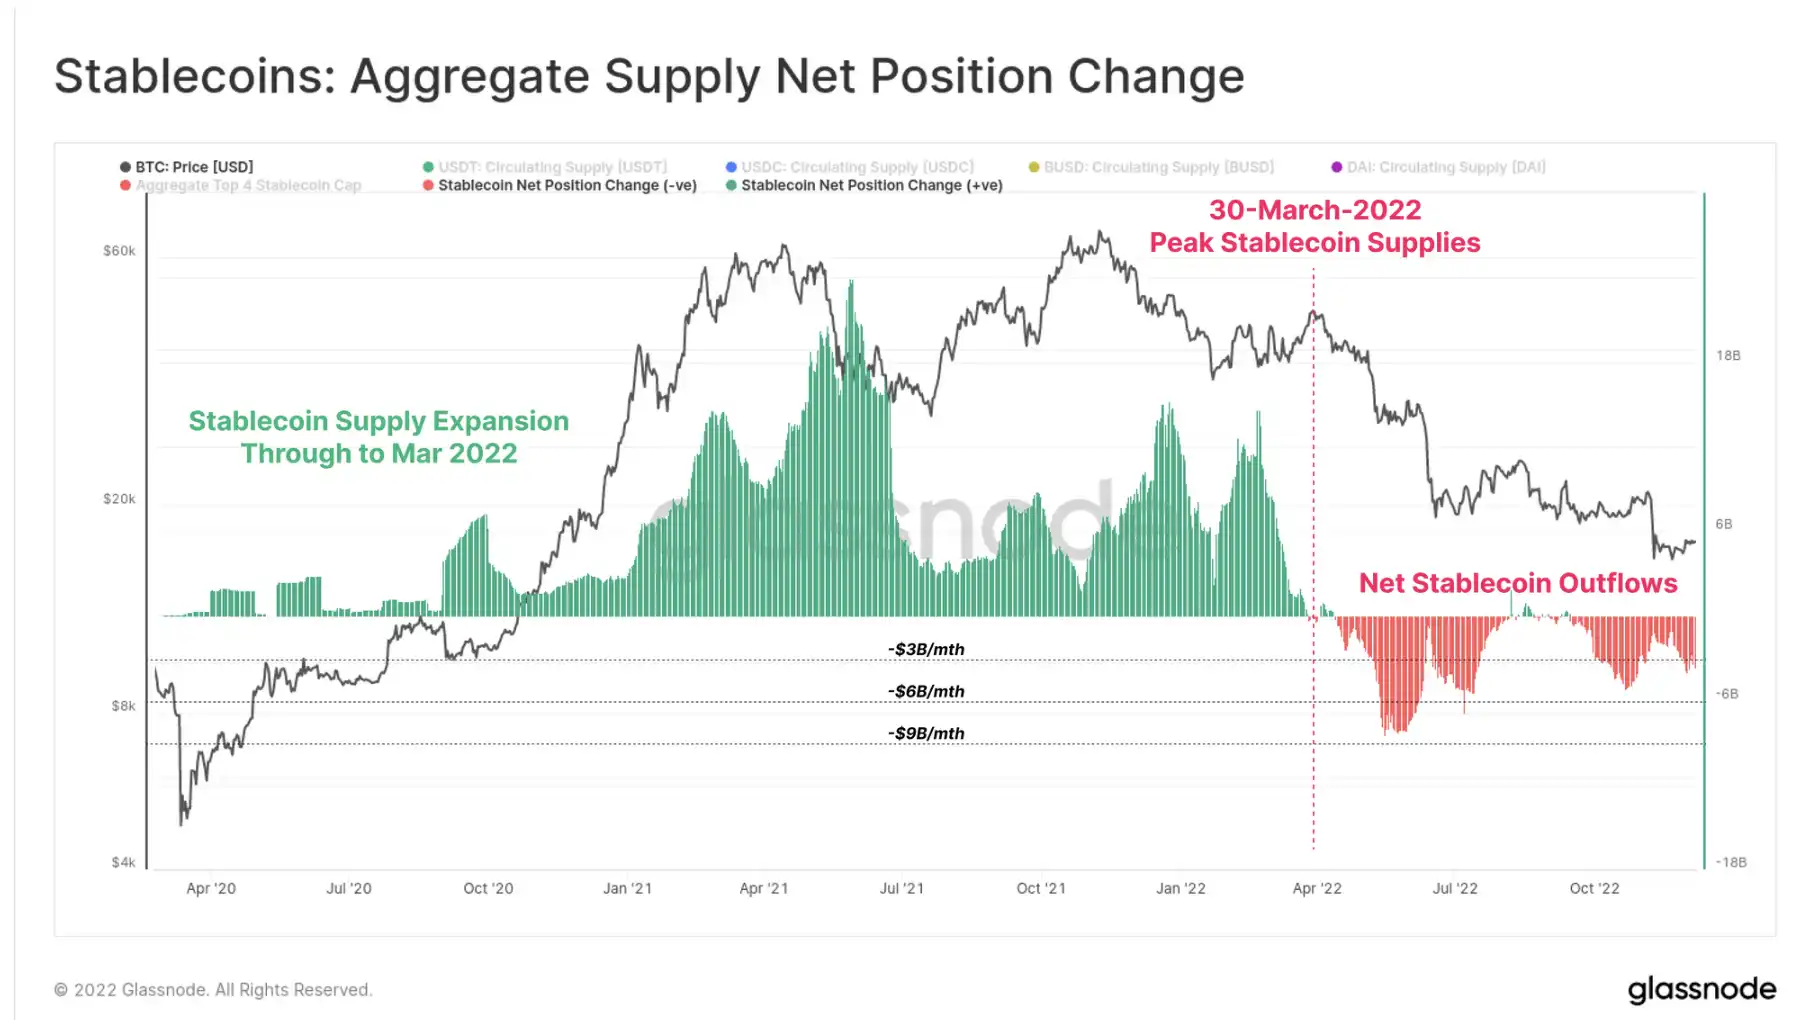
Stablecoin has become a cornerstone asset of the industry since 2020, with three of the top six assets by market capitalization now being Stablecoin assets. Stablecoin Total supply peaked at $161.5 billion in March 2022, but there have since been massive redemptions of more than $14.3 billion.
Overall, this reflects a net monthly capital outflow of $4bn - $8bn. However, it is also worth noting that this reflects only 8 per cent of peak Stablecoin supply, suggesting that much of the money remains in this new digital dollar.
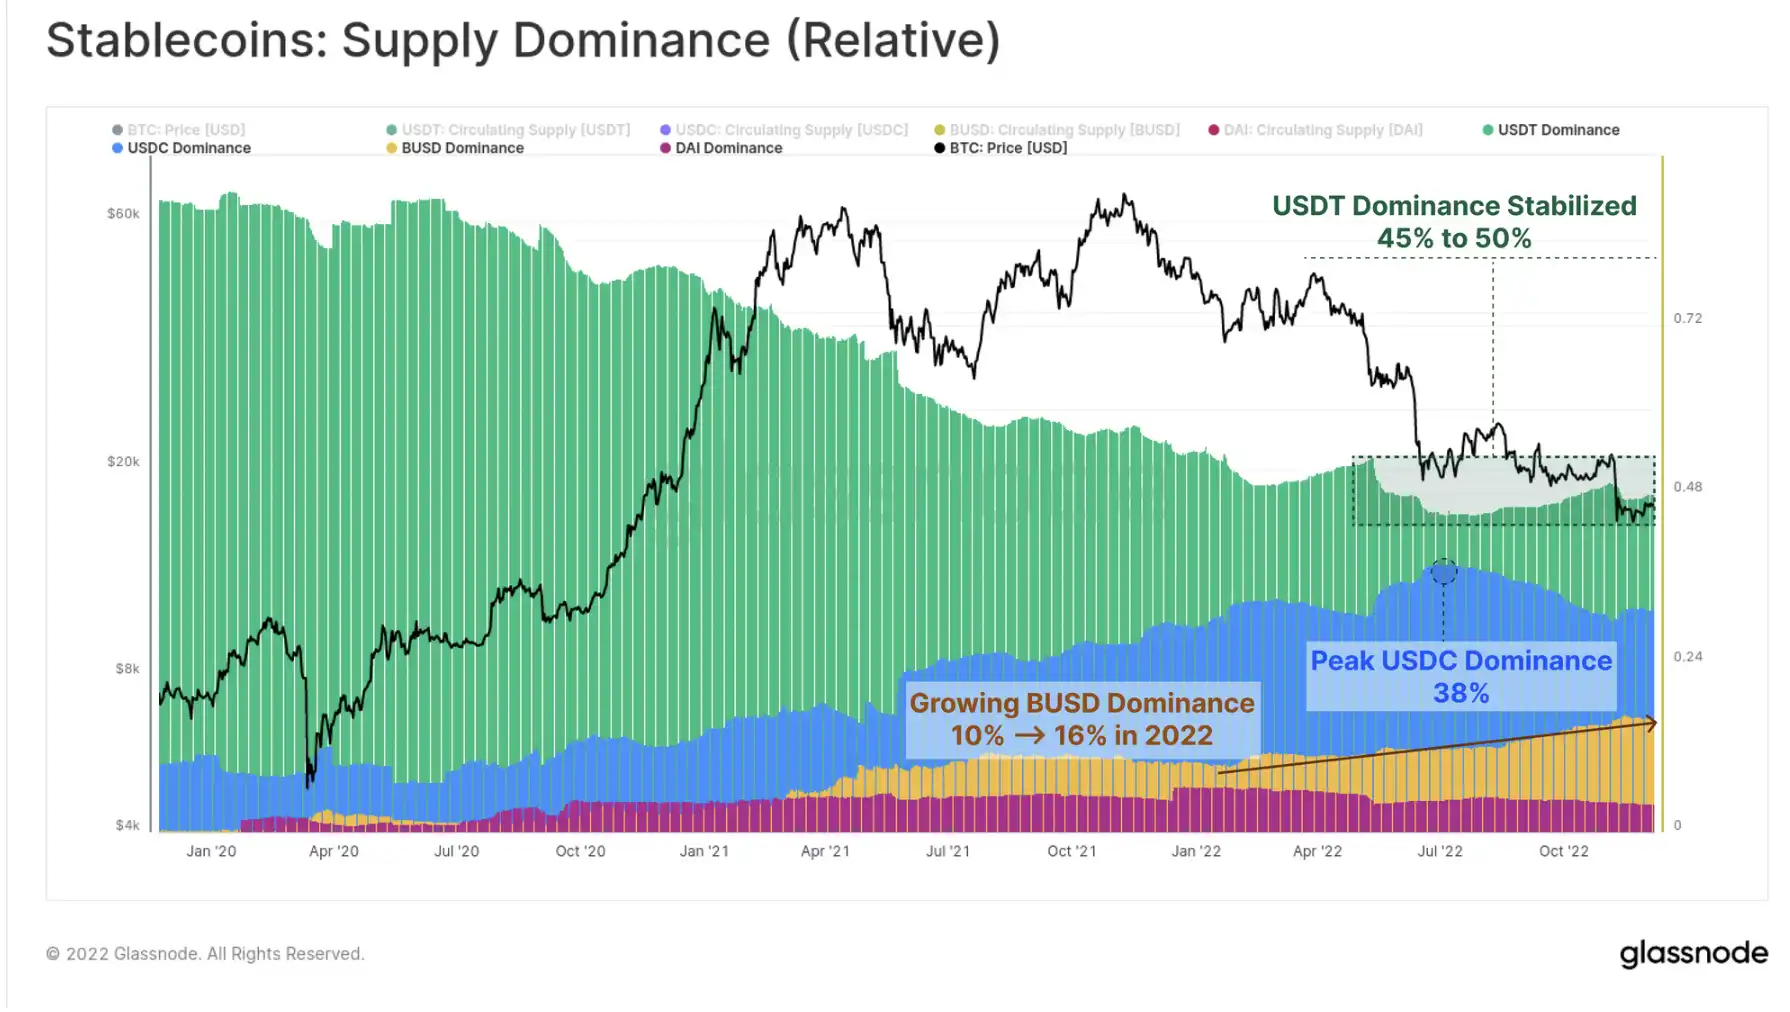
The relative Stablecoin supply dominance also changed significantly.
BUSD stands out, increasing its market share from 10% to 16% in 2022, and now has a total asset value of $22 billion.
Despite USDT redemptions totaling $18.42 billion since May, Tether has held relatively steady at 45 to 50 percent market share.
USDC's dominance peaked at 38 percent in June, but has since fallen to 31.3 percent, with the market now worth $44.75 billion.
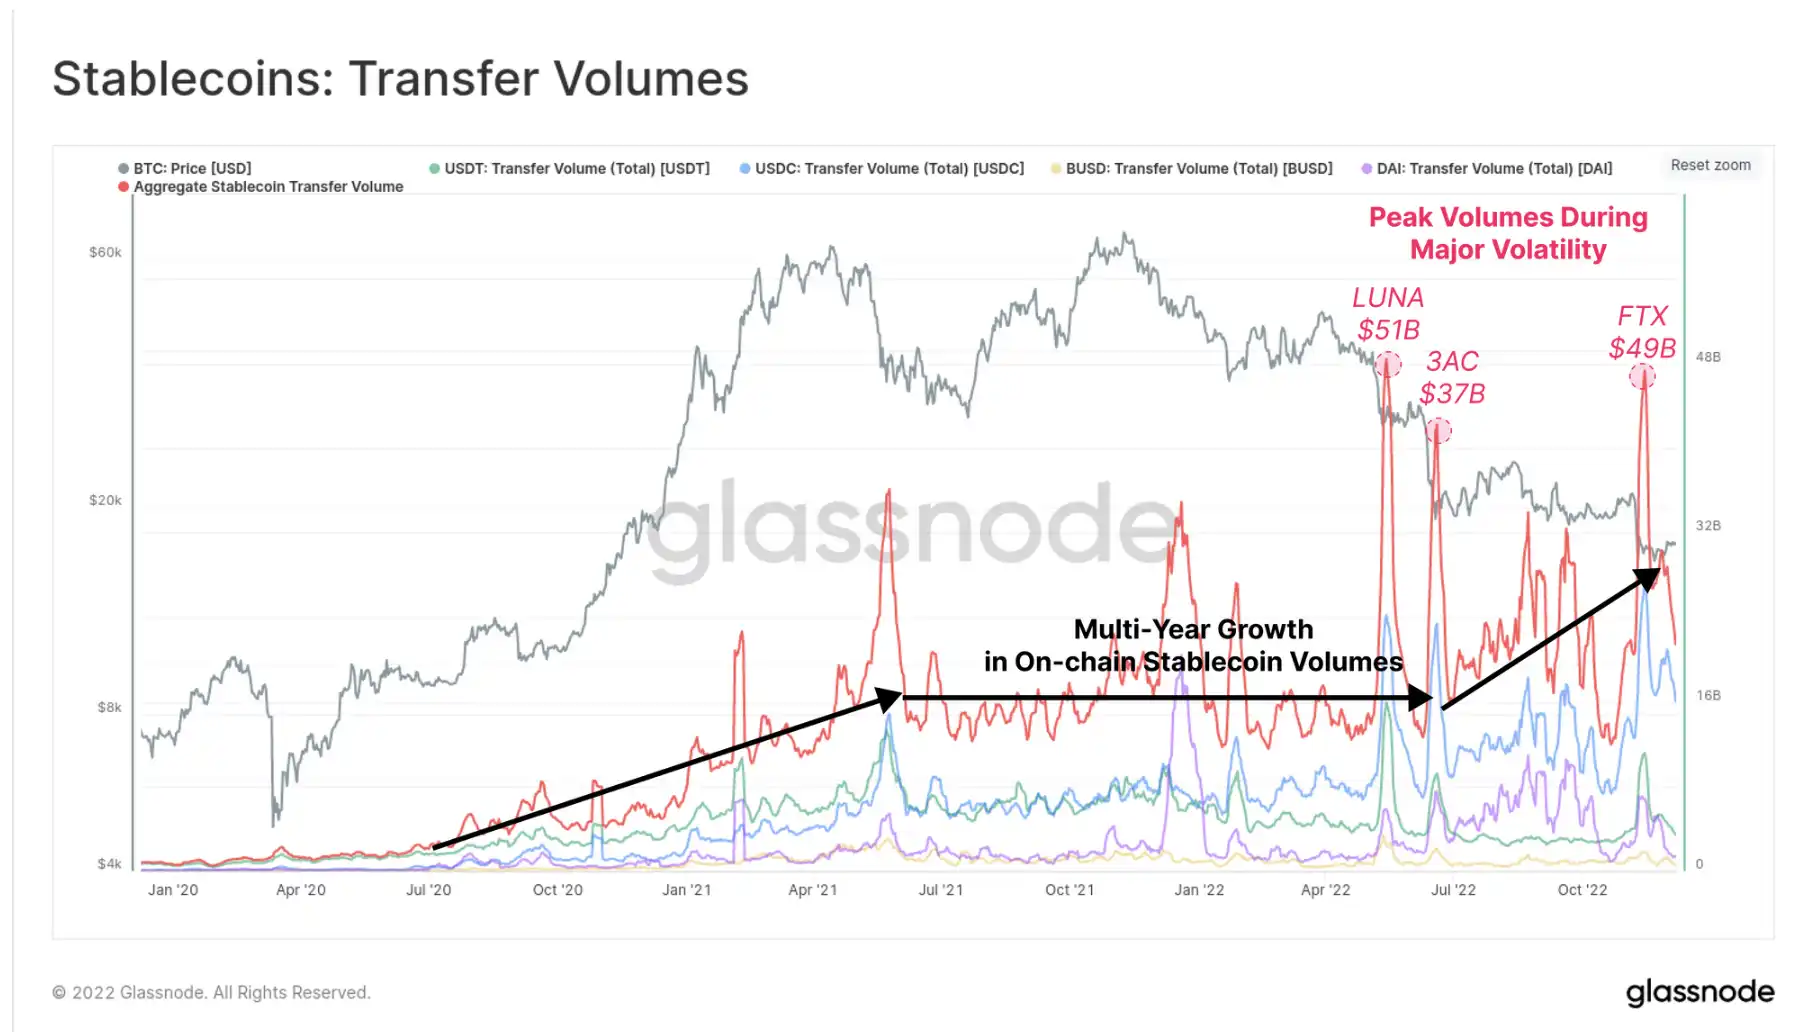
While Stablecoin is currently experiencing redemptions and net capital outflows, Stablecoin transfers in Ethereum continued to climb throughout the second half of 2022. While total stablecoin transfers held steady at around $16 billion a day for most of 2021-22, daily transfers have continued to climb to between $20 billion and $30 billion since July.
During the high-volatility selling events of May, June and November, total stablecoin transfers peaked between $37bn and $51bn, indicating extreme demand for dollar liquidity during deleveraging events.
Summary and Conclusion
BTC and ETH are both down more than 75% from their all-time highs this year. Since May, there have been frequent episodes of massive deleveraging, which has triggered a severe credit crunch, numerous corporate bankruptcies, the unfortunate collapse of the multi-billion dollar Ponzi project (LUNA-UST), and the regrettable FTX fraud.
2022 has been a brutal year, with volatility and trading volumes across markets falling to multi-year lows as liquidity and speculation dried up. As speculators have left, the supply of BTC for long-term bitcoin holders has pushed up to another ATH, and investors seem to be adding to their BTC holdings at every stage of price decline. The Ethereum merger was also successfully executed in September, and Stablecoin continues to demonstrate meaningful product market fit.
The resilience of decentralized systems is built through years of experimentation and battle scars, events that ultimately create the HODLer group, the buyer of last resort. Through all the challenges of 2022, the digital asset industry is still standing, it has learned its lessons, and Bitcoin blocks continue to be discovered.
Whatever happens in 2023, we are confident that the industry will stand the test of time and we will continue to build the tools and data needed to analyze, research, and understand why.
Tock tock tock, next block, we'll see you in 2023.
Link to original article
Welcome to join the official BlockBeats community:
Telegram Subscription Group: https://t.me/theblockbeats
Telegram Discussion Group: https://t.me/BlockBeats_App
Official Twitter Account: https://twitter.com/BlockBeatsAsia