Review Bitcoin 2022: Institutional holdings decreased by 4.54%, and the average daily value of 40% chips was in the red for the whole year
The Year of Bitcoin in 16 Charts: More than 140 million new addresses and an average profit chip ratio of 60.50%
Original article by Carol PANews
In 2022, influenced by the Federal Reserve's continuous eagling and the tightening of global liquidity, bitcoin ended the bull market which had been continuously rising for two years before and entered the bear market which was in shock and decline. In a reversal from gains to losses, bitcoin's price fell below the round $20,000 mark, and a series of thunderstorms on the head trading platform and the DeFi protocol further dented market confidence. Beyond these appearances, what profound changes have taken place in bitcoin in 2022?
At the end of the year, PAData, the data news column of PANews, comprehensively reviewed the data changes of Bitcoin this year in five aspects: transaction market, on-chain fundamentals, chips and address structure, mining, and application, in order to provide an analysis basis for the outlook of the coming year.
Summary of Contents
1. Trading markets
1) The change of the currency price of BTC shows two characteristics. First, the overall decline in the year is more than 65%; Second, the speed of decline is fast, forming a similar "step" pattern of decline.
2) The stock of trading platform BTC decreased by 533,700, or about 20.20%.
3) After mid-October, the estimated leverage ratio fell from a peak of 40.47% to 28.05%, and thereafter barely exceeded 30%.
4) Institutional BTC holdings declined modestly, with an overall decrease of 4.54%, OTC premium rate falling to -44%, and indirect investment demand continued to decrease.
2. On-chain fundamentals
1) Address changes on the Bitcoin chain have two features. First, the number of users on the Bitcoin chain this year has decreased significantly compared with last year. Second, the number of users on the Bitcoin chain has remained relatively stable in the case of market volatility in the year.
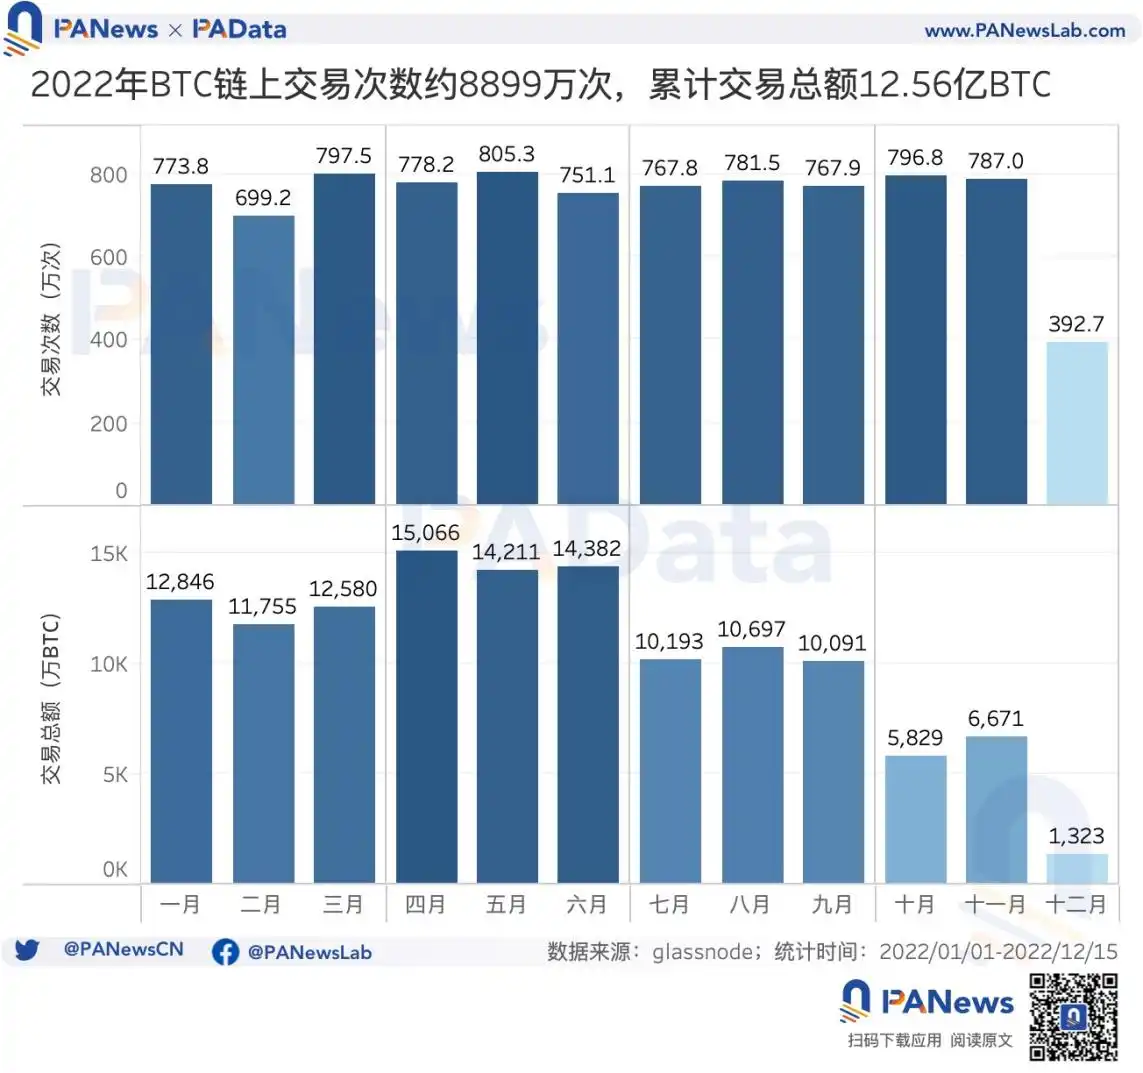
2) In 2022, the annual accumulative transaction number of bitcoin was 88.99 million, which decreased by 4.13% compared with last year, but the annual accumulative total transaction amount was about 1.256 billion BTC, which increased by 36.37% compared with last year.
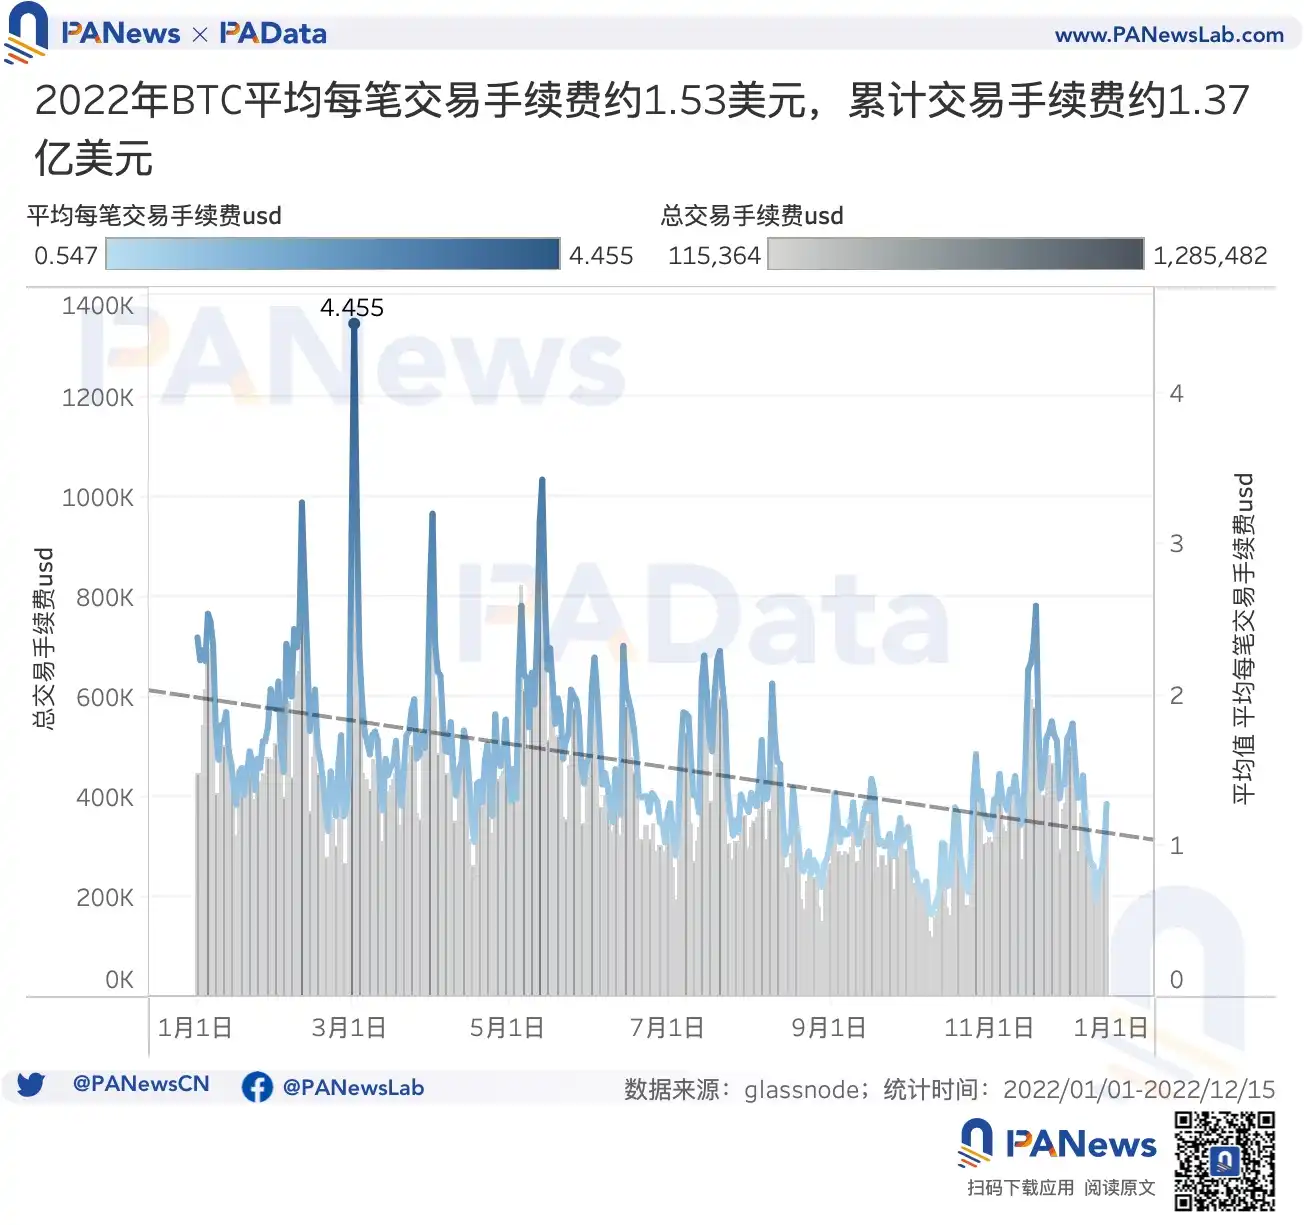
3) The cumulative on-chain transaction fee of Bitcoin is about $137 million, and the average daily on-chain transaction fee is about $1.53, showing a significant downward trend throughout the year.
3. Chips and address structure
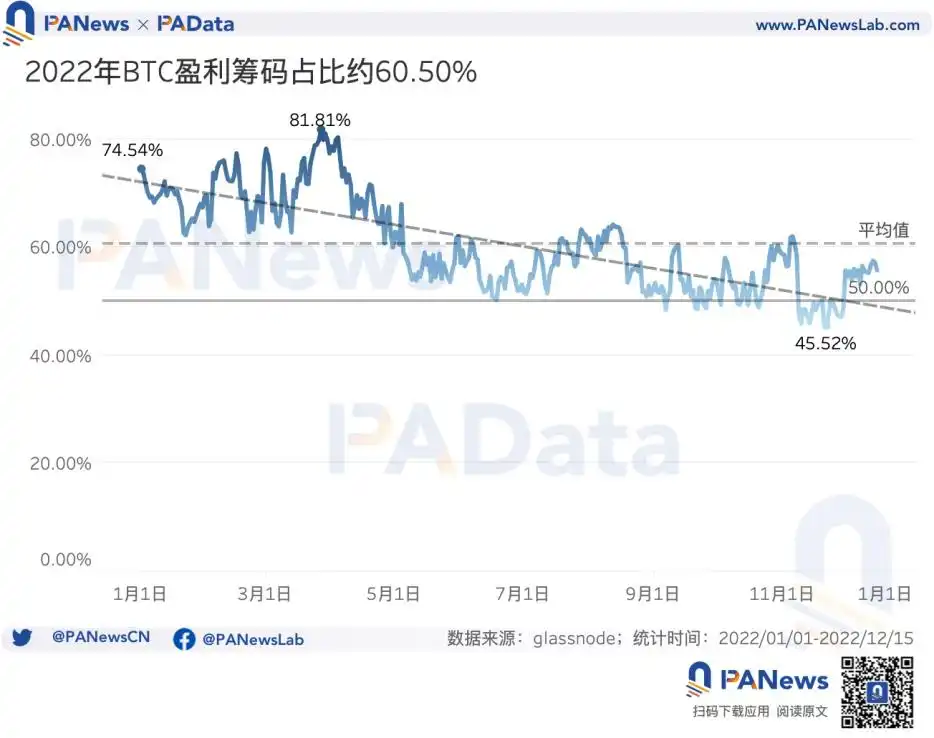
1) The average percentage of bitcoin profit chips is 60.50%, that is, 40% of chips are in the red every day throughout the year.
2) The degree of chip concentration of Bitcoin "whale" address experienced a process of "centralization-dispersion" during the year. The asset distribution of ordinary bitcoin users presents a trend of accelerated minimization and polarization of holding period.
4. Mining Industry
1) The average daily computing power of bitcoin is about 218.5 EH/s, with an annual growth rate of about 11.21%, a moderate rise.
2) The profit space of mining industry is further squeezed, and the decline of currency price limits the growth rate of mining industry scale. Bitcoin's daily mining revenue has fallen to $0.06 per terabytes, down 76 percent for the year.
5. Application
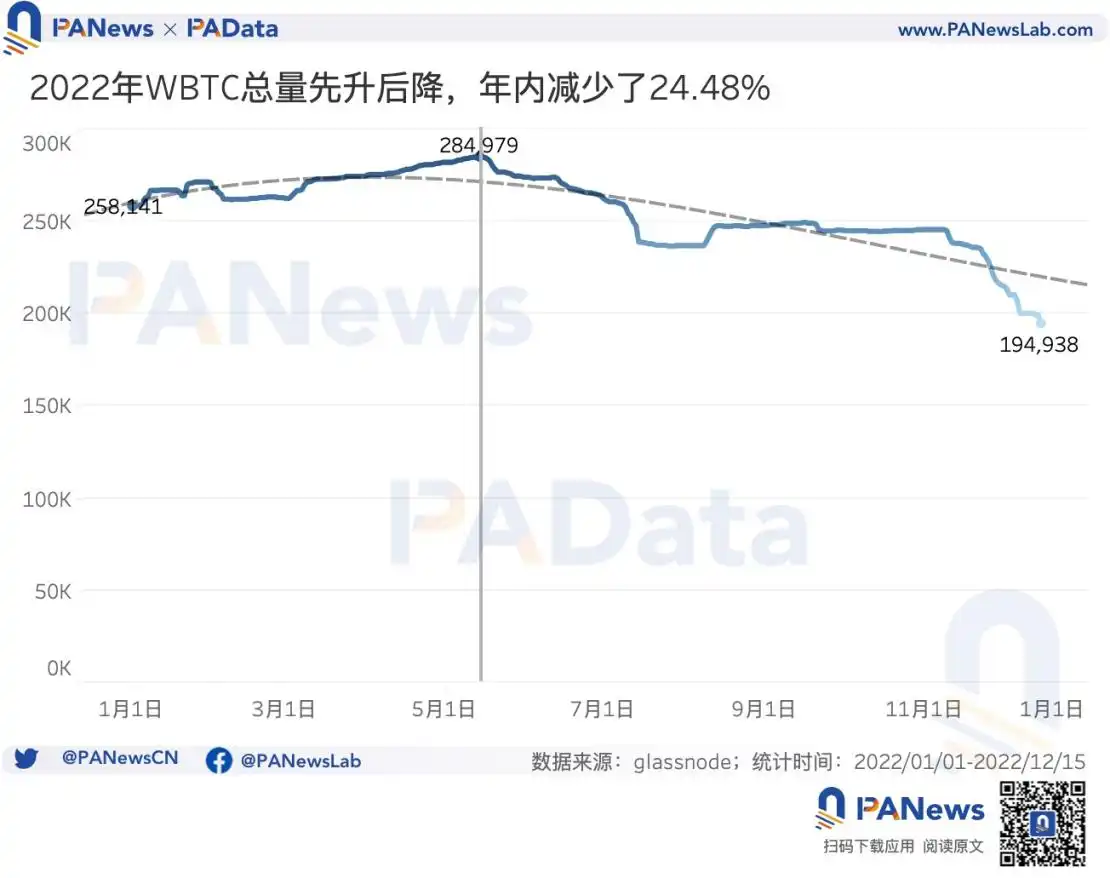
1) The number of Lightning network channels decreased by 18.53% and the amount of WBTC in circulation decreased by 24.48%, which means the connectivity of the uppoint network decreased and the connectivity between Bitcoin and other DeFi ecosystems decreased.
01, the currency price fell 65.09%, trading platform stock decreased 20.20%
In 2022, the change of the currency price of BTC showed two characteristics. First, the overall decline in the year was large. The price of BTC fell from about $47,700 at the beginning of the year to about $16,600 at the end of December 16, with a decline of about 65.09%. If a daily drop of more than 10 percent is defined as a sharp drop, BTC has experienced six sharp falls this year, including two in November alone.
Second, the speed of decline is fast, forming a similar "step" pattern of decline. Although BTC's daily maximum amplitude for the year was only about 4.43 per cent, almost every "plunge" was accompanied by a super-high intraday amplitude of more than 10 per cent. In other words, big declines in BTC are usually completed within the day, and then fall again after a brief period of stability.

In 2022, the stock of trading platform BTC decreased by 533,700, or 20.20 percent, from 2,642,300 to 2,108,600. Among them, with FTX event as the boundary, the stock of trading platform BTC was stable but decreased before; After that, trading platform BTC stock rapid decline. During the 11 days from November 6 to 17, the total decrease was about 240,000 BTC, a decrease of about 9.80%. And after the incident basically subsided, trading platform BTC stock still decreased significantly.
Changes in currency price and trading platform stock affect the trend of BTC market estimated leverage ratio. Generally speaking, the market estimated leverage ratio in the year continued to rise, and then fell rapidly. The highest leverage ratio in the year was 40.47% created on October 11, but on November 8, about one month later, Leverage fell back to 28.05%. Since then, the leverage ratio has not exceeded 30 per cent

In addition, in terms of indirect investments, the average daily BTC holdings of institutions such as trusts, ETFs and funds will be about 700,000 BTC in 2022. However, institutional holdings still declined modestly throughout the year, with an overall decrease of 32,900 BTC, or about 4.54%, and indirect investment demand continued to decrease. Moreover, influenced by the sharp decline in the currency price, the over-the-counter premium rate of institutional assets also continues to decline. The monthly average OTC premium rate fell from -20.74% in January all the way to -44.12% in December, with the premium rate falling as high as 112.73%.

02. The monthly average active address is 27.82 million, and the total transaction volume is 1.256 billion BTC
Behind the market volatility are changes in data along the Bitcoin chain. According to statistics, the average monthly active address of bitcoin in the first 11 months of 2022 is about 27.82 million, down 7.67% from last year's average monthly active address. The average daily active address for bitcoin in the first 11 months of 2022 is about 916,500, down 7.70% from last year.
Not only did the number of active bitcoin addresses decrease in 2022, but so did the number of new addresses. According to statistics, as of December 15, the cumulative number of new Bitcoin addresses reached 141 million, 9.50% less than the same period last year. In addition, the total increase in the first 11 months was 12.274 million, down 9.83% from the same period last year. The number of new addresses here includes the effect of the UTXO change mechanism.
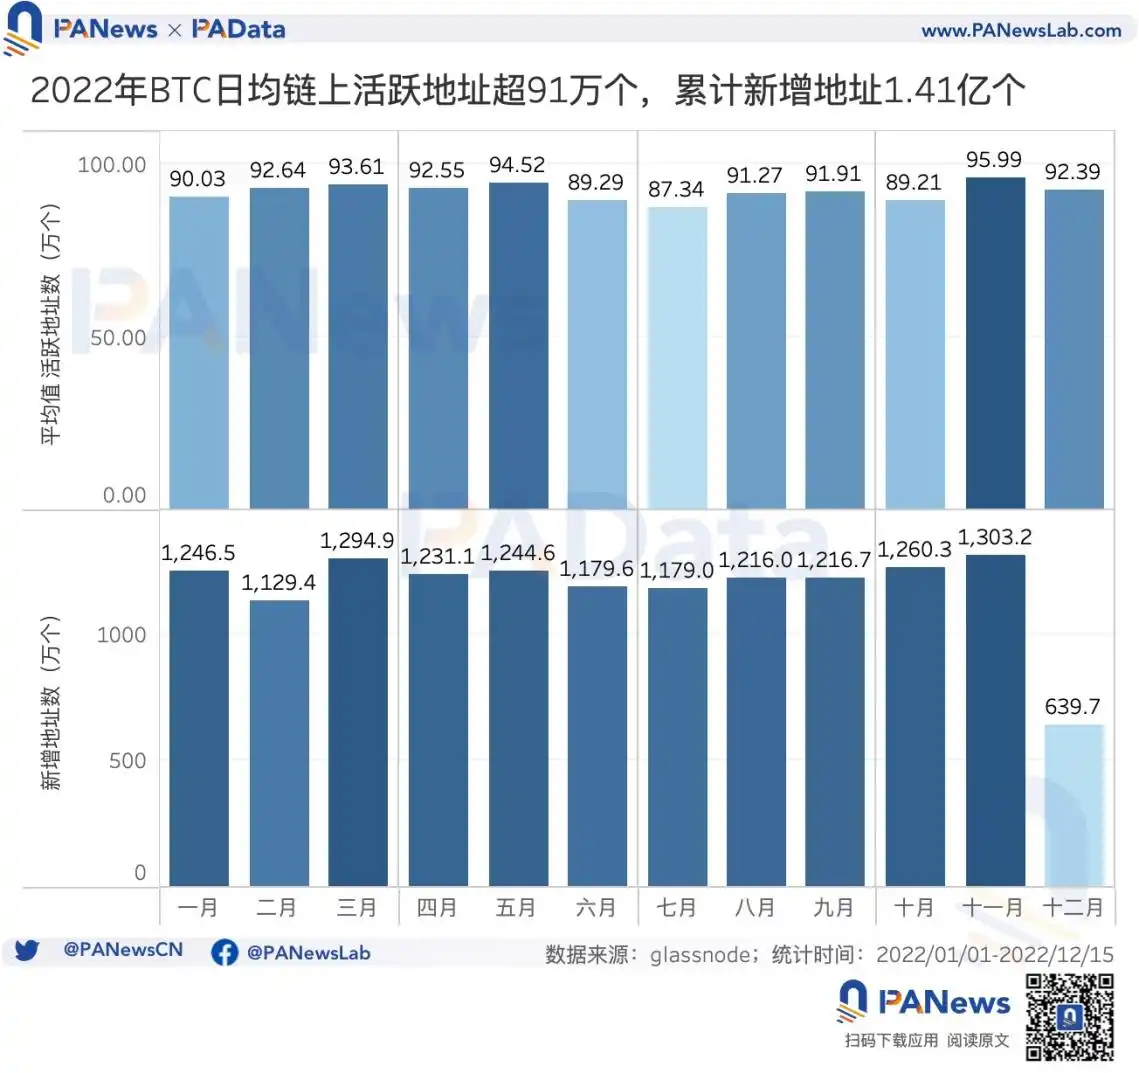
In general, there are two features of the address changes on the Bitcoin chain in 2022. First, the number of users on the Bitcoin chain this year has decreased significantly compared to last year. Second, the number of users on the Bitcoin chain has remained relatively stable in the case of market volatility in the year.
In addition to on-chain address changes, on-chain transactions are also an important component of on-chain fundamentals. According to statistics, as of December 15, the total number of bitcoin transactions in 2022 was 88.99 million, 4.13% lower than last year. In the first 11 months, the total number of transactions was 7.733 million, among which the number of transactions in May was the highest, exceeding 8.05 million.
However, while the number of transactions decreased, the total number of on-chain transactions increased significantly in 2022. As of December 15, the total cumulative transaction volume of Bitcoin in 2022 was about 1.256 billion BTC, a significant increase of 36.37% compared to last year. Looking at a smaller time period, we can see that the average monthly transaction volume in the first half was 135 million BTC, significantly higher than the 86.96 million BTC in the second half (excluding December). By the second half of the market fell sharply, the chain of capital activity also significantly reduced.
Lower on-chain activity also translates into lower transaction fees. Based on the daily closing price of bitcoin, the average daily Bitcoin transaction fee in 2022 will be about $1.53 per on-chain transaction, and has declined significantly throughout the year. The average daily on-chain transaction fee in the second half of the year was about $1.26, much lower than the average in the first half.
As of December 15, the cumulative on-chain transaction fee for 2022 Bitcoin was about $137 million, also showing a significant downward trend. In the first 11 months, the accumulated transaction fees were $12,040,600, with the highest accumulated transaction fees of $16,171,900 in May and the lowest accumulated transaction fees of $7,475,800 in October.
03. The proportion of average profit chips continued to decline, and the number of chips with 1-2 year holding cycle increased the most
In 2022, market volatility caused a change in chip structure. First of all, from the perspective of profit chips distribution, the average percentage of bitcoin profit chips in 2022 is 60.50%, that is, the average daily value of 40% chips in the whole year is in the state of loss. In addition, the share of profit chips decreased significantly throughout the year, from 74.54% at the beginning of the year to 55.77% at the end of the year, a decrease of more than 18 percentage points. Especially from November 8 to November 29, after the FTX event, the percentage of bitcoin profit chips was almost always below 50%, that is, more than half of the tokens were in the red at that time.
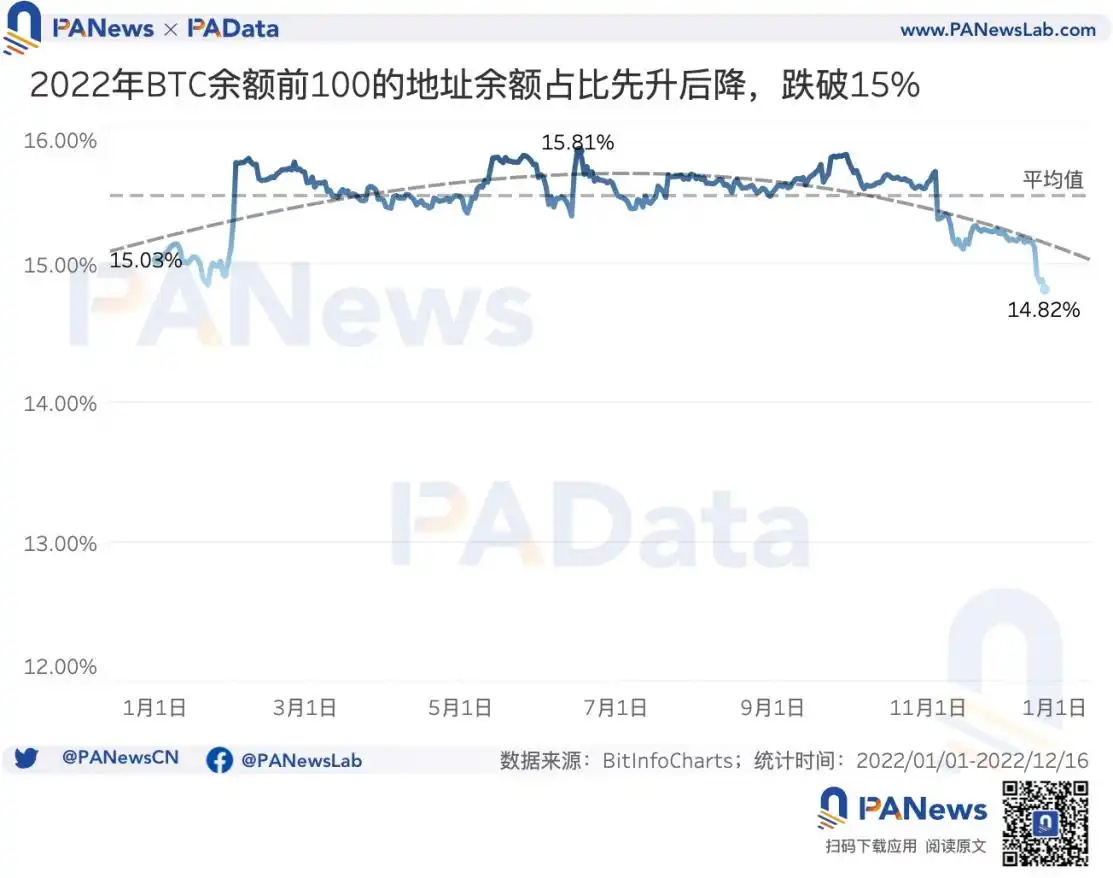
In addition, the degree of concentration of Bitcoin chips also experienced a process of first concentration and then dispersion during the year. According to statistics, the total balance of the top 100 addresses in circulation rose from 15.03% at the beginning of the year to 15.81% at the peak in mid-June, and then fell to 14.82% at the end of the year. While the biggest change during the year was just 1 percentage point, for Bitcoin, 1 percent of the total amount in circulation is about 190,000 BTCS, which is still noteworthy in terms of sheer numbers.
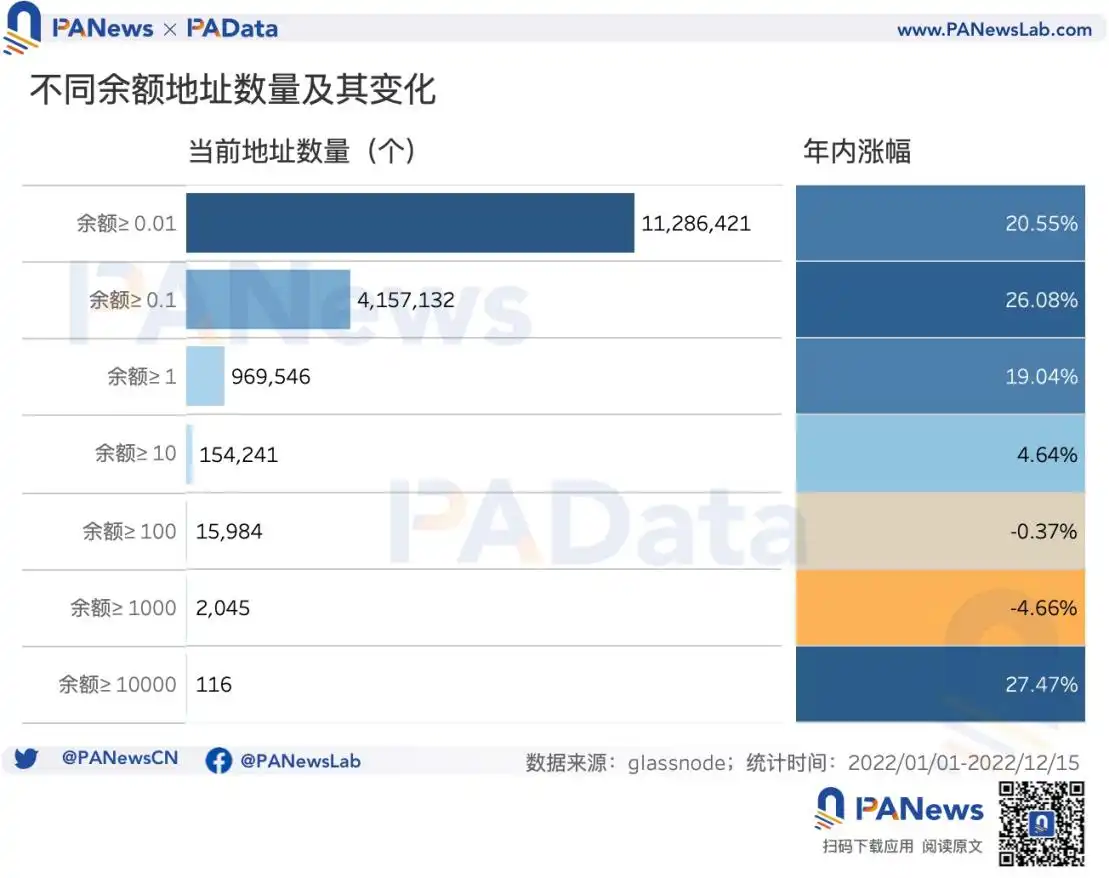
In 2022, the asset movement of bitcoin holding addresses continues two of the characteristics of last year. First, from a balance perspective, small addresses continue to grow significantly this year, but what is new compared to last year is that the range of balances achieving growth in the number of addresses has expanded from less than 1 BTC to less than 10 BTC, and the growth of small addresses has increased significantly.
Among them, the number of addresses with balances greater than 0.01 BTC increased by 20.55 percent during the year, up from nearly 10 percentage points last year. The number of addresses with balances greater than 0.1BTC increased by 26.08% during the year, up from nearly 20 percentage points last year. The number of addresses with a balance of more than 1 BTC increased by 19.04% during the year, the number of addresses with a balance of more than 10 BTC increased by 4.64% during the year, and the number of addresses with a balance of more than 10,000 also increased by 27.47%. All three types of addresses showed negative growth last year.
Secondly, from the perspective of holding cycle, this year, the chips of different holding cycles continue to differentiate, and the leading holding cycle is 1 to 2 years. As of December 15, there were 3,918,600 BTC holding period of 1 to 2 years, accounting for 20.37%.
But compared with last year, the new change is that, first, the largest increase in the holding period from 6 months to 1 year to 1 year to 2 years. According to statistics, the proportion of chips with a holding period of 1 to 2 years increased by more than 8 percentage points during the year, which is basically the same as the change in the proportion of chips with a holding period of 6 months to 1 year. It is reasonable to speculate that most chips with a holding period of 6 months to 1 year were continued and shifted to a holding period of 1 to 2 years.
Second, short-term and ultra-long-term holding addresses increased, among which, the number of chips with a holding period of less than 24 hours increased by 0.5 percentage points in this year, and the number of chips with a holding period of 1 week to 1 month increased by 1.24 percentage points in this year. In addition, the number of chips with a holding period of five to seven years or more than 10 years also increased during the year.
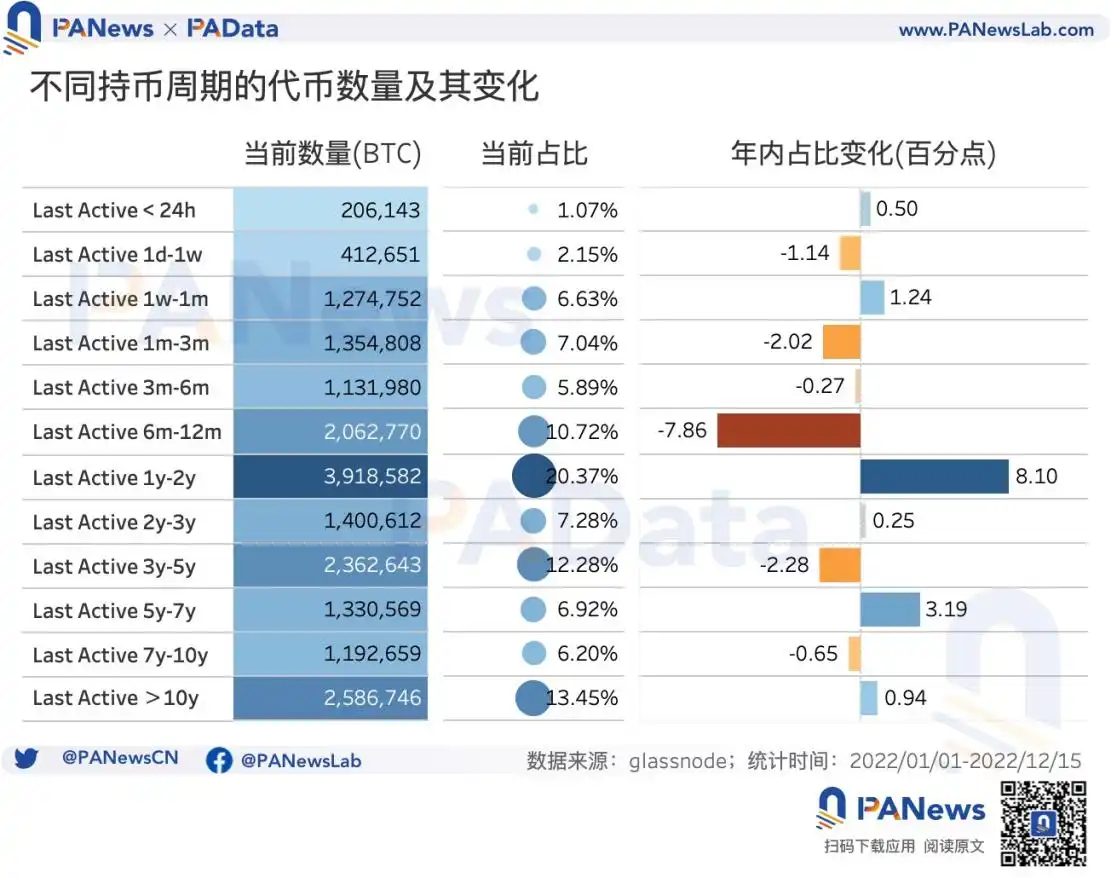
Taken together, such changes in the number of addresses and chips indicate that the asset distribution of ordinary bitcoin users this year presents a trend of accelerated minimization and polarization of the length of the holding period.
04. The annual computing power continued to increase, and the daily mining income per unit computing power decreased by over 77%
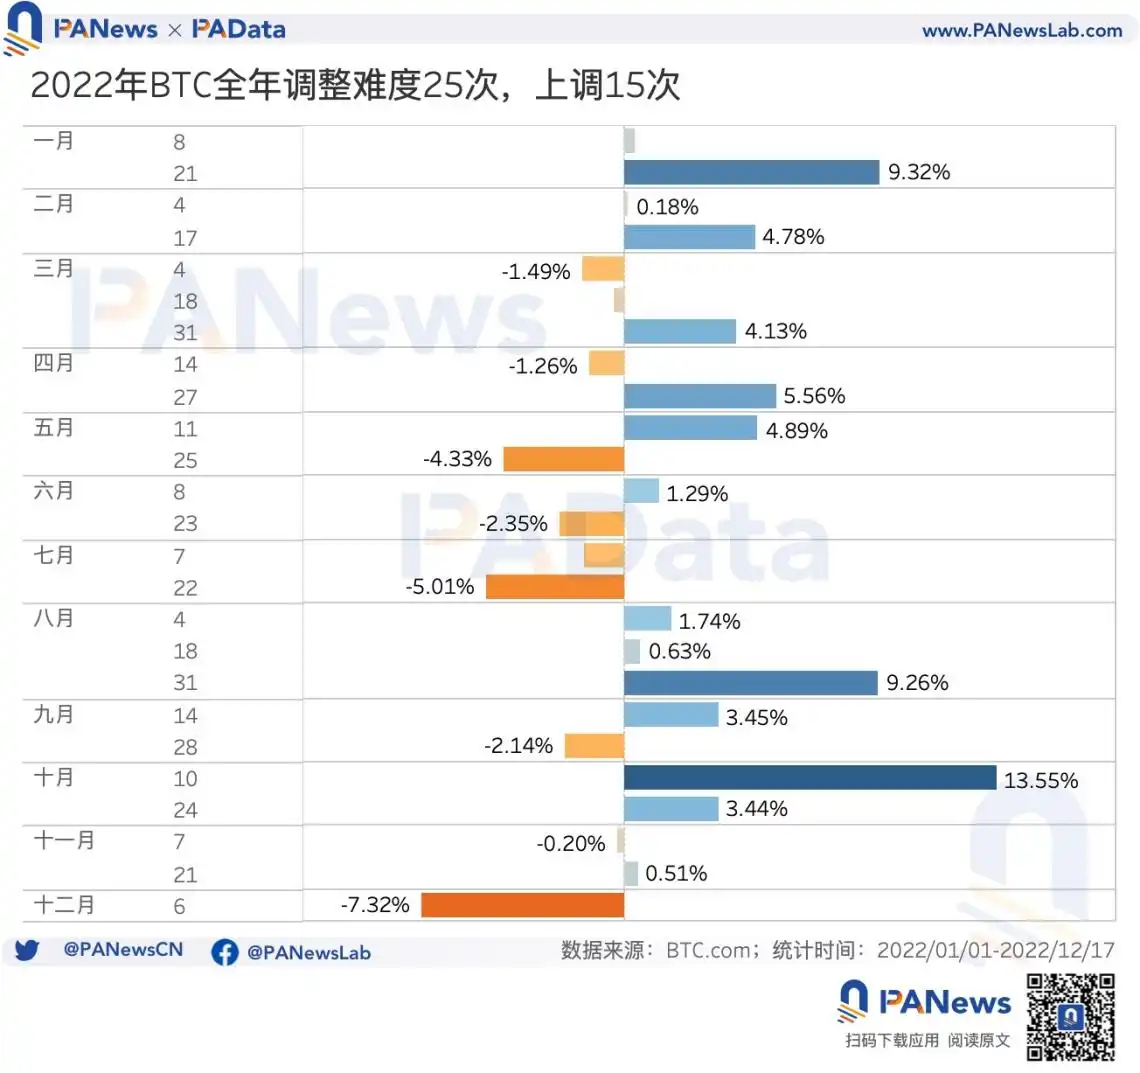
As of December 17, the annual BTC mining difficulty has been adjusted 25 times, of which 15 times have been raised and 10 times have been lowered. In general, the increase rate was higher than the decrease rate, with the biggest increase of 13.55 percent on October 10, and the biggest increase of more than 9 percent on January 21 and August 31. On the other hand, December 6 saw the biggest drop of 7.32 percent, followed by May 25 and July 22.
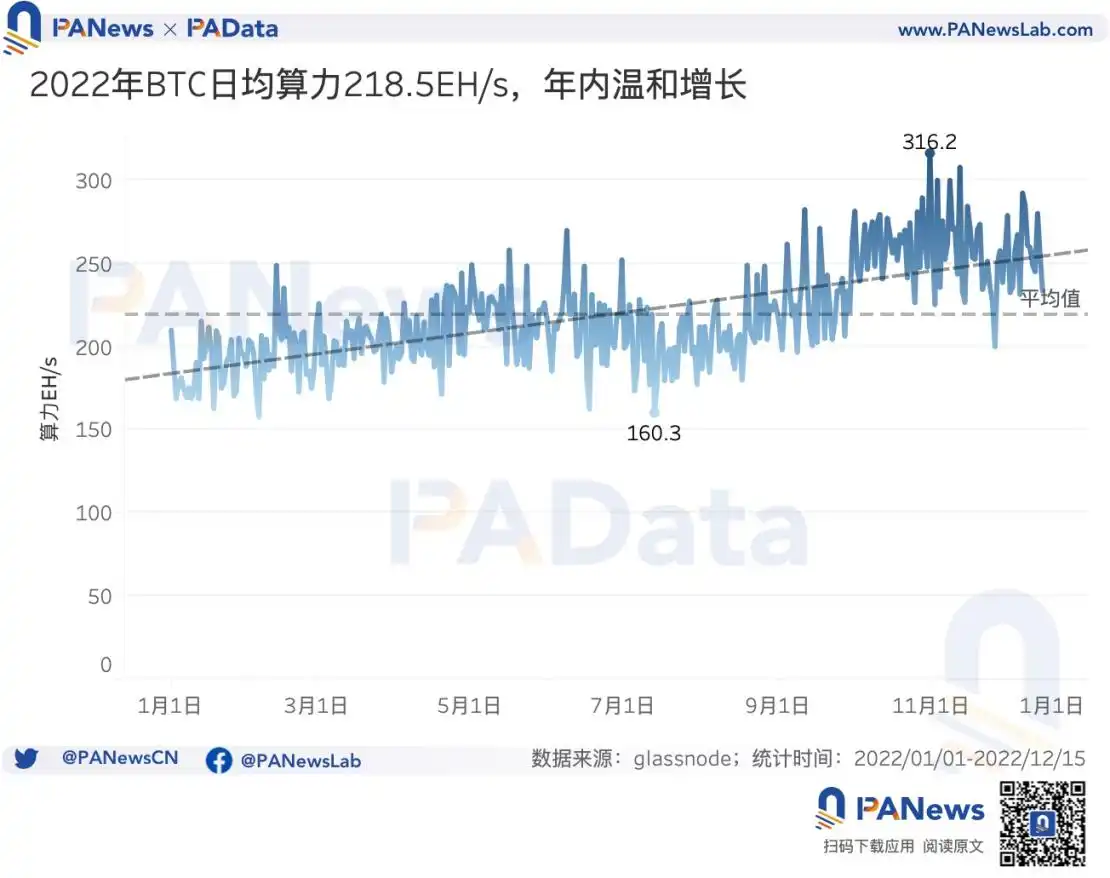
In terms of computing power, the average daily computing power of bitcoin in 2022 is about 218.5 EH/s, with an annual growth rate of about 11.21%, showing a moderate upward trend. During the year, the highest calculation power was about 316.2 EH/s and the lowest calculation power was about 160.3 EH/s. According to DIGICONOMIST, the estimated electricity consumption for bitcoin mining for the full year ending December 18 is about 113.83 TW/h, which is similar to the Netherlands.
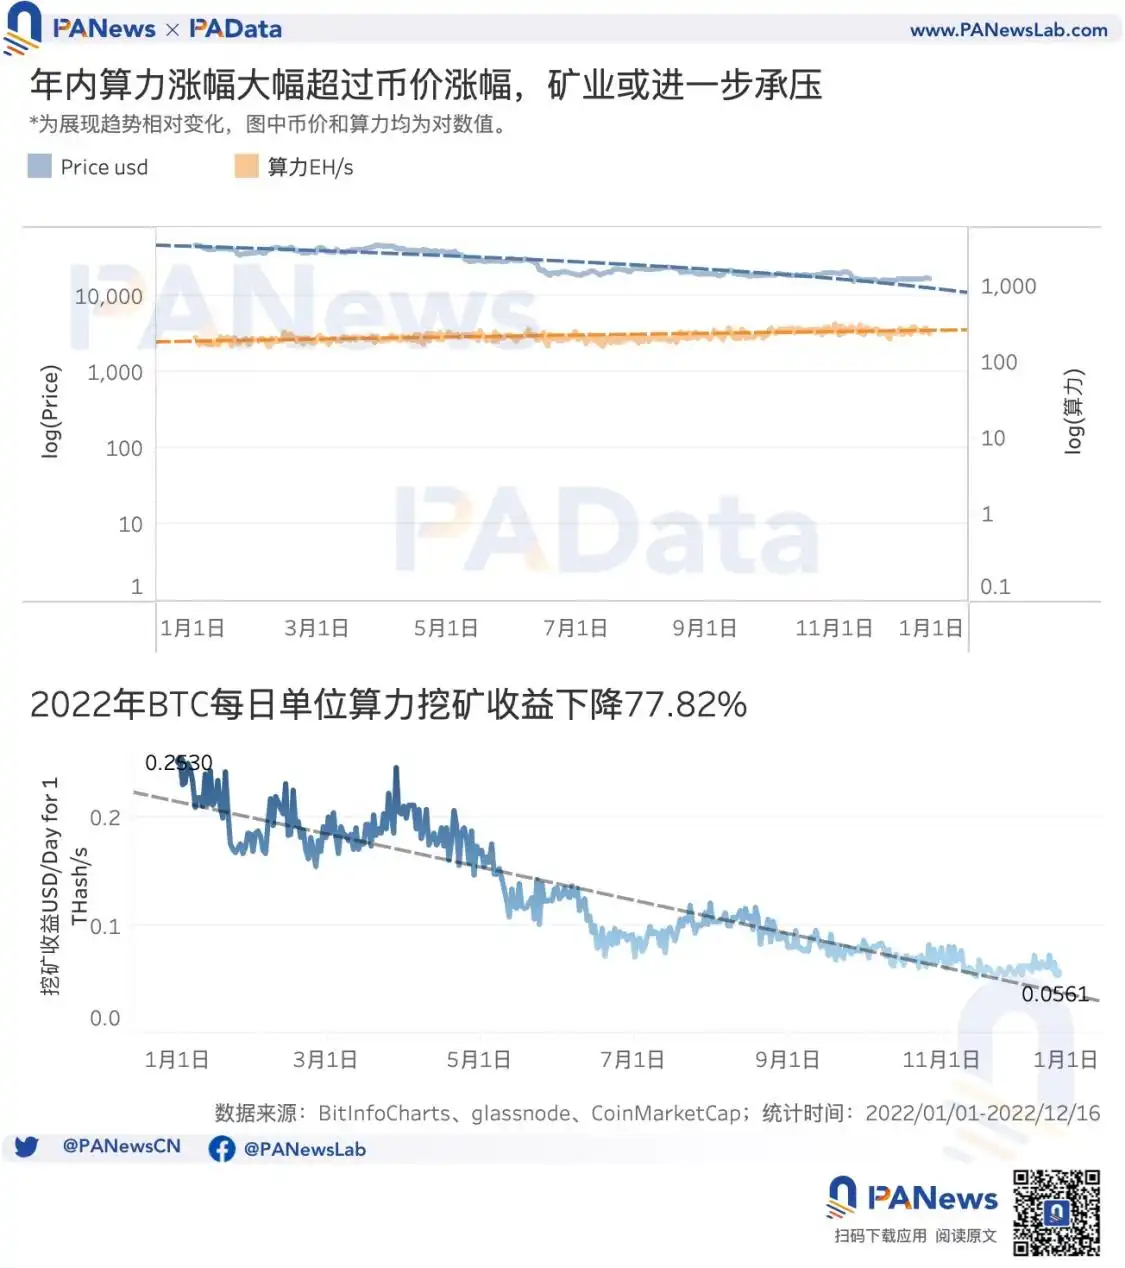
From the perspective of the relative change of calculation power and coin price, they changed in opposite directions during the year, that is, the continuous decline of coin price and the continuous increase of coin power occurred simultaneously, but the decline of coin price was greater than the increase of coin power. This means that the profit space of mining industry is further squeezed, and the falling currency price limits the growth of mining scale. According to statistics, the daily revenue from mining bitcoin per T-force dropped from $0.25 at the beginning of the year to $0.06 at the end of the year, a drop of 76%. Especially since September, Bitcoin has been earning less than $0.10 per terabyte per day.
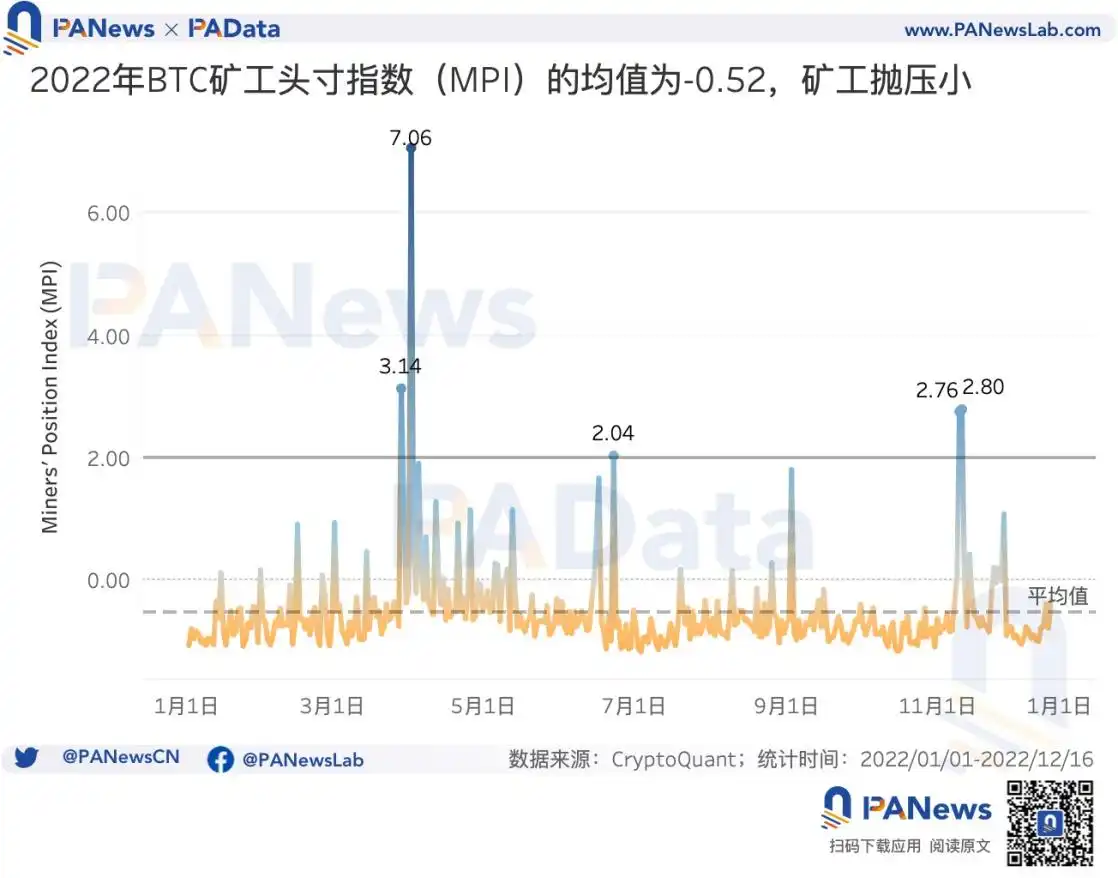
Still, despite the market downturn, there isn't much selling pressure on miners in 2022. A higher miner position index (MPI) indicates that miners are trading (selling) more bitcoin than usual, meaning more selling pressure. Typically, an MPI greater than 2 indicates that most miners are selling bitcoin; An MPI of less than 0 indicates less selling pressure on miners. According to statistics, the annual average MPI of bitcoin is -0.52, less than 0, with less selling pressure. But there were four periods of heavy selling pressure throughout the year: late March, early April, mid-June and mid-November.
05. The number of lightning network channels decreased by over 18%, and the supply of WBTC decreased by over 24%
At present, the application of Bitcoin network is mainly reflected in two aspects, one is the lightning network that supports efficient peer-to-peer transactions, and the other is WBTC, which serves as a medium connecting with Ethereum ecology. However, the application of these two aspects has been blocked in 2022.
According to Lightning Network data, the number of channels in the Lightning network dropped from 83,000 to 67,700 in 2022, an overall decline of about 18.53 percent. Until mid-October, the number of channels had remained basically stable, but since then, the number of channels has decreased rapidly and dramatically. The decline in the number of channels means that the connectivity of the entire network decreases.
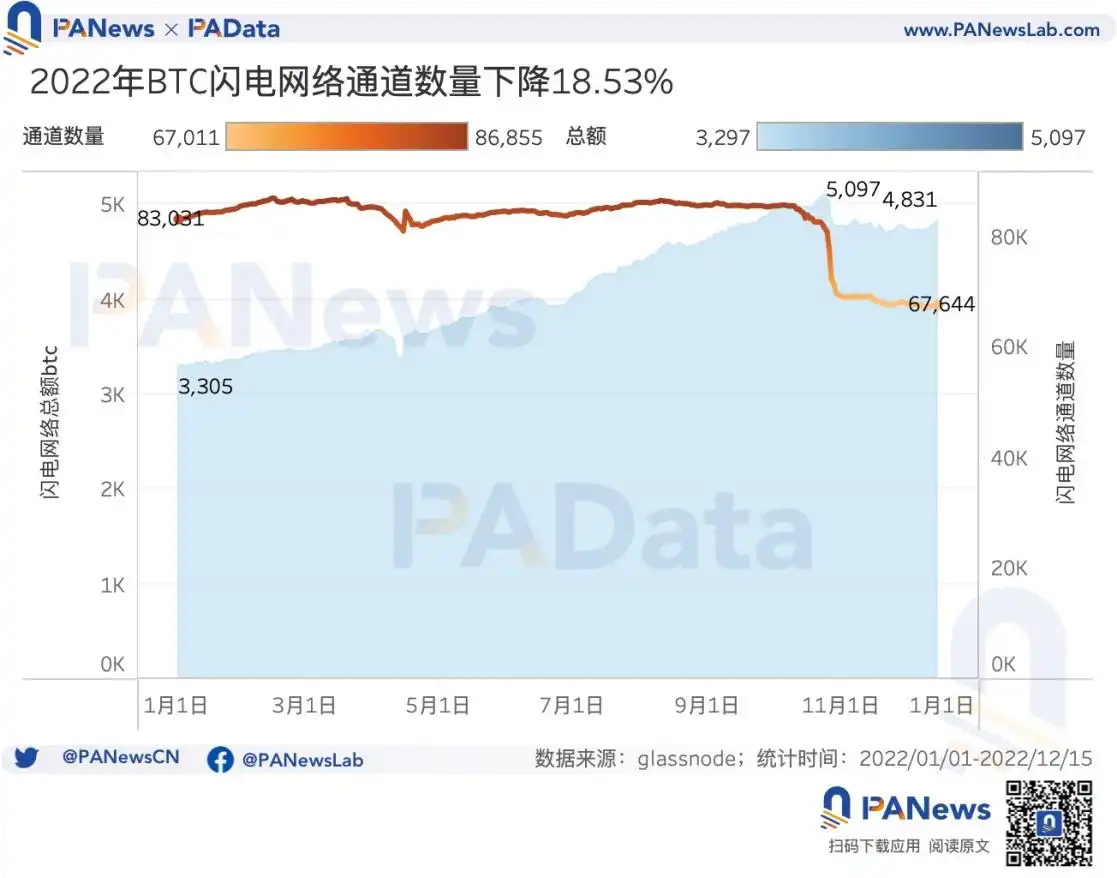
In addition, the lightning network capital capacity in the year, there was a change in the first up and then down. In October 25 as the boundary, before the lightning network fund capacity rose from 3305 BTC to 5097 BTC, up about 54.22%. However, since then, the capital capacity of Lightning network has fallen rapidly, falling to 4845 BTC within 3 days, a decline of about 4.94%, and then basically stable at about 4760 BTC. The overall increase of the annual fund capacity was about 46.19%
However, on the whole, the development of lightning network in 2022 is still relatively stable, especially the scale of capital and significant growth. In the future, Lightning network, as a two-layer network, still has a lot of room for ecological development.
According to the data of WBTC, the total amount of WBTC in 2022 will also increase first and then decrease. Before mid-May, the total number of WBTCS increased from 258,100 to 28500, and then fell all the way to 194,900 at the end of the year, a decline of about 24.48 percent for the whole year. Due to the FTX incident, the WBTC/BTC exchange ratio fell slightly below 1 in late November, showing decoupling phenomenon. However, WBTC is essentially a cross-chain BTC anchor coin, which is controlled by multiple tokens and is relatively secure. The decline in the number of WBTCS means less connectivity between Bitcoin and other DeFi ecosystems.
Original link
Welcome to join the official BlockBeats community:
Telegram Subscription Group: https://t.me/theblockbeats
Telegram Discussion Group: https://t.me/BlockBeats_App
Official Twitter Account: https://twitter.com/BlockBeatsAsia
 Related Articles