Global Blockchain Industry Panorama and Trends (Part 1)

Original title: "Global Blockchain Industry Panorama and Trends"
Original source: Huobi Research
In 2022, the Federal Reserve continued to raise interest rates, global liquidity tightened, and the crypto industry entered a deep bear market. This year, the total market value of Crypto assets has shrunk by more than 2.2 trillion US dollars, and the business scale of CEFI institutions has dropped by about 71.4%. The industry has been hit hard after the collapse of Terra, 3AC and FTX bankruptcy incidents, including large institutions such as BlockFi and Genesis, which have encountered bankruptcy or liquidation crises. However, the construction of the industry has not stopped: the total investment and financing in the primary market exceeded 27.7 billion US dollars; Ethereum ushered in a new era of PoS, and Layer2 developed rapidly; X2E awakened GameFi's new business model, etc. This report will comprehensively analyze the gains and losses of 2022 from seven areas, including market conditions, data, investment, region, application, technology, and regulation, and provide predictions and suggestions for the development of the industry in 2023.
1. The crypto industry under the global economic situation
1.1 Global macro: inflation, interest rate hikes and declines
If you want to sort out a thread for the global macro market in 2022, you must not avoid the main line of global inflation and the subsequent monetary tightening. They are like the keynote of the macro market, affecting all aspects of the global economy. This of course includes the cryptocurrency market. Not only that, because the current macroeconomic situation we are facing is rare in recent decades, among the factors affecting the cryptocurrency market this year, macro factors have surpassed industry internal factors such as regulation, new technologies, and new tracks and occupied a major position. Below we will sort out the global macro market situation since the beginning of this year based on the two key points of global inflation and monetary tightening.
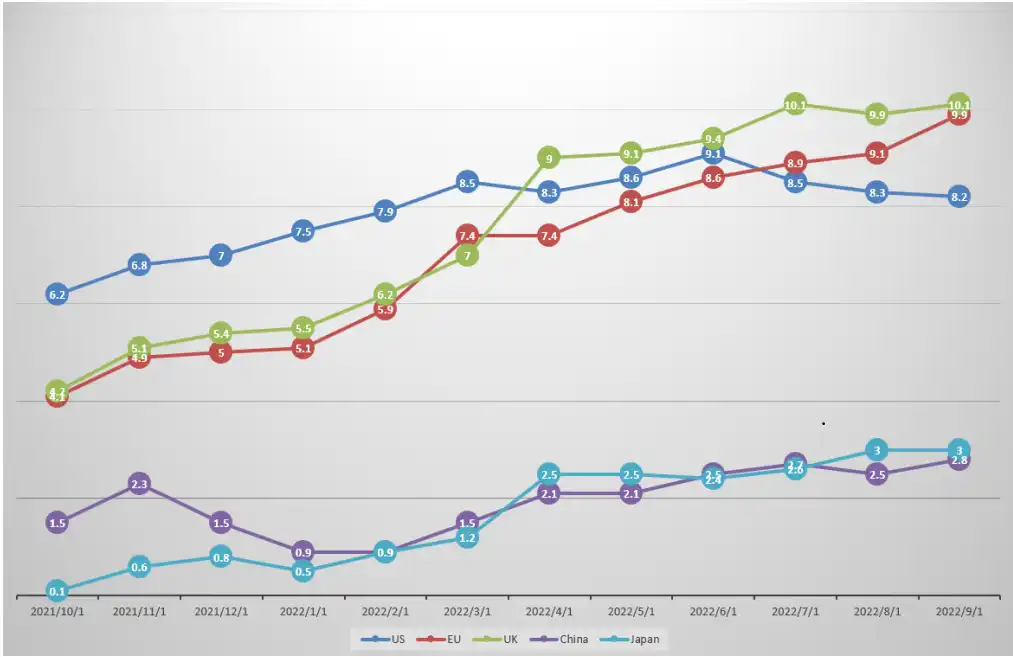
Source: Bloomberg, data from 10/1/2021 to 9/30/2022
The above figure shows the year-on-year CPI data of the major economies of the United States, the Eurozone, China, Japan and the United Kingdom from October 2021 to September 2022. It can be seen that inflation in several major economies has risen in the past year, and except for China, the current inflation rates of other countries are at the highest level in the past decade. Faced with this situation, central banks in various high-inflation countries around the world have generally adopted methods such as tightening monetary policy by raising interest rates and exiting QE, hoping to suppress the demand side and thus reduce inflation.
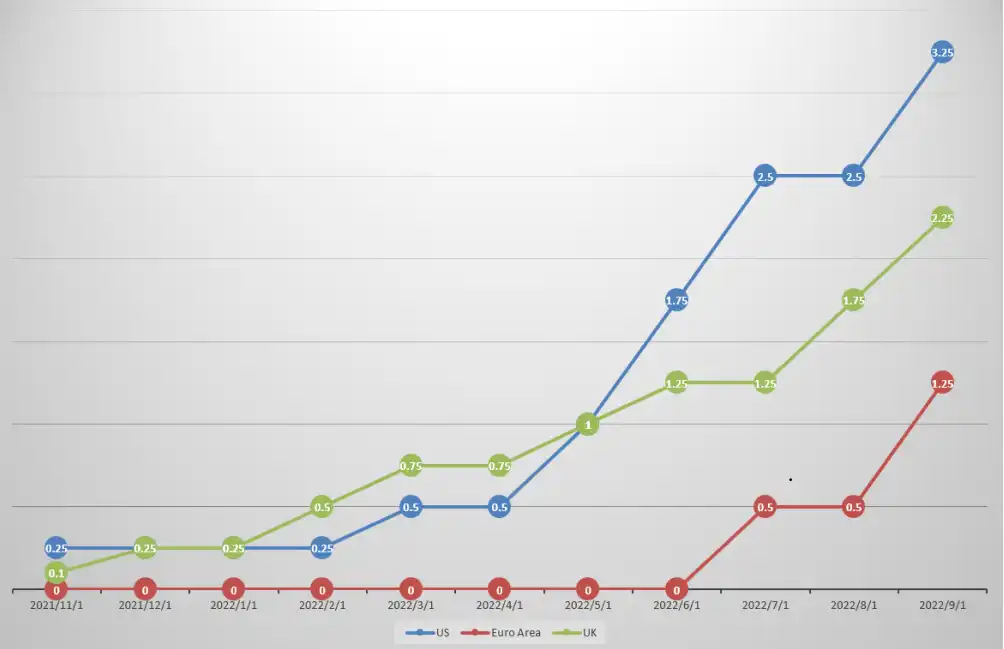
Figure 1-2: Benchmark interest rate of US, Euro Area and UK
Source: Bloomberg, Data from 10/30/2021 to 9/30/2022
The above figure shows the trend of benchmark interest rates in the United States, Euro Area and the United Kingdom from the end of 2021 to the present. It can be seen that the current round of global interest rate hikes is characterized by strong force and fast pace. Taking the United States as an example, the Federal Reserve raised the federal benchmark interest rate to 2.5% in 8 months, while it took the Federal Reserve nearly 2 years to raise the interest rate to this level in the previous round of interest rate hikes. The rapid and fierce interest rate hikes have undoubtedly brought tremendous pressure on the prices of global risk assets, and cryptocurrencies are not immune.
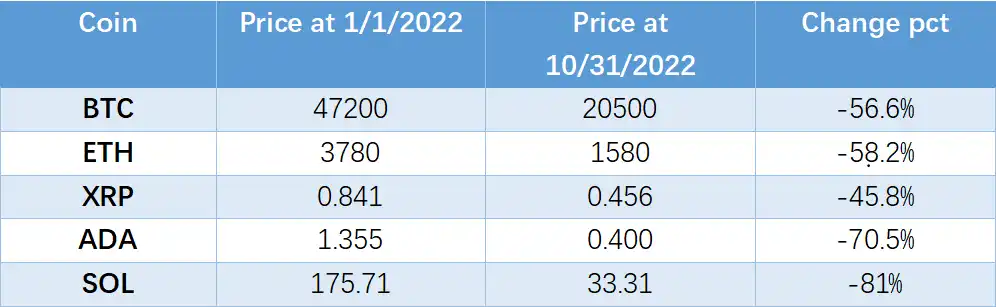
Table 1-1: The rise and fall of the top 5 currencies by market value in 2022
Source: Tradingview, Huobi Research
The above table shows the rise and fall of several major currencies ranked at the top of the market value this year. It can be seen that with the tightening of monetary policy, all currencies, regardless of the track, have suffered a sharp decline. Although historical events such as the collapse of terra and the merger of Ethereum have occurred in the industry this year, these events are either one of the consequences of the deterioration of the macro environment or have not changed the overall downward trend of the industry. Therefore, it can be said that the keywords of this year's macro market environment are inflation, interest rate hikes and declines.
1.2 Crypto: The year when the tide receded
2022 is a year of long-term decline in the cryptocurrency market. The panic in the external financial environment, coupled with the chain of internal events, directly led to a shrinkage of the overall market value of 2 trillion US dollars.
Market: From bull to bear, and into a deep bear

Table 1-2: Decline of major trend sectors
Source: coinmarketcap, Huobi Research
It can be seen here that during the bear market, BTC and ETH still play an important role. While maintaining a high market capitalization share, the decline is relatively small. Although the total market capitalization of the DeFi sector and the Gamefi sector has fallen by 80%-90%, the decline of most individual assets is larger. Because the total market capitalization has been replenished with new assets, the number of assets has increased, which has also filled the decline of assets. The decline of the market has quickly cooled down the assets that were popular during the bull market, and most of them have fallen by 90% or even higher.
200-week SMA indicator
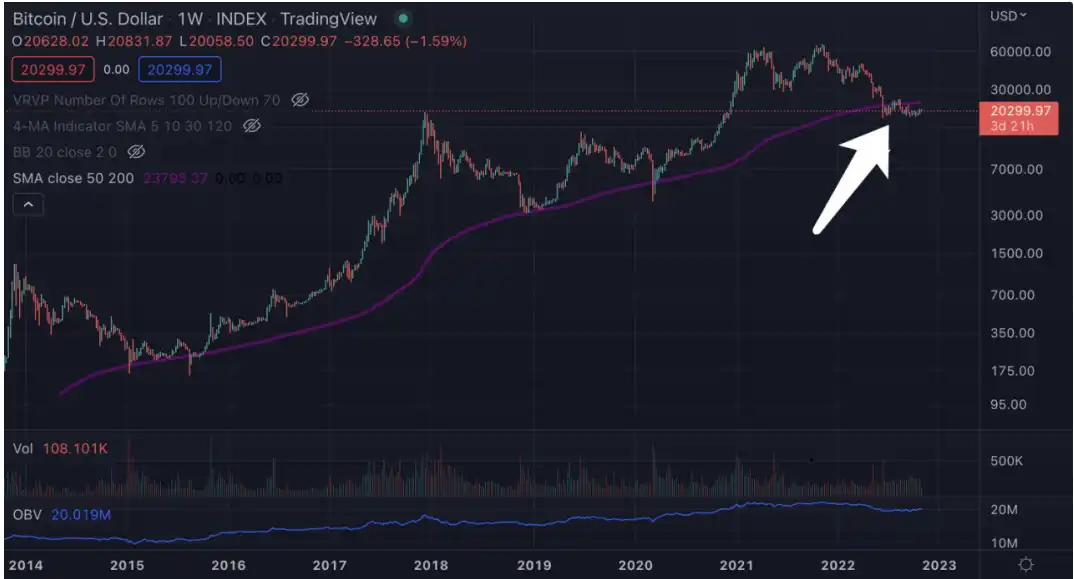
Figure 1-3: BTC price under the 200-week SMA indicator
Source: Tradingview
Because BTC did not complete the 200-week indicator prerequisite before 2014, the indicator started in mid-2014. From the historical data, the two times of breaking the indicator in 2015, the touching indicator in 2019, and the breaking indicator on March 12, 2020 were mostly just short touches or adjustments before rebounding. However, at present, the price of BTC has been fluctuating in the lower part of the indicator for a long time since it broke the indicator in June this year and fell back after the breakthrough in August. According to the indicators, BTC fell below and fluctuated below for the first time in history, and the current market is an unprecedented deep bear market.
Application: Development and innovation in the downturn
According to DeFillama data, DeFi Total TVL has dropped from 171 billion USD in January 2022 to a low of 50 billion USD in October 2022. At the end of October, it is about 55 billion USD. With a series of thunderstorms such as Terra, DeFi's TVL has also experienced two cliff-like declines, and the market has confirmed and accelerated into the bear market stage.
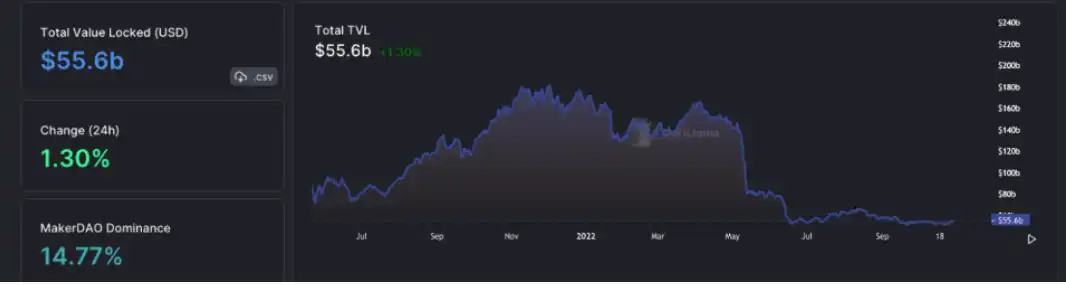
Figure 1-4: Total locked value on the chain
Source: DeFiLlama
The data in the figure below shows the value of outstanding debt in the lending agreement. The current data is about 4 billion USD. Compared with the highest point of 25 billion USD last year, it has dropped by 84%. The decline in the demand for leverage among users on the chain has led to a decrease in on-chain trading activities, which is also a clear feature of this bear market.
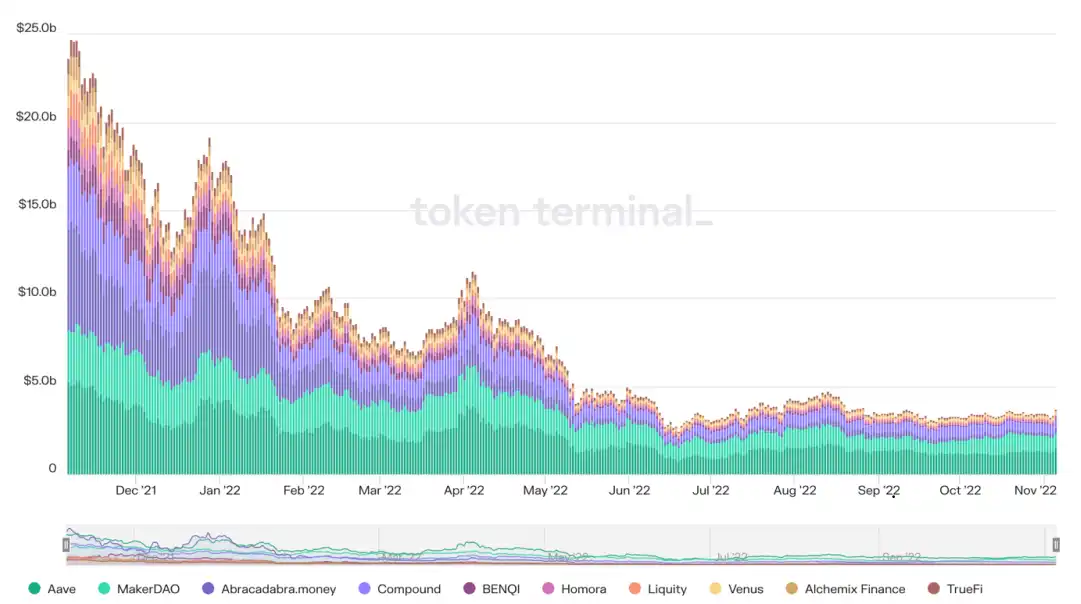
Figure 1-5: Total lending on the chain
Source: token terminal
At present, the ETH chain is still the main battlefield of DeFi. With the opening of the bull market in the second half of 2020, the explosive growth of the protocol, the rise of the currency price and the yield at the same time, attracted a large amount of capital injection. Liquidity also increased. However, as the market fell in 2022, the currency price and yield also fell at the same time. Liquidity was extracted, and a large amount of capital outflow accelerated the decline in sentiment. At present, the stablecoin deposit interest rate of mainstream lending protocols is even lower than that of US Treasury bonds. In the near future, many protocols have been attacked by hackers, and there have been thunderstorms such as Terra on the chain, which has caused risk-averse funds to be withdrawn.
Under this market situation, the market has further promoted the development of Layer2 public chains, and the DeFi ecosystem can develop again on Layer2. The expansion plan is faster and cheaper, which means lower costs for ordinary users and can attract small capital users to participate in DeFi. This is also a good time for the development of Layer2.
By observing the TVL data on the Layer2 chain, we found that in April 2022, the TVL on the Layer2 chain reached a peak of 7.5 billion USD, and then went down all the way to 3.7 billion USD in July. Unlike other ecosystems, the Layer2 ecosystem has been rising since it hit the bottom in July, and now it is about 5.32 billion USD. This is thanks to the gradual maturity of Layer2 technology, the issuance of coins, and the landing of a large number of applications, and most Layer2 chain development teams are also actively launching incentives, such as pre-airdrop reward activities and coin issuance. With the development and progress of Layer2 expansion solutions, more gameplay and ecological projects will inevitably be derived on the chain in the future.
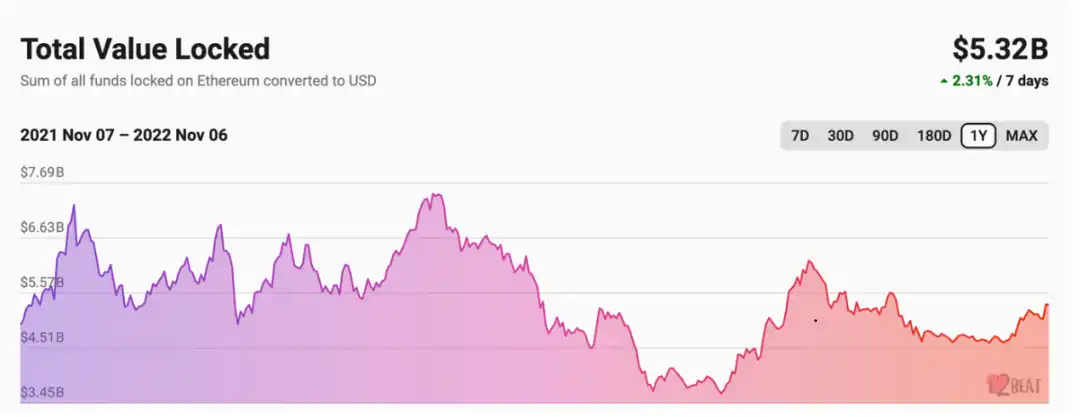
Figure 1-6: TVL data on Layer2 chain
Source: L2BEAT
As the market heat fades, NFT trading volume also shows a sluggish attitude. The ultra-high volume of pull-ups in May was due to the fomo sentiment generated by the otherdeed for otherside (also known as monkey land) issued at that time. At the same time, the total market value of NFTs fell by about half. The pricing method of NFTs is mainly based on the currency standard, and ETH fluctuates greatly, so the total market value of NFTs is inevitably falling. The market value of NFTs fell from about 35 billion USD to 21 billion USD, a drop of about 40%. The decline in the total market value of NFT is not as large as that of ETH because NFT has continued to release new assets and has been supplying NFTs to the market, which also attracts non-NFT users to join NFT.
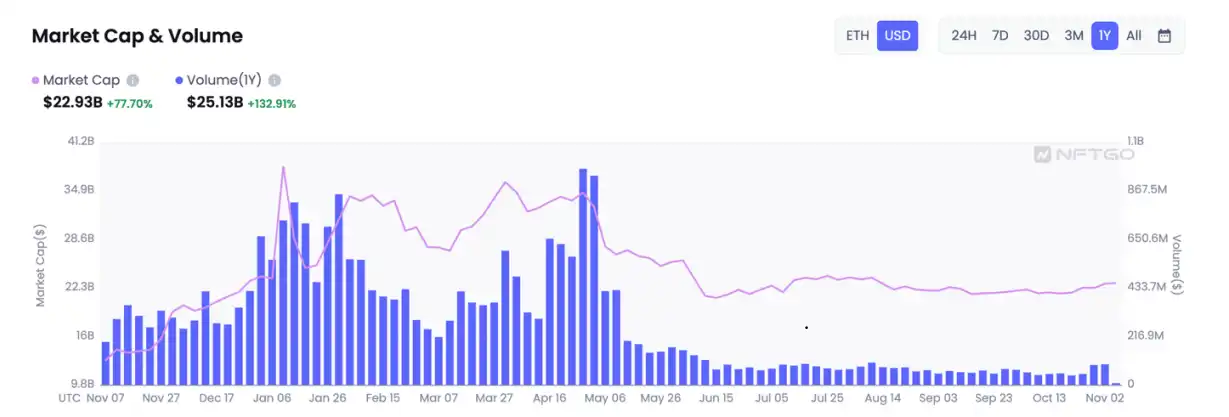
Figure 1-7: NFT Volume
Source: NFTGO
Although the NFT market is sluggish, the current average daily transaction volume is only 15% of the bull market, or even lower, but the growth rate of the number of wallets with NFTs has not slowed down, increasing by about 80,000 per week, as shown in the figure below. The number of market users continues to increase, and the number of new products increases, but the total market value of NFTs is slowly declining (as shown above). This is a phenomenon of eliminating bubbles in the NFT market. The price of NFTs tends to be rational, and more and more users will hold NFTs. This is a phenomenon of healthy market development.
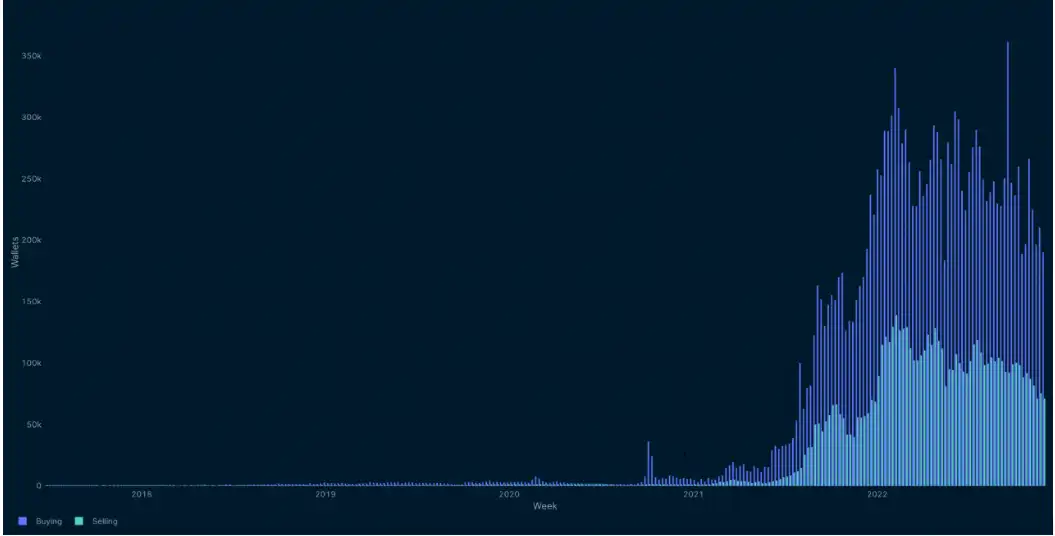
Figure 1-8: Number of wallets that have owned NFT
Source: nansen
Investment: Finding new hope in the bear market
The data of the secondary market of cryptocurrency continues to be sluggish, and the primary market is also difficult to remain immune. According to incomplete statistics from Odaily Planet Daily, the total amount of financing disclosed in the global cryptocurrency market in the third quarter of 2022 was US$5.841 billion, and a total of 442 investment and financing events (excluding fund raising and mergers and acquisitions) occurred, concentrated in 20 infrastructure, 50 technology service providers, 49 financial service providers, 246 applications, and 77 other service providers. Among them, the application track received the largest amount of financing, which was US$2.605 billion. Compared with the first and second quarters of 2022, the total financing amount and the total number of financing events in the third quarter have declined significantly:
According to public information statistics reported by Odaily and PANews, there were 511 investment and financing events in the global crypto market in the second quarter of 2022 (excluding fund raising and mergers and acquisitions), with a total disclosed amount of US$12.71 billion. Among all financing events, the number of transactions with a financing scale of more than US$100 million reached 28. In Q1 this year, there were 461 investment and financing events in the global crypto market, with a total disclosed amount of US$9.2 billion.
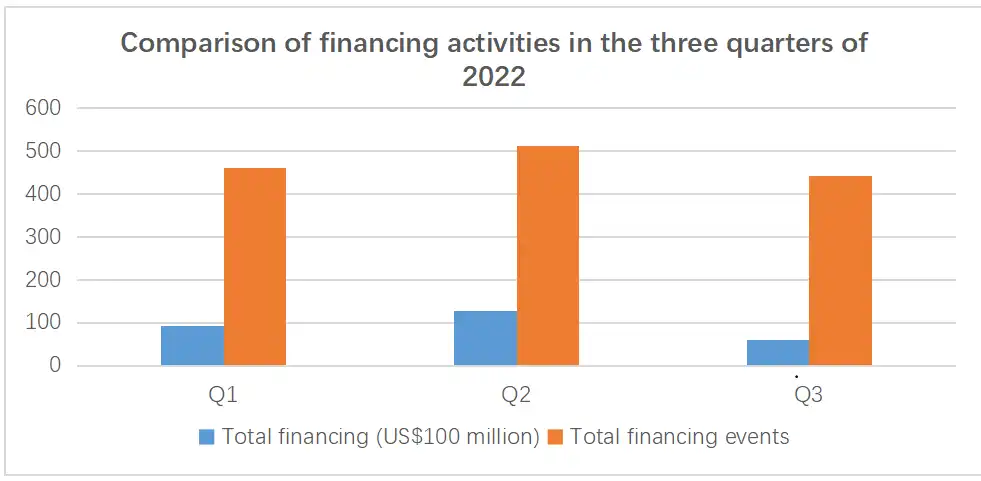
Figure 1-9: Comparison of financing activities in the three quarters of 2022
Source: Huobi Research
In Q2, the areas of greatest concern to global crypto investment institutions were GameFi and NFT. Games, game-related infrastructure, and technology solutions received a total of 82 financings, ranking first in terms of quantity, accounting for 16% of the total financing. The amount of financing in the GameFi field was also far ahead, reaching US$2.996 billion, accounting for 23.5% of the total financing in the industry.
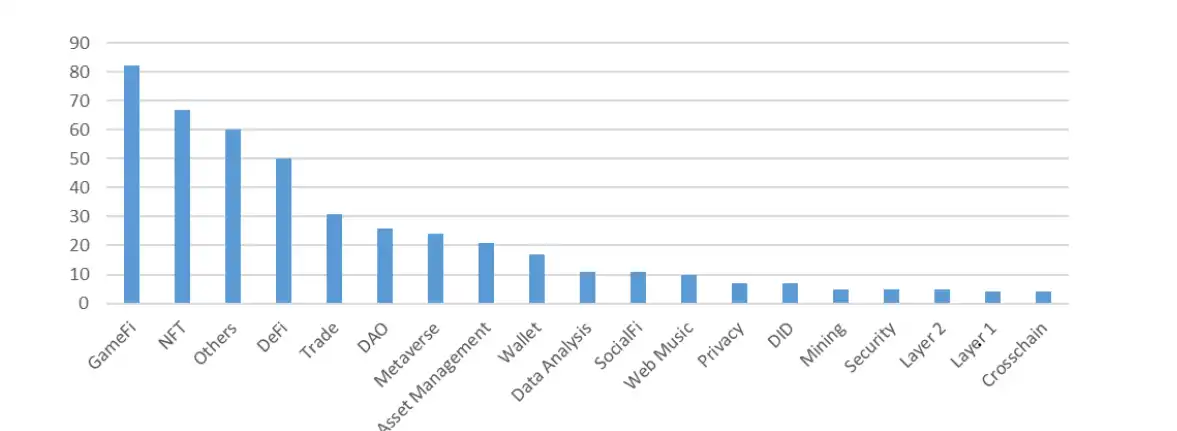
Figure 1-10: Classification of the number of cryptocurrency fund financings in the second quarter of 2022
Source: Huobi Research
The trend of capital tending to invest in GameFi continued in Q3. The financing amount of GameFi track is US$963 million, accounting for 16.4% of the total financing amount, and 15% (67) of the 442 financing events. These include blockchain game developers, blockchain game guilds, and X2E blockchain game projects.
In Q3, the financing performance of L1 projects was also very good. Although the L1 track has only 13 financings, accounting for only 3% of the total financing, its total financing amount reached US$625 million, which is the sub-track with the highest financing amount except GameFi. The two public chains of Move language, Sui and Aptos, are more outstanding. They claim to have inherited Libra's Move development language and focus on improving the security and scalability of L1, while massively improving network performance. High valuation financing has attracted the attention of the entire market. Under the star effect of the new public chain, new projects are emerging in an endless stream.
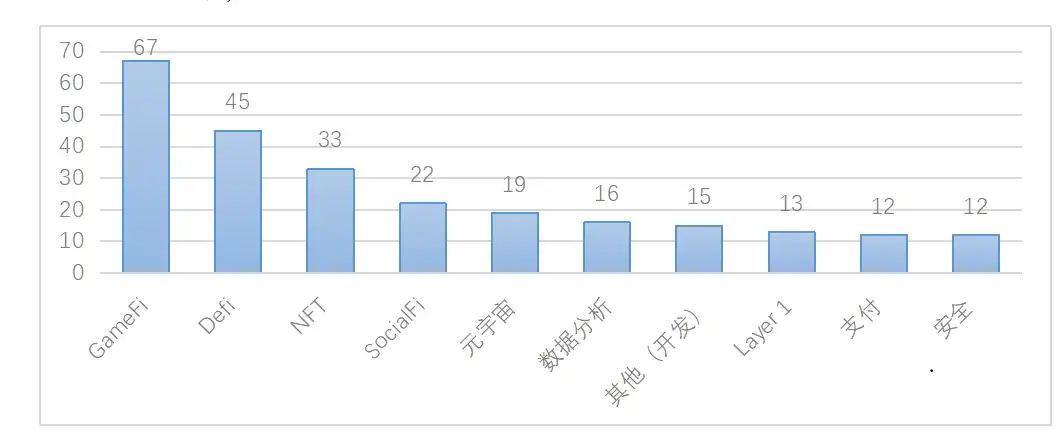
Figure 1-11: Classification of the number of cryptocurrency fund financings in the third quarter of 2022
Source: Huobi Research
Because the bear market lasted for a while, many institutions did not successfully survive, and some institutions were affected by the thunderstorm and disbanded or went bankrupt. Most crypto investment institutions have changed their style since the bull market and strengthened the screening of investment projects. Although in this environment, it is difficult for excellent projects to be covered up. The areas that each institution focuses on can be divided into two categories, infrastructure and application. Overall, everyone pays more attention to infrastructure projects. According to the public survey results of Huobi Research, Infra has the highest frequency of mentions, of which the two main lines are ZK and new public chains. Fields such as middleware, data, oracle, DID, etc. also clearly have infrastructure components. In terms of application projects, DeFi, GameFi, and social ranked in the top three. Although DeFi has been quiet for some time, it is still the direction that institutions are most optimistic about.
2. Regional Analysis of Crypto Market
2.1 Regional Market Traffic Analysis
After 14 years of development, crypto assets represented by BTC have influenced and spread to various regions around the world, and are developing rapidly from point to surface. In order to evaluate the development level of the crypto market in different regions of the world, we will mainly analyze and judge the penetration and development speed of crypto asset business in each region from the following four dimensions.
(1) Total Crypto Population and Occupancy Rate: Crypto population occupation rate refers to the ratio of the number of crypto users in a country to the total population of that country, which can most directly reflect the adoption of the crypto market in a country;
(2) CEX Traffic:Centralized exchanges are an important part of the cryptocurrency market. These exchanges are usually easy to use, and many crypto novices use them to explore the crypto world. Most of the users and liquidity funds in the crypto market are concentrated in centralized exchanges. We selected the top 100 CEXs in the market based on the active users, depth, trading volume and reliability of the exchanges themselves;
(3) DeFi traffic: DeFi has become one of the fastest-growing areas in the crypto market in the past two years. With the emergence of AMM, liquidity mining and other models, DeFi has quickly attracted a large amount of funds in the market. A large number of senior industry users and practitioners have actively participated in the interaction of DeFi applications. The analysis of DeFi protocols can help us accurately analyze the distribution of senior crypto users around the world. We selected nearly 300 mainstream DeFi projects on different public chains based on the TVL, trading volume, daily active users, etc. of DeFi protocols;
(4) Keyword popularity: Network popularity can reflect the public's interest in the crypto market from a more macro perspective.
2.1.1 Global Crypto User Growth Slows Down, Asia Accounts for More Than 40%
The following figure reflects the total number of authenticated global cryptocurrency users, which is based on statistics from multiple channels such as trading platforms, on-chain wallet information, and different service providers.
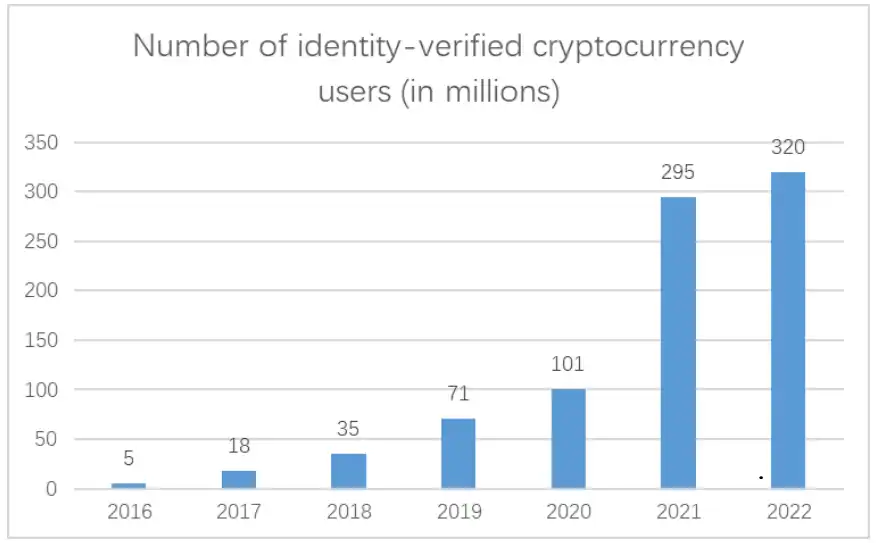
Figure 2-1: Global Crypto Population
Source: Statista, Huobi Research
From 2018 to 2020, the global cryptocurrency market was in its early stages of development, with slow user growth. After 2020, the booming ecosystem of the market attracted many crypto native users and ushered in explosive growth. As can be seen from the above figure, the growth rate and absolute value of growth in 2021 are the highest in recent years. This may be due to the entry of many financial institutions and traditional traders, coupled with the popularity of NFT, which has completely ignited the enthusiasm of the crypto market. After entering 2022, the global macro-economy is on the verge of recession, but the falling crypto market has shown surprising resilience. From the data, the global crypto user population continues to grow. As of November 2022, the total number of crypto users in the world is about 320 million, with a penetration rate of about 4.3%. Among them, the total number of crypto market users in Asia accounts for the largest proportion, about 40%.
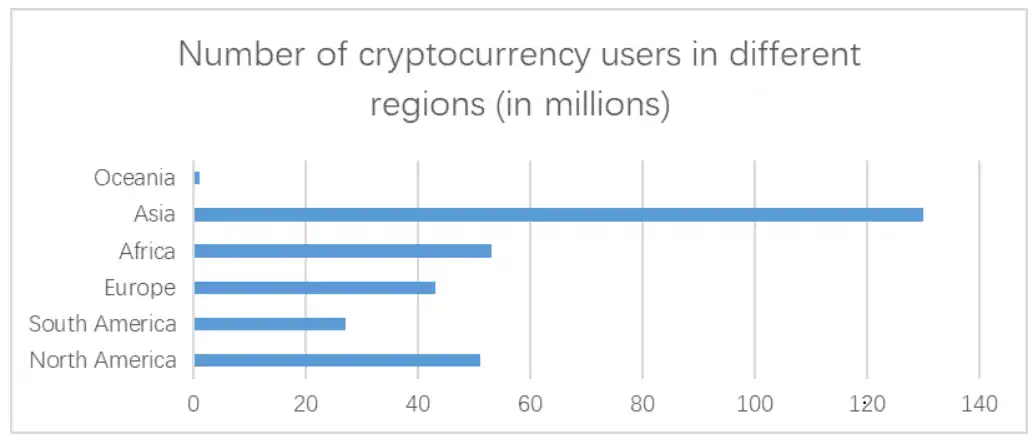
Figure 2-2: Number of crypto population in various regions around the world
Source: Statista, Huobi Research
2.1.2 The United States, South Korea, and Russia occupy the top three CEX traffic
From the data we obtained, we found that the overall market size of centralized exchanges in 2022 has dropped significantly compared with 2021. Specifically, the total market value of crypto assets has dropped by about 66% in the past year, the spot trading volume of cryptocurrencies has dropped by about 27%, and the number of unique visitors has dropped by 24%. From these data, it is not difficult to see that the monthly visits to centralized exchanges by both web and mobile crypto users are constantly decreasing. This is related to the gradual transition of the crypto market into a deep bear market. The continued decline in the market and the continuous shrinkage of assets have made the trading interest of existing crypto users less and less.
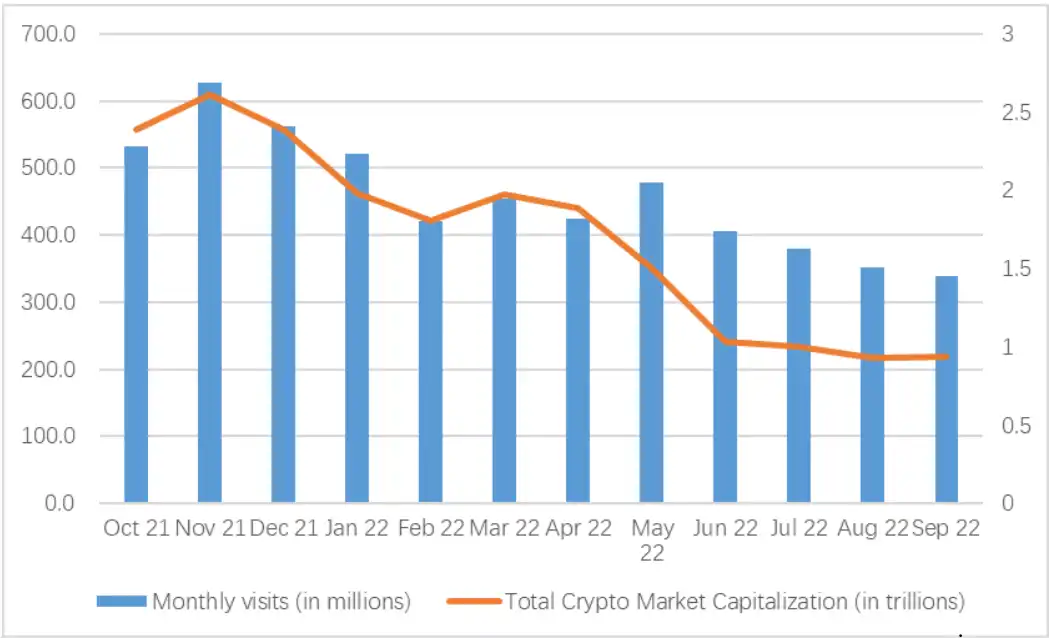
Figure 2-3: Monthly visit traffic and crypto market value of major CEXs in the past year
Source: Similarweb, Huobi Research
The above figure shows the relationship between the monthly visit traffic of major CEXs and the total crypto market value in the past year. The correlation coefficient between the two is 90.8%, which has a strong positive correlation. However, there are two points worth noting. First, the two diverged slightly in May 2022. This may be due to black swan events such as the collapse of LUNA, which required a large number of users to sell or buy at the bottom of the exchange, which in turn pushed up the exchange visits that month. Second, although the exchange visits declined, the decline was much smaller than the decline in market value. This shows that there are still a large number of existing users in the crypto market, and they continue to pay attention to the crypto market.
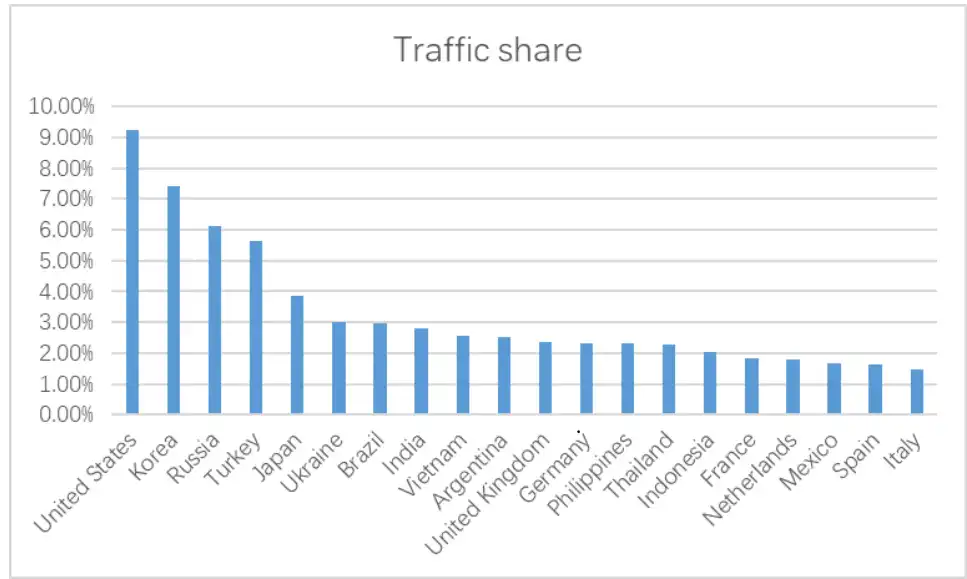
Figure 2-4: Major CEX traffic share in some countries
Source: Similarweb, Huobi Research
In terms of CEX traffic share, the United States firmly occupies the top spot with its absolute number of crypto users and market size advantages, followed by South Korea, Russia, Turkey, and Japan with 7.4%, 6.1%, 5.6%, and 3.8% respectively. In general, the top-ranked countries have relatively friendly policies towards the crypto industry. Because of the high unemployment rate and housing prices in South Korea and Japan, and the serious class solidification, young people pin their hopes of counterattack on cryptocurrency investment. Russia was forced to choose a more open and free financial system under sanctions. Turkey has long suffered from high inflation, and cryptocurrency has played a role as a currency substitute in the country.
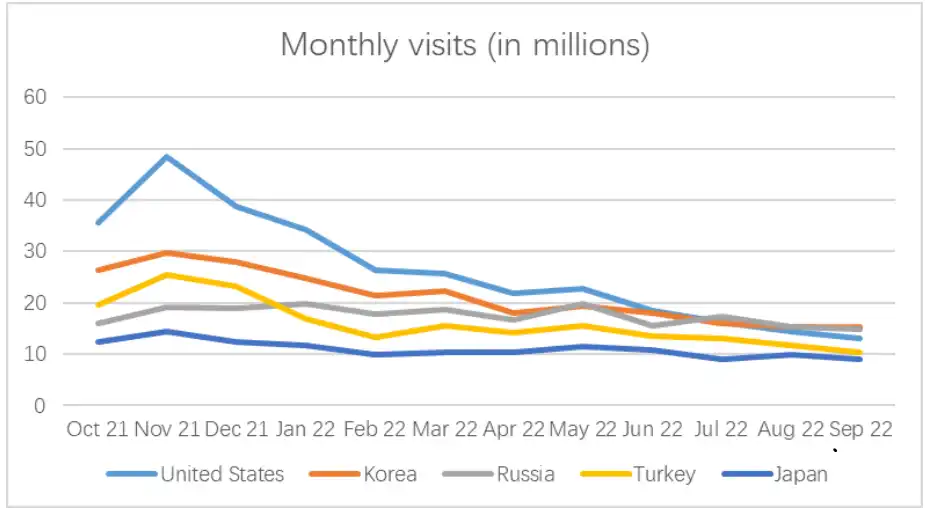
Figure 2-5: Major CEX traffic share and monthly traffic in some countries
Source: Similarweb, Huobi Research
The above figure shows the monthly visitor volume changes of the top five countries. The decline rates of the United States, South Korea, Russia, Turkey, and Japan are 72.9%, 48.6%, 25.6%, 59.6%, and 38.6%, respectively. Among them, the United States has the largest decline, which is mainly affected by the macro-economy. The Federal Reserve has continuously raised interest rates, tightened liquidity, and changed the risk preference of funds; while Russia has the least decline. The global economic sanctions caused by the war seem to have given the borderless crypto market a place to use, becoming one of the country's effective payment and trade supplementary channels.
2.1.3 DeFi users are dominated by the United States
The total number of independent DeFi users in the world has increased relatively over the past year. In 2022, even though a series of thunderstorms, de-anchoring and attacks occurred in the industry, the long-term value and basic functions of DeFi still make them maintain their confidence and are optimistic about the future market recovery. Therefore, we believe that the fundamentals of the DeFi market are still relatively healthy.
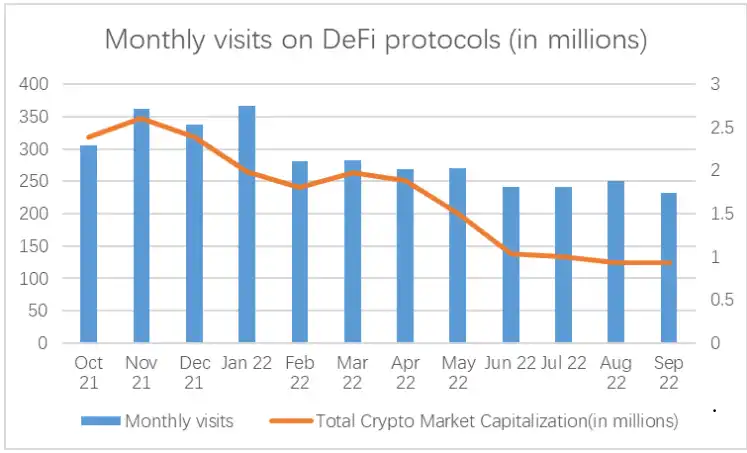
Figure 2-6: Monthly traffic of major DeFi protocols in the past year
Source: Similarweb, Huobi Research

Figure 2-7: Major DeFi traffic share in some countries
Source: Similarweb, Huobi Research
From the perspective of regional share, the United States has a clear market share advantage in DeFi, accounting for 31.8%, far exceeding other countries. This is related to the fact that DeFi projects originated in the United States. In recent years, the United States has also continued to embrace the encryption industry, attracting a lot of funds and talents, and many encryption start-ups have flocked to financial technology centers such as Silicon Valley and New York. Slightly different from CEX traffic, a number of developed countries such as the United Kingdom, France, Germany, and Canada rank high in the DeFi traffic share. This may be because the user group of DeFi tends to be professional and senior users, with a higher threshold, and the financial systems in these countries are more mature and investor education is more in-depth. Brazil ranks second because Brazil is the largest cryptocurrency market in Latin America, and some banks and investment companies are or are preparing to provide services related to the crypto market. Asset management companies QR Capital and Hashdex have also launched DeFi ETFs, which have played a role in popularization.
2.1.4 "NFT" has become the most concerned Crypto topic in the world
We have collected the main keywords related to the crypto market in the past year, and selected the 5 most frequent words (ranked in no particular order) to draw a visual map so that readers can more intuitively feel the distribution of interest in the crypto industry in various regions around the world.
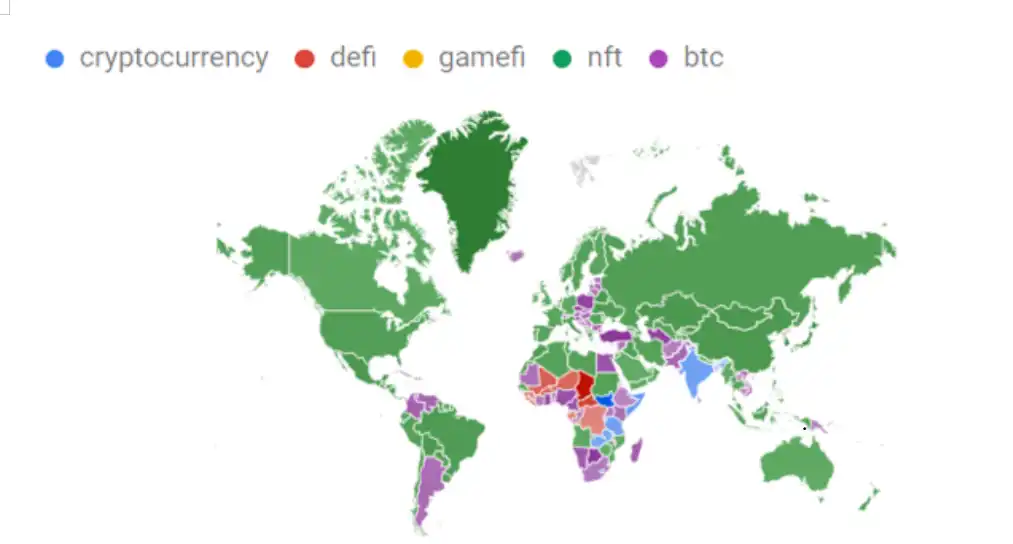
Figure 2-8: Worldwide keyword volume in crypto
Source: Google trends
From the distribution of keywords, "BTC", "DeFi" and "Cryptocurrency" are most frequently used in South America, South Africa and the Middle East. This is largely because the financial infrastructure and payment system in these regions are not well developed, and coupled with the long-term high inflation rate, cryptocurrency is an excellent alternative for daily payment and value storage; "NFT" performed surprisingly well, and its popularity has almost penetrated every corner of the world. This may be because NFT can be well combined with various industries such as sports, art, entertainment, culture and games, and it is very easy to go viral; coupled with the unique community culture and wealth effect of each NFT, it has further expanded its influence and set off a global NFT trend.
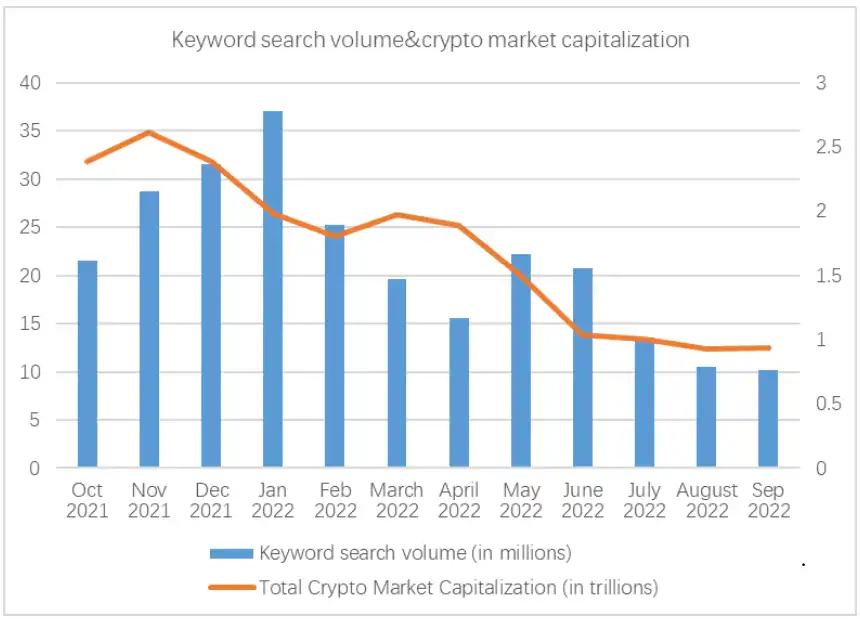
Figure 2-9: Keyword search volume and total crypto market capitalization
Source: Similarweb, Huobi Research
The above figure shows the search volume of various crypto keywords over the past year, which can reflect the public's interest in the crypto field. The rise of the NFT market in 2021 has made crypto popular, and various crypto keywords have occupied the popularity list of Internet users, and search traffic has continued to increase. Entering 2022, as the overall market of the crypto market has declined, industry attention has begun to decline. A series of accidents in the industry during Q1 and Q2 also made the already fragile market sentiment even lower. With the end of the only few major industry hot events in the second half of 2022, the global attention to the crypto market is in a relatively quiet state. Due to the characteristics of mass communication, negative news always attracts readers more, so the peak of search volume often occurs in periods when the market falls rapidly and there are many negative news. But in the long run, the public's attention to the crypto industry has dropped by nearly half.
2.2 Regional Market Industry Analysis
2.2.1 North America: The Main Battlefield of DeFi Innovation
North America is an important part of the global crypto market. Currently, the region has about 47 million crypto users, accounting for 14.7% of the global crypto population. As North America is one of the most economically developed regions in the world, the crypto market is also very active. Judging from the proportion of traffic, the DeFi business carried out in North America is particularly strong. Let's make a specific analysis of the United States, one of the major countries in the region.
United States: The Vane of the Crypto Market
In the past few years, the United States has seen a significant shift in its view of cryptocurrencies. More and more people have begun to notice cryptocurrency investment and trading, and have joined the ranks. The crypto market indicators we listed also reflect this phenomenon, with the United States ranking at the top in all dimensions.
Currently, there are about 46 million users in the U.S. crypto market, accounting for 13.7% of the total population; the traffic in centralized exchanges and DeFi fields accounts for 9.2% and 31.8% respectively. Judging from the types of transactions in the United States on various CEXs, BTC is the main choice for American crypto users, followed by Ethereum, Dogecoin, ADA and other cryptocurrencies. Specifically, the United States is leading the world with a BTC trading volume of about $1.5 billion. The leading data performance also explains why price fluctuations in the crypto market in recent years are often strongly correlated with the U.S. risk market. Especially since 2022, the price trend of the crypto market has been almost entirely guided by the Federal Reserve's monetary policy; on the other hand, the United States is far ahead in terms of transaction volume of 31.8% of many DeFi protocols. The embrace of DeFi has also made the United States the forefront of DeFi innovation. Silicon Valley, New York and other places have gathered a large number of developers, and most projects are more likely to obtain early funding and talent support in this hot land.
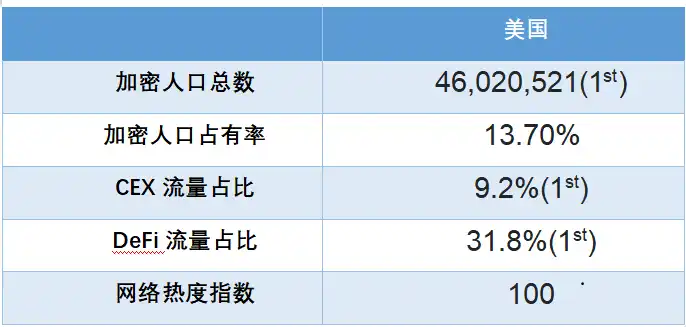
Table 2-1: US crypto market development indicators
Source: Huobi Research
The rapid development of the US crypto market can be mainly attributed to the following reasons:
1. Young people are the main user group in the crypto market. According to a Finder survey, young people aged 18-34 in the United States are the main force, accounting for 56% of the total crypto users. Compared with middle-aged and elderly people who prefer traditional investment portfolios such as stocks and bonds, young people seem to be more able to bear risks. The high returns that cryptocurrencies may bring attract them, driving the overall market adoption rate; 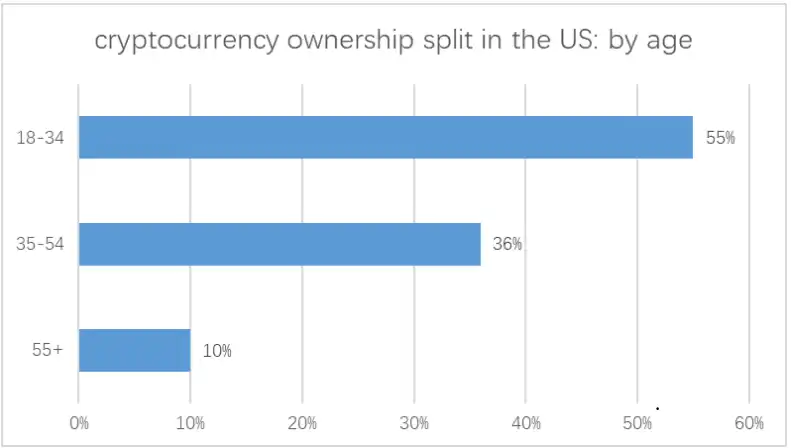 Figure 2-10: cryptocurrency ownership split in the US: by age Source: Finders
2. The compliance process is advancing. Most states in the United States have introduced crypto-friendly bills to promote local legalized crypto activities. For example, Ohio proposed a bill to pay taxes in cryptocurrencies; Wyoming passed 13 laws, including recognizing cryptocurrencies as currencies and allowing local banks to provide custody services for digital assets. With these bills, large institutions and financial service providers can provide legalized asset management and related crypto services to American users;
3. Other factors. In addition to the above reasons, we believe that there are some other events that have played an important role in promoting the development of the US crypto market, such as the entry of large institutions such as Microstrategy and Tesla, the increasingly rich offline cryptocurrency payment scenarios in the United States, and the influx of large crypto startups to the United States.
2.2.2 Southeast Asia: Emerging markets emerge, and the share of crypto users surges
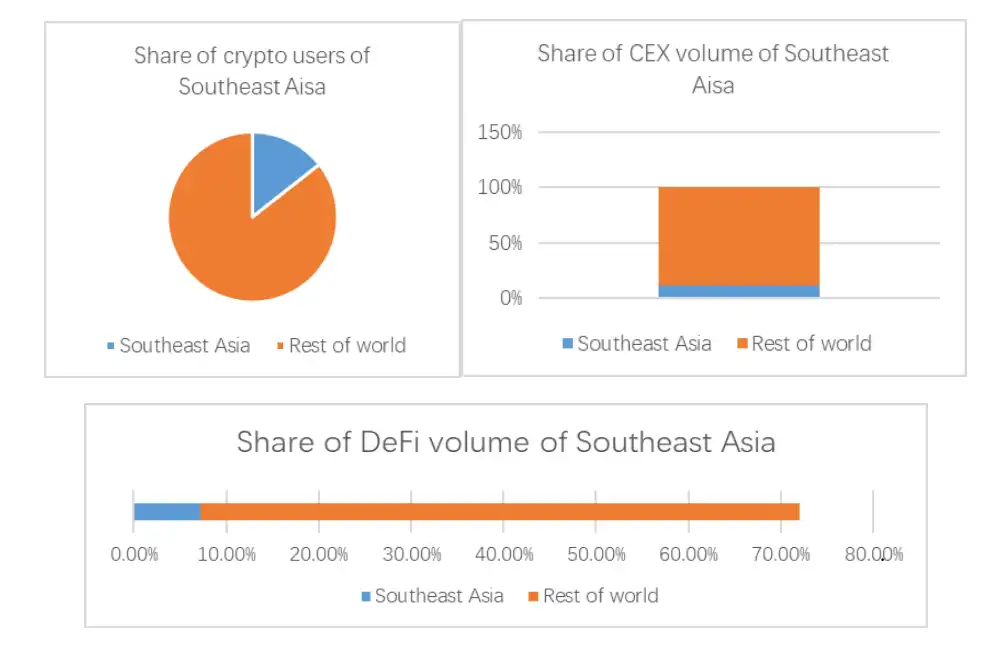
In recent years, the crypto market in Southeast Asia has grown very rapidly. The total crypto population is currently about 46 million, second only to the North American market. Although the region is dominated by low- and middle-income countries, the per capita purchasing power is not as good as that of developed regions. However, the share of crypto users in some Southeast Asian countries (such as Vietnam, the Philippines, and Thailand) is relatively outstanding, and crypto activities have penetrated into many life scenarios.
Vietnam: The first in national cryptocurrency adoption
The country has about 20 million crypto users, accounting for more than one-fifth of its total population, successfully ranking first in the world's high cryptocurrency adoption countries.
The main reasons for the growth of emerging crypto markets in Southeast Asia, represented by Vietnam, are as follows: (1) Complying with local financial reform and modernization requirements. In the past decade, Southeast Asian countries and governments have attached great importance to emerging technologies such as blockchain and expect them to pave the way for economic digitalization. In Vietnam, cashless payments have gradually become the norm in the country, and the local government has set relatively loose crypto taxes to expand the adoption of cryptocurrencies; at the same time, due to the underdeveloped traditional financial system in the region, the services available are very limited, causing users to turn to more efficient cryptocurrencies; (2) GameFi has become a popular investment scenario for users. Based on the humanistic environment and consumption habits in Southeast Asia, games are an extremely important part of the region. According to public data, in 2020, Indonesia had the highest mobile game downloads at 38%, followed by Vietnam at 22%; the Philippines and Vietnam ranked high in terms of game payment rates, at 55% and 50% respectively. The developed game industry environment also provides a good soil for the birth of blockchain games. In 2021, the phenomenal blockchain game Axie Infiity was launched. Its innovative "play-to-earn" model quickly ignited market enthusiasm, attracting a large number of users and funds to rush in. Southeast Asia has undoubtedly grown into the center of GameFi.
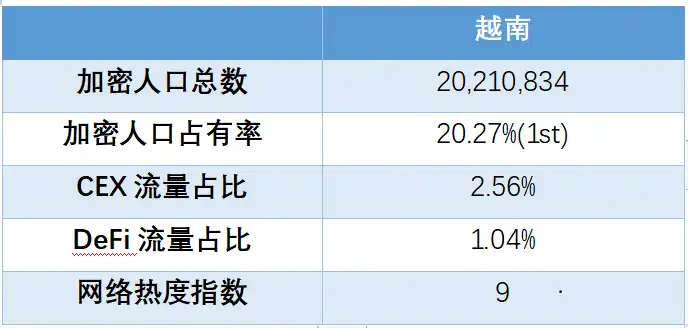
Table 2-2: Vietnam Crypto Market Development Indicators
Source: Huobi Research
Singapore: New favorite of crypto, important node of global web3
Singapore has seized the opportunity in the saturation and sinking of the US and Chinese Internet markets and the rise of the Southeast Asian economy in recent years. Especially in the accelerated period of digital transformation after the epidemic, Singapore has gradually become a hotbed for Internet entrepreneurship, attracting a large number of innovators and unicorn companies. This naturally includes the crypto field. Singapore provides a highly open policy environment for the crypto industry, with clear supervision but also a lot of room for fault-tolerant innovation. According to the Gyro Report, the Monetary Authority of Singapore provides a more inclusive green light supervision method such as the enhanced version of the regulatory sandbox in DeFi. Even if the license fails to apply, it can be temporarily allowed to provide specific payment services according to the exemption regulations. Therefore, Singapore has gradually become one of the most friendly regions in the global crypto field. According to data released by KPMG, there were more than 80 venture capital transactions in Singapore in the crypto field in 2021, with a total of US$1.48 billion; compared with only 26 transactions in 2020, with a total of US$110 million, the amount increased by nearly 14 times month-on-month.
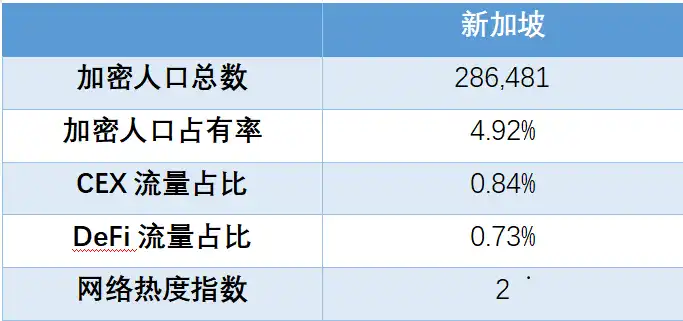
Table 2-3: Singapore Crypto Market Development Indicators
Source: Huobi Research
2.2.3 Other regions in Asia: The crypto population base is huge and the market enthusiasm remains high
Asia is a vast region with many countries and has the largest number of crypto users in the world. Below we select several key countries for analysis:
Japan and South Korea: Cryptocurrency trading activities are extremely active
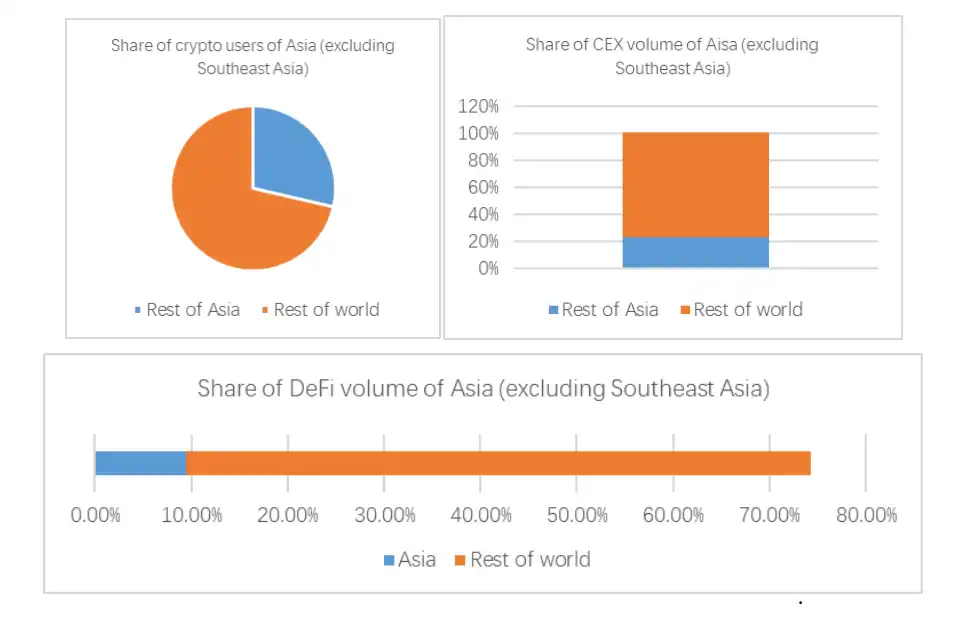
The performance of Japan and South Korea in the proportion of exchange traffic cannot be ignored. Specifically, South Korea ranks second with 7.4% and Japan ranks sixth with 3.85%. On the one hand, major crypto exchanges such as Upbit, Bithumb, CoinOne, Korbit and Gopax are located in Japan and South Korea, pushing up the data performance of the two in this part; on the other hand, according to Coindesk, the high unemployment rate and high housing prices in the two countries force local young people to seek other means of creating wealth. Especially South Korea, which is almost in a situation where everyone is speculating in cryptocurrencies. In addition to employment and high consumption pressures, the local class solidification and chaebol monopoly also make the entrepreneurial road of the lower class society extremely difficult. Cryptocurrency, as a stateless investment, is seen by their young people as an important means to escape poverty, accumulate wealth, and even achieve class leap. Data shows that one in five young Koreans is speculating in Bitcoin. In addition, the local government's legalization of the possession, sale, and purchase of crypto assets and the possible introduction of favorable tax law proposals in the future have made the crypto market increasingly popular in the region.

Table 2-4: Development indicators of crypto markets in Japan and South Korea
Source: Huobi Research
Hong Kong: The dormant financial center of the East
Hong Kong's crypto market has been in a gray area for a long time. As the former center of Asia, Hong Kong has attracted a large number of well-known crypto companies such as Animoca, FTX, and BitMEX with its developed financial industry and the inherent advantages of the mainland market. However, with a series of comprehensive bans on crypto activities in mainland China, Hong Kong has quickly lost its market advantage; coupled with the steady progress of the CBDC pilot work in Hong Kong, the Hong Kong Monetary Authority also hopes to bring potential cryptocurrencies under regulatory supervision. The tightening policy environment has accelerated the exodus of a large number of practitioners and crypto companies, resulting in a rapid decline in Hong Kong's crypto market share in the past few years. However, with Hong Kong's release of a new virtual asset policy declaration on October 31, 2022, clarifying the legality of local crypto activities, the reopened Hong Kong crypto market is expected to rise again in the future.
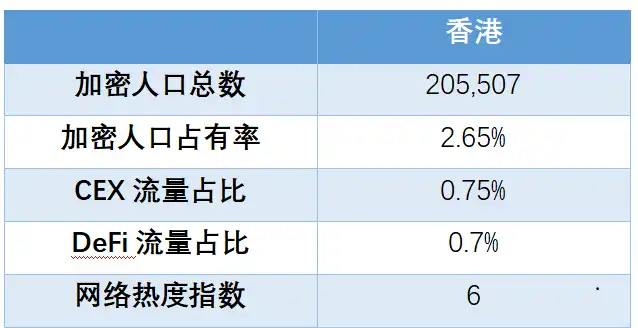
Table 2-5: Hong Kong crypto market development indicators
Source: Huobi Research
India: Regulatory uncertainty, crypto market forging ahead
The Reserve Bank of India is not as interested in crypto technology as other central banks. Its finance minister announced in 2018 that the Reserve Bank of India would ban cryptocurrencies completely, but did not raise it to the legal level. This means that crypto trading is in a gray area in India. Therefore, although the Indian crypto market has been facing great development resistance for a long time, it has not stopped moving forward.
Until last year, the Indian Supreme Court ruled that the Reserve Bank of India's ban on cryptocurrencies was unconstitutional, marking a relaxation of Indian policies. The shift in government regulation has greatly promoted the development of India's crypto economy. According to Coindesk, the number of investors who want to buy and trade cryptocurrencies in rural areas of India has increased significantly, and the number of rural registrations of Coinswith Kuber has increased by 135%; at the same time, the Indian blockchain industry has completed 16 transaction financings so far this year, with a total amount of more than US$627 million, which is 14.25 times that of 2021. In addition, although India has a large population base, young people are well educated and are more receptive to and understand the cutting-edge technologies and concepts of blockchain and cryptocurrency. A large number of existing excellent technology development teams in the encryption field, such as Matic and Starkware, are from India, and they have become the top projects in their respective technology branches. These are enough to reflect the huge potential of the Indian encryption market.
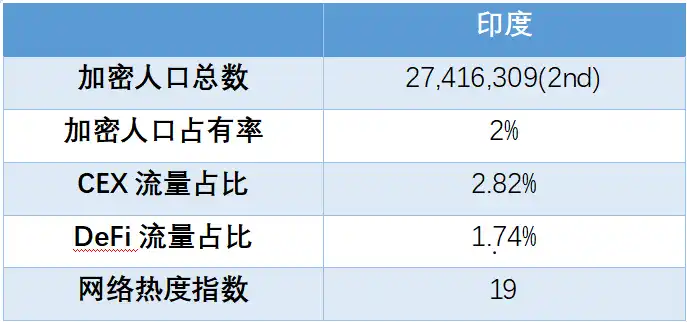
Table 2-6: Indian Crypto Market Development Indicators
Source: Huobi Research
2.2.4 Europe: One of the main forces of crypto, war failed to stop the market's progress
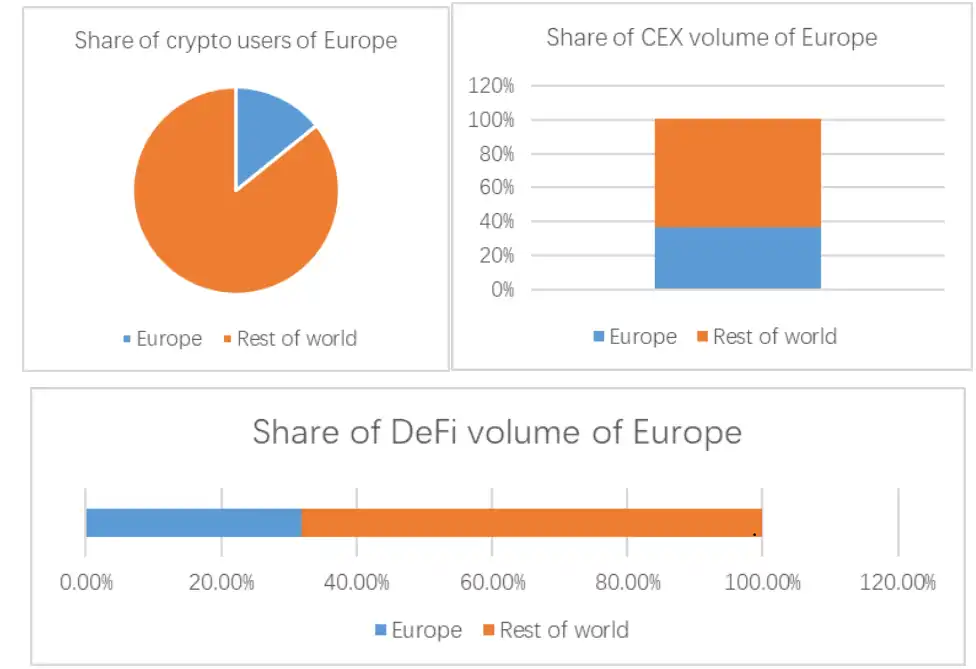
In Europe, we focus on Russia and Ukraine. From our data, Russia and Ukraine also rank high in various indicators. This is largely due to the outbreak of the Russian-Ukrainian war, which has led to an increase in crypto activities in both countries.
From the Russian side. Currently, the population with cryptocurrencies exceeds 14.6 million, accounting for 10.1% of the total population. The country has taken many proactive steps to establish cryptocurrency-related regulations. In September 2022, Russia passed legislation approving the mining of cryptocurrencies using resources such as hydropower and nuclear power in some parts of the country. In addition, since the war forced the country to withdraw from SWIFT under sanctions from Western countries, cryptocurrencies may be an important supplement to foreign trade settlements. Also in September, the Central Bank of Russia officially announced the legalization of cross-border payments using cryptocurrencies such as Bitcoin and Ethereum.
As for Ukraine, the sudden war has dealt a heavy blow to the country's economy, with inflation remaining high; coupled with the local central bank's martial law order that has imposed strict restrictions on cash transactions for residents of the country, many Ukrainians believe that cryptocurrencies are an effective hedge against inflation. As a result, the volume of cryptocurrency transfers in Ukraine has continued to grow since the start of the war.
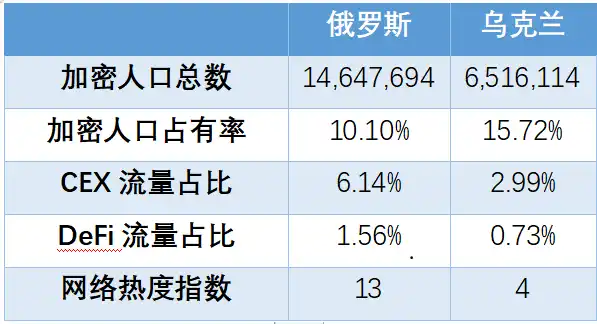
Table 2-7: Development indicators of the Russian and Ukrainian crypto markets
Source: Huobi Research
2.2.5 South America & Africa: application scenarios are mainly payment and stored value
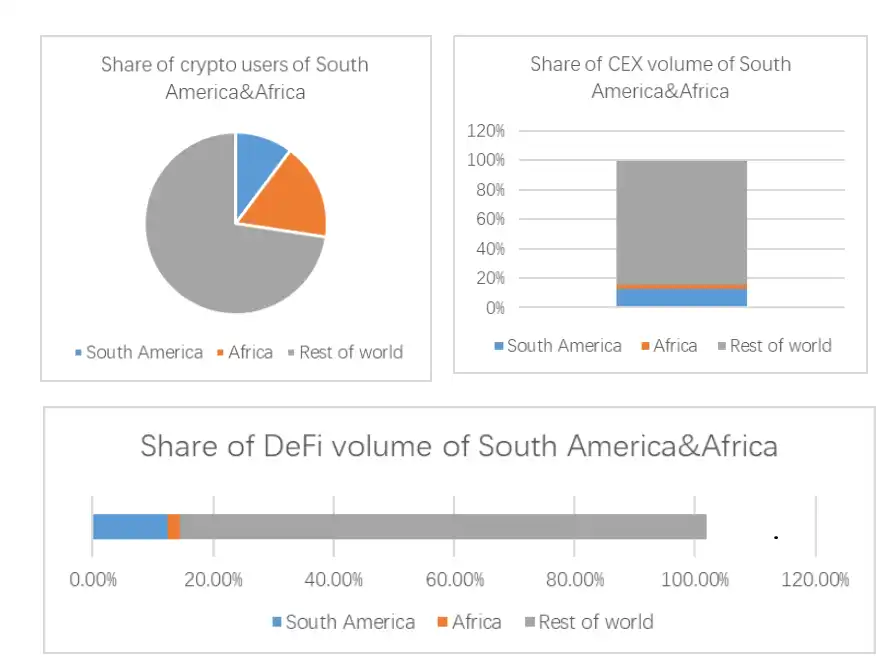
The reasons why major countries in South America and Africa adopt cryptocurrencies are mostly consistent, mainly due to domestic financial crises, high inflation, and excessive depreciation of legal currencies. Typical countries include Venezuela, Argentina, Brazil, Morocco, and Egypt.
Although not all cryptocurrencies can be used as risk hedging tools, stablecoins are definitely a good means of asset reserves in these regions. According to public data, due to the annualized inflation rate of up to 8% for many years, at least more than 1/3 of people in South America and Africa are accustomed to using stablecoins for retail transactions and daily asset reserves. At the same time, these regions are also the regions with the highest proportion of stablecoins used for remuneration payments in the world.
2.2.6 Crypto Market Development Maturity Index, the United States ranks first
Finally, based on the above analysis and combined with the 4 indicators in this chapter, we calculated the crypto market development maturity index of 15 different countries in the world.
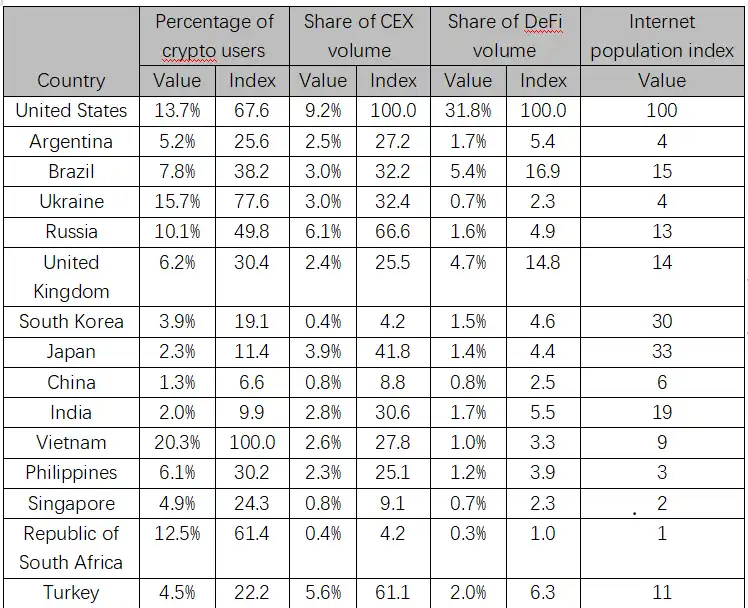
Table 2-8: Cryptocurrency Market Development Maturity Index of Some Countries
Source: Huobi Research
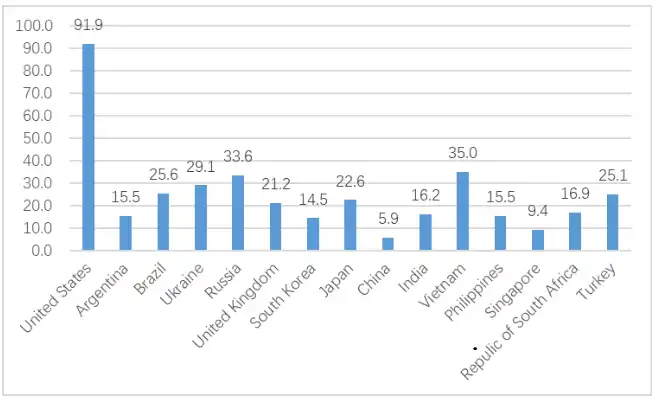
Figure 2-11: Total Evaluation Score of Each Country
Source: Huobi Research
Based on our indicators, the US cryptocurrencies are the most mature, but the market penetration rate is not as good as that of emerging markets such as Vietnam. This may be due to the fact that the US financial system is relatively developed. Although the amount of funds is huge, investors have a variety of asset allocation options besides cryptocurrencies. In contrast, investors in emerging markets such as Vietnam, Argentina, and Brazil do not have many financial options. Cryptocurrencies, as borderless assets, have the characteristics of high returns and high liquidity, and are deeply favored by them. As the crypto industry continues to develop and regulatory policies continue to improve, the potential of these emerging markets cannot be underestimated.
3. Top 10 Crypto Industry Events in 2022
3.1 Terra Collapses, Industry Enters a More Severe Bear Market
The collapse of Terra can be said to be one of the worst events in 2022 and even in the history of the entire industry. Terra was once popular in the entire currency circle and ranked among the top ten crypto assets. Its collapse caused many investors to lose all their money, and it also made the cryptocurrency market, which had already entered a bear market, worse.
Founded in 2018, Terra is a payment blockchain built through the dual-currency mechanism of "stablecoin" UST and "governance token" Luna. In early 2022, Do Kwan, the founder of Terra, launched a protocol called Anchor: as long as you deposit UST, you can get an annualized return of 20%. Therefore, LUNA has attracted many investors, and its decentralized characteristics have also won the favor of the currency circle. After the launch of the Anchor protocol, most of the UST on the market were deposited in the protocol. Before the collapse of UST, nearly 75% of UST (up to 14B) were on the Anchor protocol. Many investors even mortgaged other cryptocurrency assets to borrow UST to earn an annualized return of 20%. Because the demand for UST is getting bigger and bigger, the price of LUNA has also climbed to over $100. At its peak, the issuance of UST exceeded 15 billion, making it the largest decentralized algorithmic stablecoin in the currency circle.
In May 2022, Terra's UST fund pool in Curve lost balance due to a large-scale sell-off by users, and UST was de-anchored, and the price fell all the way. Faced with the imbalance of UST, Do Kwan used the LFG team fund to sell 80,000 BTC to buy back a large amount of UST. Unfortunately, the market has lost confidence in Terra, and other users have sold UST. Terra's algorithm also caused a large number of LUNA to be issued, so LUNA & UST entered a death spiral. Traders on the Terra chain could not keep up with the massive sell-off, so the crash was inevitable.
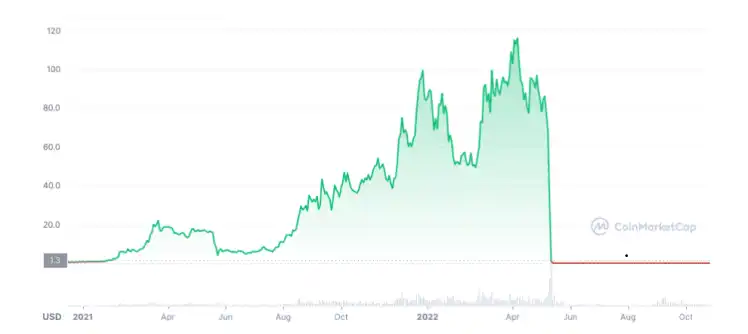
Figure 3-1: LUNAUSD
Source: Coinmarketcap.com
The collapse of Terra caused huge losses to the market. The price of UST fell to $0.2 in a few days, and the price of LUNA also returned to zero. The market value of Terra Network evaporated by $40 billion, and many investors suffered heavy losses. In addition, the 80,000 bitcoins sold by LFG also caused a huge impact on the market. The decline in the price of Bitcoin also caused the overall market to face a more severe bear market.
3.2 Three Arrows Capital went bankrupt, and the crypto industry entered the "Lehman moment"
Three Arrows Capital is a cryptocurrency hedge fund founded in 2012 by founders Su Zhu and Kyle Davies. Three Arrows Capital is known for its highly leveraged bets, borrowing large amounts of money from different companies and investing in many different digital asset projects. In March 2022, its assets under management reached $10 billion, and its portfolio included tokens such as Avalanche, Solana, Polkadot, and Terra. Three Arrows Capital is undoubtedly an investment giant in the cryptocurrency circle.
After the collapse of Terra, there were rumors that Three Arrows Capital was facing liquidity problems, and there were also reports that the company was suspected of misappropriating customer funds. On June 14, 2022, Su Zhu deleted the digital currency labels including Ethereum from the profile of his social media Twitter account and tweeted on Twitter: "We are communicating with the relevant parties and are fully committed to resolving this issue." However, Su Zhu did not specify the specific content of the "problem" he responded to.
The following week, digital asset brokerage firm Voyager Digital said it had lent 15,250 bitcoins and $350 million in stablecoins USDC to Three Arrows Capital. At the price at the time, the total loan amount exceeded $675 million. Voyager Digital required Three Arrows Capital to repay all outstanding loans by June 27, otherwise it would face default. As a result, Three Arrows Capital did not repay the loan, and Voyager immediately sought compensation from Three Arrows Capital through legal channels. After the incident was exposed, other Three Arrows Capital borrowers asked Three Arrows Capital to repay the loan, including Genesis Global Trading BlockFi, BitMex, FTX, and Blockchain, etc. Three Arrows Capital was forced to sell its assets, and once sold 80,000 stETH (over $84 million) in the stETH/ETH pool on Curve, causing stETH to depeg (stETH once depegged to 0.94ETH).
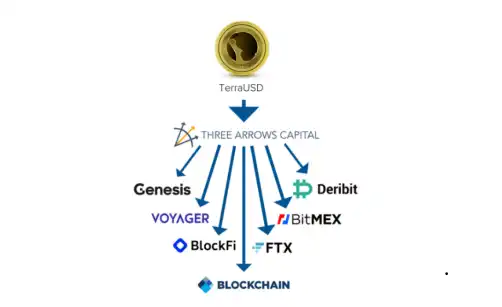
Figure 3-2: Schematic diagram of Three Arrows Capital
Source: CNBC.com
Three Arrows Capital opened a fund exposure in the cryptocurrency circle, which has far-reaching impacts. However, due to the lack of transparency, no one knows who holds exposure to them. As more and more institutions disclose the bad debts of Three Arrows Capital, the entire industry has caused panic, funds have been withdrawn continuously, and the crypto industry has entered the "Lehman moment".
3.3 FTX incident triggers industry earthquake
In November this year, FTX was depleted of liquidity and insolvency due to user runs, and finally declared bankruptcy. This can be said to be the first major risk event since this round of bear market, and its impact is wide and far-reaching.
FTX was founded in 2019 and was co-founded by Sam Bankman-Fried with its sister company Alameda. In the short three years from its establishment until the thunder, FTX has become a centralized exchange with a market value of US$24 billion, ranking second in the industry, and its founder SBF's personal assets have reached US$15.6 billion. But within a week, all these assets vanished.
The root cause of the matter is that FTX, as a centralized exchange, holds a large amount of user assets. Since its sister company Alameda needs a lot of funds for its business, it uses the tokens it holds, such as FTT and SOL, as collateral to borrow user funds from FTX. In this way, although FTX's user assets have not changed much in terms of book value, they have changed from assets containing a large number of stablecoins and BTC to holding a large number of tokens such as FTT and SOL, with serious asset homogeneity and high volatility. The fuse of the matter came from Coindesk discovering the problems on FTX's balance sheet and publishing an analytical article to warn. Later, Binance founder CZ used this as an excuse to announce that he would sell the FTT he held to avoid risks, which caused market panic, causing the price of FTT to plummet, which caused FTX's asset side to shrink significantly and triggered a wave of user runs. In the end, FTX was depleted of liquidity due to user runs, and its assets such as FTT and SOL fell sharply, resulting in insolvency, and finally declared bankruptcy.
FTX's bankruptcy directly triggered an industry earthquake and led to a market crash. As one of the industry leaders, FTX and Alameda have participated in the investment of many projects. Especially during this year's bear market, they have repeatedly rescued companies in the industry that are in crisis, establishing the image of the central bank in the currency circle. According to incomplete statistics, FTX has participated in more than 110 direct investment projects, some of which are shown in the following table:
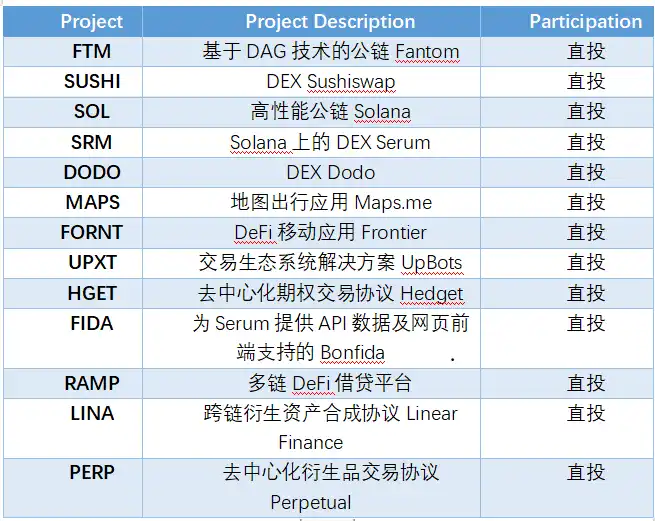
Table 3-1: FTX Direct Investment Projects (Part)
Source: Dune, Huobi Research
In addition, other projects that have business dealings with FTX, such as bitDao and MIM, and investment companies such as Sequoia Capital and Temasek, have suffered losses such as token plunges and write-downs of related investment assets. It can be said that the impact of the FTX bankruptcy incident is far-reaching, and the losses caused are not comparable to those of Luna, 3AC and other incidents. It can be called a real Lehman incident in the currency circle.
In addition to the market decline and losses suffered by related companies and projects, this incident has also had a serious impact on the entire industry ecosystem. The most direct impact is that centralized exchanges have encountered a crisis of trust. Since the outbreak of the incident, major exchanges have faced pressure to withdraw coins, showing that current users have great distrust of centralized exchanges under the influence of panic. Faced with this situation, major exchanges have taken measures to save themselves, such as disclosing reserve assets, calling for the establishment of industry norms and industry recovery funds, etc. But in the long run, this incident will have a far-reaching impact on the entire industry ecosystem: users' loss of trust in centralized institutions and increased calls for decentralization may lead to the re-development of decentralized projects; supervision will inevitably be further strengthened, and the difficulty and cost of obtaining compliance licenses will be further increased; the information transparency of various projects or institutions will be greatly improved after this incident; the incident may cause users to shake their confidence in the entire cryptocurrency industry, causing the market to fall and the downturn to be greatly prolonged, etc. Despite this, we believe that there is no construction without destruction. Every outbreak of an incident is a way to cure the poison, and every decline in the market is an opportunity. As the incident gradually subsides, the industry will still gradually move in a good direction after experiencing pain.
3.4 The Federal Reserve has raised interest rates sharply, and high-risk assets are the first to bear the brunt
In the previous article, we said that the most important event in the global macro market in 2022 is global inflation and monetary tightening policies such as interest rate hikes by central banks in various countries to cope with inflation. And the characteristics of this round of inflation and interest rate hike cycles are: high and stubborn inflation, fast and large interest rate hikes. The following figure shows the inflation rate and benchmark interest rate data of the United States since 1980: 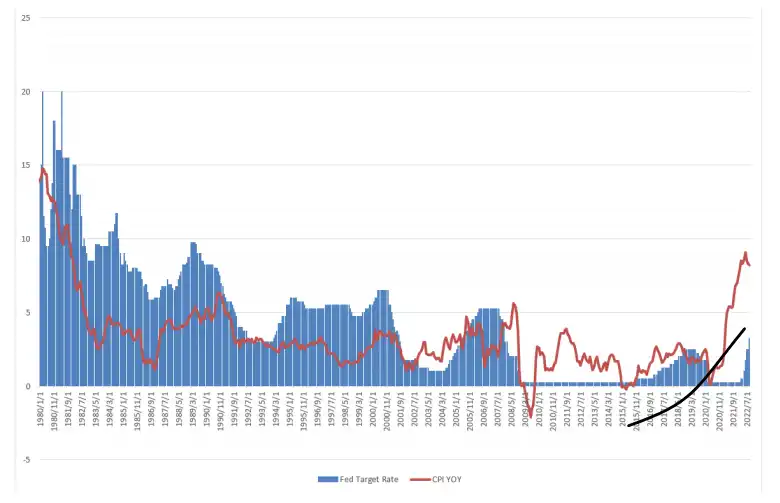
Figure 3-3: 40 years of US CPI year-on-year data and benchmark target interest rate
Source: Bloomberg, Huobi Research
As can be seen from the above figure, the current inflation rate in the United States has reached its highest level since 1980, and the benchmark interest rate has reached its highest level since 2008 in 8 months, and it is expected that interest rates will continue to rise before the second quarter of next year. Against this background, countries and industries around the world have felt the coldness of the financial winter. The following table shows the rise and fall of major asset classes in 2022.
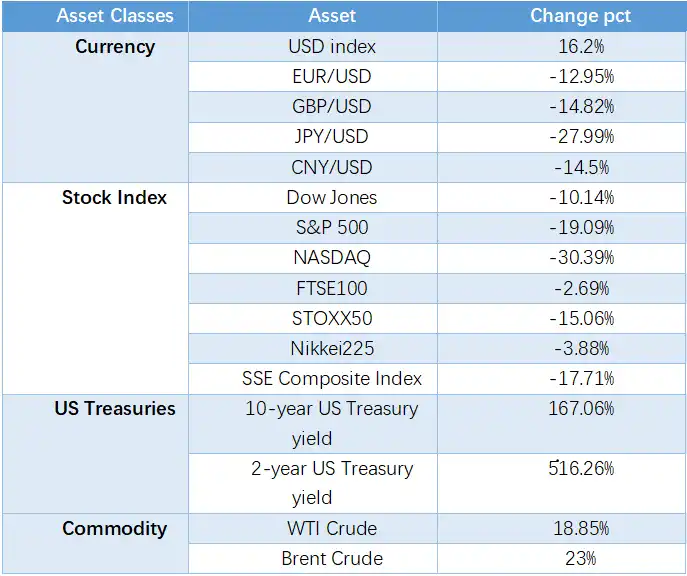
Table 3-2: Rise and fall of major asset classes in 2022
Source: Bloomberg, Huobi Research
As can be seen from the above table, under the background of the Fed's sharp interest rate hike, global major asset classes have been greatly affected: except for commodities that have risen due to factors other than US monetary policy, global stock markets, currencies and government bonds have all fallen sharply. Among them, the 2-year US Treasury bonds, which represent short-term funding costs, and the Nasdaq, which is dominated by technology stocks, fell relatively more. In this case, the cryptocurrency industry is also unavoidable. What's more, due to its own characteristics, the leverage ratio of the cryptocurrency industry is higher than that of traditional industries. In the context of global capital tightening, the deleveraging process is relatively more violent and intense. For example, the collapse of Terra and the bankruptcy of Three Arrows Capital, major annual events, although they have their own direct causes, the fundamental reason is the cash flow problems caused by the global monetary tightening environment. Therefore, in a few years, if we want to analyze the major events in the crypto industry in 2022, the global liquidity tightening represented by the Fed's interest rate hike is the root of many problems.
3.5 Ethereum Merger, New Era of PoS Opens
On September 15, 2022, the much-anticipated Ethereum merger was successfully completed, marking the official switch of the consensus mechanism of the Ethereum mainnet from Proof of Work (PoW) to Proof of Stake (PoS).
As a world-class computer, Ethereum has been using the Proof-of-Work consensus mechanism to ensure the security of the system since its birth. Various complex functions such as transactions, smart contracts, and accounts are also running on this core mechanism. With the continuous prosperity of ecological applications on Ethereum, the current infrastructure poses challenges to the scalability of the system, and the limitations of PoW severely restrict the future development of Ethereum. To solve the scalability problem, the team has proposed a series of network upgrade solutions.
The merger is the second network upgrade in the series. It combines the two existing independent blockchains in the ecosystem, the Ethereum mainnet, with the beacon chain, and realizes the switching of the consensus mechanism while retaining the original function of executing smart contracts and complete historical data and user status.

Figure 3-4: Schematic diagram of Ethereum merger
Source: Ethereum.org
After the merger, Ethereum has undergone corresponding changes in block structure, network structure, consensus mechanism and node type. The new block can be regarded as a combination of the beacon block and the original PoW block, in which the block fields related to the PoW consensus will be modified to 0 or constant accordingly; the network structure will adopt the "consensus layer + execution layer" architecture, and the consensus layer will coordinate and direct the execution layer to generate and synchronize blocks; after the merger, the types of Ethereum nodes will be richer. The addition of stateless nodes will not only help maintain the decentralization of the network, but also prepare for the future sharding architecture.
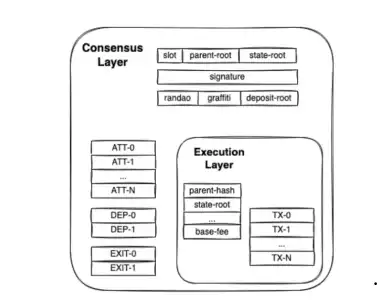
Figure 3-5: Schematic diagram of Ethereum blocks after the merger
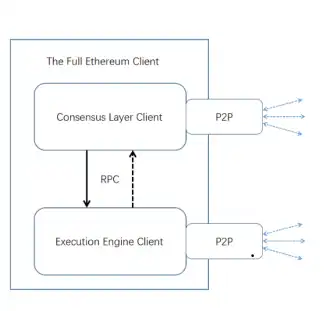
Figure 3-6: Ethereum client architecture after the merger
Source: Ethereum foundation blog Source: ethresearch.ch
The Ethereum merger is a major milestone in the cryptocurrency market: for Ethereum, the merger is a key step in improving performance, and the shift to the proof-of-stake mechanism provides the basic conditions for Ethereum's subsequent sharding expansion. Not only that, the issuance rate of ETH will drop significantly after the merger, and with the destruction of EIP-1559, ETH is likely to enter deflation in the future. For the industry, the merger means the end of the era of large-scale graphics card mining, and miners have to flock to alternative chains or withdraw. As Ethereum gradually makes up for its performance shortcomings, it will inevitably squeeze out other PoS public chain ecosystems in the future. From a deeper perspective, the merger is an important change for Ethereum to respond to the global call to reduce carbon footprint. Bitcoin's enduring popularity has allowed the industry to witness the robustness of the PoW mechanism, but it requires continuous operation of mining machines to repeatedly calculate until a hash value that meets the requirements is found, which consumes a huge amount of energy. After Ethereum transitions to proof of stake, global energy consumption will also be reduced by about 0.4% per year.
3.6 Tornado cash regulation triggers thinking and concerns in the crypto industry
On August 8, 2022, the U.S. Treasury Department's Office of Foreign Assets Control (OFAC) added Tornado Cash and its associated crypto wallet addresses to its "Specially Designated Nationals List" (SDN), prohibiting U.S. citizens from interacting with the protocol or any Ethereum addresses related to it. If they interact with addresses on the SDN list, the relevant people and entities will face penalties (Figure). According to Tornado Cash’s official Twitter, its protocol has been sanctioned by the following relevant agencies: - Tornado Cash GitHub page closed - Tornado Cash contributor account banned - USDC in Tornado Cash protocol - RPC request rejected by Infura and Alchemy - OFAC sanctions on Tornado Cash Source: https://home.treasury.gov/, Huobi Research The main reason for Tornado Cash’s ban is that the North Korean hacker group Lazarus Group used Tornado Cash to conduct large-scale money laundering, and helped launder up to 70 million illegal activities. 1 billion U.S. dollars, posing a threat to U.S. national security. The on-chain addresses included in the sanctions list have a total of $437 million in assets.
In response to the sanctions, a large number of service providers and DeFi protocols have banned access to Tornado Cash and blocked related wallets. Tornado Cash has also sparked a lot of discussion, including whether blockchain should be censorship-resistant and whether the cryptocurrency industry should cater to regulation. Ethereum core developers have also discussed in detail the response strategies for national regulatory reviews in a developer conference call. The Tornado Cash incident not only promotes people's deep thinking about the conflict between privacy and regulation, but also marks that global regulators have officially taken action against the Wild West of DeFi.
3.7 OP coin issuance leads the return of Layer2 craze
The biggest event in the Layer2 field this year is that the mainstream Optimistic Rollup protocol Optimism issued the token OP, which promoted its own and the overall growth of the Layer2 field against the market.
At the beginning of 2022, the growth rate of Layer2 slowed down. In order to attract users and stimulate growth, Layer2 protocols have shown their strengths. First, in April, the number one Optimistic Rollup protocol Arbitrum launched an ecological exploration activity called "The Arbitrum Odyssey", encouraging users to use on-chain projects to obtain NFT rewards. Users were enthusiastic, but because the activity was too popular and exceeded the preset capacity of the network, the activity had to be terminated. Subsequently, Optimism officially announced that it would issue the native token OP and announced the economic model. In early June, Optimism announced that it would use OP tokens accounting for 5.4% of the initial supply to create an incentive fund to fund builders and projects in the OP ecosystem. These measures helped Optimism's TVL (calculated in ETH) grow more than 4 times in half a year.

Table 3-3: Comparison of various data of the Optimism protocol
Source: L2beat, optimistic.etherscan.io, Huobi Research
Optimism is the first of the four Rollup groups to issue tokens, and its growth has set a good example for other protocols. On July 13, ZK Rollup team StarkWare published 3 articles in a row, announcing that its product StarkNet will issue native tokens, and introduced the application scenarios, issuance quantity and distribution of tokens, etc., and stated that the StarkNet network has minted 10 billion tokens, and a part of them will be allocated to the contributors and related investors of the StarkNet ecosystem.
So far, two of the four major projects have issued tokens or have clear plans. It is only a matter of time for the remaining two to issue tokens. zkSync has stated in its official user documentation that it will issue tokens. In order to consolidate its position as the leader, Arbitrum may not be able to not issue tokens.
In addition to issuing tokens, Layer2 is also continuously iterating on the technical level (explained in detail later). Arbitrum launched in August The Nitro network upgrade increased network throughput and reduced transaction costs. Optimism announced that it will launch a major upgrade, Bedrock, in Q4 this year to achieve Ethereum equivalence, shorten the deposit time from L1 to L2, and reduce transaction costs. StarkNet has implemented Rust-VM, greatly reducing the threshold for Rust language developers. The mainnet of zkSync 2.0 (only available to the team in the first phase) will be launched in November.
Layer2 protocols continue to improve performance and user experience through technical upgrades, and introduce more means through tokens to allow the network to capture value and incentivize developers and users. Looking back now, the time when Optimism issued tokens was the turning point of the overall TVL of Layer2 this year. After that, Layer's TVL increased by 63%, becoming one of the few areas that can still achieve growth in the bear market. This summer cannot be called "Layer2 Summer", but Layer2 has shown strong vitality. In the next summer, they may bring surprises. 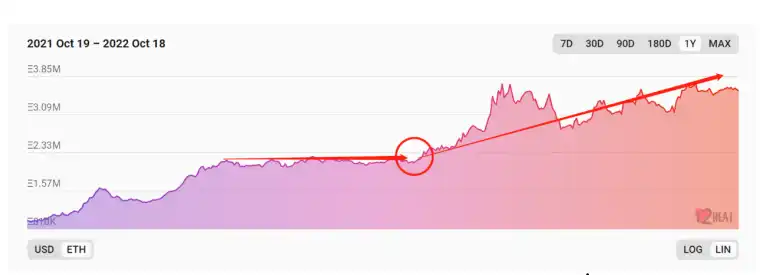 Optimism's issuance of tokens is the turning point of Layer2's TVL in a few years Source: L2beat, Huobi Research 3.8 After STEPN, X to EARN is over, where will GameFi go? With 1 million users and 4.72 million registered users and able to earn up to $122.5 million in profits in a quarter, STEPN can be said to be one of the most brilliant projects of GameFi and X to Earn in 2022. However, STEPN eventually fell into a bottleneck and entered a death spiral, which is the end of 2022. The craze of X-Earn has come to an end.
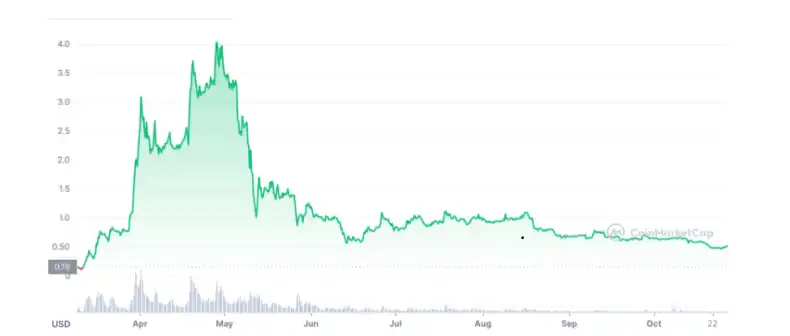
Figure 3-9: STEPN
Source: coinmarketcap.com
Encouraging users to walk to earn tokens is the core of STEPN. Since the launch of the game, STEPN has been favored by the currency circle and has attracted many new Web2 users, and soon there has been explosive growth. At its peak in May, STEPN had 700,000 active users, accounting for nearly 20% of Solana's daily unique paying users. After the peak in May, STEPN's active users fell sharply and new users continued to decrease.
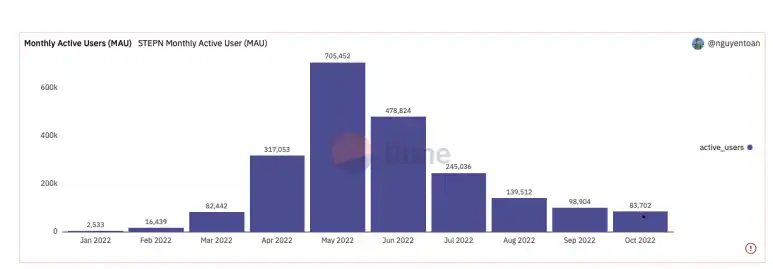
Figure 3-10: Number of active STEPN users
Source: Dune Analytics
The reasons behind STEPN's decline include the impact of the bear market in the cryptocurrency market and the crypto panic caused by the collapse of LUNA. In July 2022, STEPN announced the withdrawal of users from mainland China, which led to users selling their cryptocurrency assets related to STEPN. STEPN's utility token GST entered an uncontrolled supply expansion under the condition of falling demand, causing its price to plummet. STEPN opened a new model for X to Earn. The outbreak point that led to STEPN's rapid development and the problem of decline due to lack of sustained user growth also provided reference value for other X to Earn projects in the future.
3.9 The largest M&A case this year: Huobi acquisition
As the exchange with the largest market share in the Chinese market, Huobi was officially acquired by the M&A fund under Hong Kong Baiyu Capital at a valuation of US$3 billion in early October 2022. This may be the largest M&A case in the cryptocurrency industry this year.
Huobi Group was founded in 2013 by Li Lin. With the growth of the cryptocurrency market, Huobi Exchange's market share has gradually increased. After 2017, it became the exchange with the largest market share in the Chinese world. Its overall ecological layout is in a leading position in the industry, and Huobi University and Huobi Investment have a good reputation. Until 2021, Huobi, Binance and OK were regarded as the three giants of Chinese cryptocurrency exchanges.
However, in 2021, mainland China introduced the most stringent cryptocurrency regulatory policy among all countries in the world, including prohibiting mainland Chinese users from trading cryptocurrencies, prohibiting virtual currency mining in mainland China, and prohibiting companies registered in mainland China from engaging in virtual currency-related businesses. After the introduction of the regulatory policy, companies with cryptocurrency-related businesses, represented by Huobi, announced their withdrawal from the mainland market and turned their businesses to overseas. Before exiting, Huobi's average daily trading volume exceeded 60 billion US dollars, and its peak once exceeded 90 billion US dollars. After exiting, the market entered a bear market, and the average daily trading volume shrank to 5 billion US dollars, with a drop of more than 90%.
However, as an old exchange, Huobi still has a deep foundation and valuable assets. In addition to its own brand influence, Huobi holds compliance licenses in the United States, Hong Kong, South Korea, Japan and other places, and has Huobi Technology, a listed company in Hong Kong, which is still quite attractive to acquirers. Therefore, after many negotiations, Hong Kong Baiyu Capital announced the acquisition of all shares of Huobi Global held by Li Lin in early October.
About Capital Management is a Hong Kong asset management company founded in 2008 by Chen Yihua, who is also a partner of Jinglin Asset. After acquiring Huobi, About Capital announced the establishment of a global advisory committee to guide the strategic layout and development of Huobi Global. The list includes Chen Yihua, founder of About Capital, Du Jun, co-founder of Huobi, Sun Yuchen, founder of TRON, Wang Yang, vice president of the Hong Kong University of Science and Technology, and Leah Wald, co-founder of Valkyrie Investment. At the first general meeting after the acquisition, Sun Yuchen, as a representative of the advisory committee, announced several important measures, including empowering HT and strengthening the overseas strategy. In the following week, the price of HT rose by more than 80%, showing the market's recognition of this acquisition and Huobi's strategic adjustment. I believe that after completing this acquisition and strategic adjustment, Huobi will regain its glory in the future.
3.10 The United States and Europe start top-level layout, and comprehensive supervision is on the agenda
After the global cryptocurrency market experienced the last round of outbreak, the regulatory policies of governments represented by the United States and Europe have accelerated.
On March 9, 2022, US President Biden signed the "Executive Order on Ensuring Responsible Innovation in Digital Assets", which is the first-ever whole-of-government measure in the United States to address the risks and potential benefits of utilizing digital assets and their underlying technologies. The order formulates a national policy for digital assets covering six key priorities: consumer and investor protection, financial stability, illegal financing, US leadership in the global financial system and economic competitiveness, financial inclusion, and responsible innovation.
On September 16, the White House released the first draft regulatory framework for the cryptocurrency industry, which follows the executive order on digital assets, mobilizes the power of existing regulatory agencies such as the U.S. Securities and Exchange Commission and the Commodity Futures Trading Commission, and also stipulates the expansion of cooperation between the United States and its partners through the G7, G20, the Financial Action Task Force on Money Laundering (FATF) and the Financial Stability Board (FSB).
Figure 3-11: Bitcoin Regulation
Source: Allrecode.com/post/31774
On June 30, 2022, the President of the European Council and the European Parliament reached a provisional agreement on the Markets in Crypto Assets (MiCA) proposal. On October 5, the European Council approved the final text of the Markets in Crypto Assets regulation bill (MiCA). On October 10, the European Parliament Committee passed the MiCA bill with 28 votes in favor and 1 vote against. The next step is to approve the final vote on MiCA at the plenary session of the European Parliament. Once passed, it will take effect in 12-18 months. On October 10, members of the European Parliament also voted on the Transfer of Funds Regulation (TFR), an anti-money laundering bill that requires transfers using cryptocurrencies to include the identity information of the payer and the payee. Once these two bills come into effect, they will establish a unified crypto regulatory framework in the EU, becoming the most comprehensive crypto asset regulatory regulations in major jurisdictions around the world, and will also provide strong protection for service providers and investors engaged in crypto assets.
The crypto regulatory framework launched by the United States and Europe will have a huge impact on the global crypto market. The United States and the European Union will take the lead in establishing a unified crypto regulatory system, which can not only improve the regulatory efficiency and law enforcement in their own jurisdictions, but also provide a reference model for other countries' regulation.
4. Web3 Infrastructure
4.1 Ethereum's Breakout and Attack
4.1.1 Rollup
Rollup is a highly anticipated off-chain expansion solution. The main idea of Rollup is that users conduct transactions on Layer 2 (off-chain), and the Layer 2 operator compresses and packages the transactions, submits the compressed transaction data and the conversion proof of the off-chain state to the chain, and finally verifies it by the Ethereum mainnet (or other Layer 1 in the future). Due to the use of more efficient encoding methods and measures such as reducing the data that needs to be uploaded, the number of bytes required to store this batch of off-chain transactions on the Ethereum mainnet has decreased. At the same time, because the Ethereum mainnet does not have to recalculate off-chain transactions, the gas consumed by transactions is also greatly reduced. On the one hand, Rollup reduces the consumption of on-chain resources, and on the other hand, it can maintain the availability of data, that is, the Ethereum mainnet can view and ensure that no one can tamper with off-chain transactions. Therefore, it can inherit the decentralization and security of Ethereum while improving scalability, becoming the mainstream technical solution for Layer 2. Vitalik also said: "For Ethereum, Rollups is the only trustless scalability solution in the short, medium, and possibly long term."
Rollup has taken shape in early 2022 and has achieved counter-trend growth this year. According to l2beat data, on January 1, 2022, the overall TVL of Rollup was 1.56M ETH, about 4.5% of the TVL of the Ethereum mainnet. As of October 20, 2022, the TVL of Rollup has risen to 3.62M ETH, an increase of 131%, and the ratio to the TVL of the Ethereum mainnet has also risen to around 7.5%. The overall market conditions of the crypto market this year are not good. The price of ETH has fallen by 65% during the same period. It is not easy for Rollup to achieve growth in such an environment.
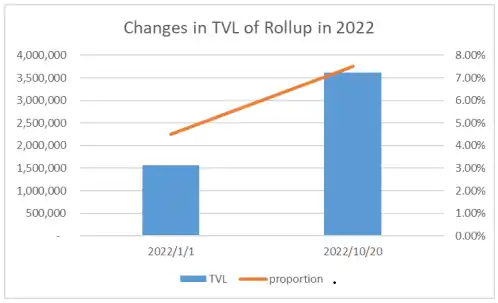
Figure 4-1: TVL changes of Rollup in 2022
Source: L2beat, Huobi Research
In terms of the number of project deployments, according to DeFiLlama data, as of the end of October 2022, there were approximately 210 projects deployed on Rollup (projects deployed on multiple Rollups are counted as 1 only), and 585 projects on the Ethereum mainnet. In this regard, the ratio of Rollup to Ethereum is 35.9%, a significant increase from 19.3% at the beginning of the year. Some people have previously speculated that if the gas fee of the Ethereum mainnet drops, the importance of Rollup will decrease. The fact is that this year, the price of ETH and the average gas price have both dropped, and the gas fee of the Ethereum mainnet will drop even more, but Rollup still attracts a large number of project deployments. This shows that many project teams are optimistic about the prospects of Ethereum and Rollup, and the "Rollup-centric" Ethereum network is slowly taking shape.
In terms of the number of addresses, according to the number of addresses published by the blockchain browsers of each Rollup, there are 4M Rollup addresses in total, which has quadrupled from the beginning of the year. The Ethereum mainnet has 209M addresses, and the number of Rollup addresses has increased from less than 1% of the number of Ethereum addresses to nearly 2%. Although growth has been achieved, there is still a long way to go in attracting users.
Rollup's counter-cyclical growth is mainly driven by its technological progress. This year, Rollup's progress is mainly in the five directions of improving compatibility, reducing data availability fees, reducing verification costs, decentralization, and developing zkEVM.
Improving compatibility
Because it is compatible with EVM and is more convenient for various projects to deploy, OP Rollup's capital sink accounts for more than 80% of the current Rollup. However, compatibility with EVM does not mean that the project can be deployed seamlessly, and they still need to make a lot of code adjustments. Improving the compatibility of EVM and narrowing the difference with Ethereum has always been the focus of OP Rollup.
Arbitrum One migrated to Nitro in early September, improving the compatibility of the network. The base layer of Nitro's client software directly compiles the core of Geth (the mainstream Ethereum client). Geth replaces the original Arbitrum customized EVM simulator to handle execution and state maintenance functions, ensuring that Nitro is highly compatible with Ethereum. After Optimism upgraded its EVM equivalence at the end of last year, it proposed "Ethereum equivalence" this year. It will be implemented in Bedrock, a major upgrade scheduled for Q4, which aims to minimize the differences with Ethereum so that Optimism can share and collaborate on the same core code. With stronger compatibility, the cost of project deployment will be lower, more Ethereum supporting tools will be available, and the network effect of the OP Rollup protocol will be stronger.
Reduce Data Availability Fees
Rollup fees are mainly divided into two parts, one is the data availability (DA) fee paid to L1, and the other is its own operating fee. Since Rollup is executed off-chain and the load is not large most of the time, the operating fee accounts for a relatively small proportion, and the DA fee accounts for a large proportion.
In order to reduce DA fees, each team has worked hard to improve batch processing and compression systems. For example, Optimism has reduced fees by 30% by setting more reasonable fee parameters, and it will also use more efficient compression algorithms to further reduce fees. In addition to these conventional means, Arbitrum has also launched a new product, Nova, which can reduce DA fees to the bottom line. Nova is built on Arbitrum's Anytrust technology. It uses the Data Availability Committee (DAC) to store and provide data off-chain, and only switches back to Rollup mode when users question the DAC. DAC needs to ensure that there are at least 2 honest committee members. Compared with the traditional BFT consensus that requires 2/3 of the total number of nodes to remain honest, its trust assumption is much weaker and much easier to implement. In essence, it uses a minimal additional trust assumption in exchange for lower costs and faster withdrawal times. Games and social projects are very suitable for deployment on Nova. Currently, nearly 10 projects are running on Nova. StarEX has also officially launched the Volition mode, and users can choose whether the original transaction data is stored on Ethereum or in the DAC according to the business type.
Reduce verification costs
OP Rollup relies on fraud proofs to resolve disputes. Fraud proofs are divided into one-round interactive and multi-round interactive. Previously, only Arbitrum used multi-round interactive fraud proofs, and all OP Rollups based on Optimism's code used one-round interactive proofs. Multiple rounds of interactive proofs continuously narrow the scope of disputes off-chain until a controversial execution step is found, and then the dispute is re-executed and arbitrated on-chain. This can reduce the on-chain resources needed to resolve disputes, and the cost is lower than one round of interaction. Optimism is developing a new generation of fraud proof Cannon, which is a multi-round interactive fraud proof. Other OP Rollups are likely to follow Optimism's upgrade, and the cost of OP Rollup to resolve disputes will generally decrease in the future. More importantly, Cannon will use MiniGeth (Optimism's simplified version of the Geth client) as an EVM simulator, which is essentially a decoupling of the Rollup solution from the main chain. On the one hand, MiniGeth can be upgraded to adapt to the upgrade of the EVM, and on the other hand, MIniGeth can be replaced with other tools to support other main chain virtual machines to implement the Rollup solution.
ZK Rollup relies on validity proofs (zero-knowledge proofs, ZKP) to resolve disputes. Unlike OP Rollup, it does not require interactive proofs, but generates ZKPs for all executed statements at once, and the verifier verifies the ZKP to determine whether the prover is honest. In order to improve the efficiency of verification, StarkNet upgraded the recursive STARK proof. This upgrade takes advantage of the "logarithmic compression" feature of STARK proofs, which means that the time required to generate a proof is roughly linear with the time required to execute the statement, while the time to verify the proof is roughly logarithmic with the time required to generate the proof. The original SHARP technology generated a total ZKP1 for multiple propositions to be proved. After the upgrade, the propositions will be divided into several groups, and a small proof will be generated for each group. These small proofs are then used as propositions to generate a total ZKP2. Due to the characteristics of logarithmic compression, verifying ZKP2 will be much faster than verifying ZKP1, and of course consumes much less computing resources on the chain. This move can also speed up the generation of proofs, because multiple small proofs can be calculated in parallel.
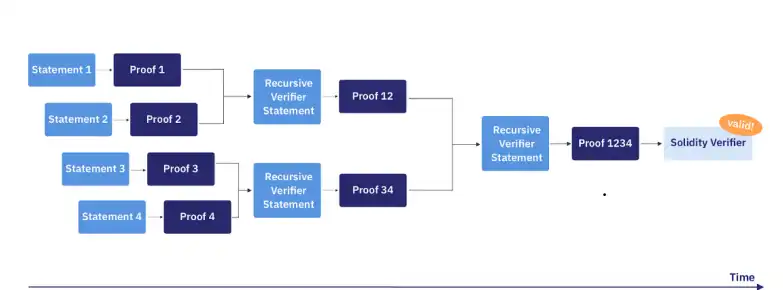
Figure 4-2: Recursive Stark Proof
Source: medium.com/starkware
Decentralization
An OP Rollup network experienced a downtime incident earlier this year, causing the network to be unavailable for several hours. The reason is that the Rollup protocol requires the use of a Sequencer to sort transactions, and currently the Sequencer is operated by the project team itself or a closely related single operator, which is very centralized. When the Sequencer fails, no other equivalent node can continue to run, so the network is paralyzed. Only by promoting the decentralization of the Rollup protocol can this gray rhino risk be eliminated.
Optimism attempts to build a multi-client ecosystem in the Bedrock version, working with external teams and incentivizing them to create other clients. Multi-client means that the Sequencer is naturally decentralized, and the risk of single point failure is reduced. This idea is relatively grand, and it is hard to say whether it can be realized. Legislate above and learn from it. If Optimism can implement the Sequencer It is also a major victory for the decentralization of Rollup. It is possible that when the new version runs smoothly, the condition for becoming a node is to stake OP tokens. This will give the tokens clearer application scenarios and sources of income, and may lead to the decentralized transformation of Rollup.
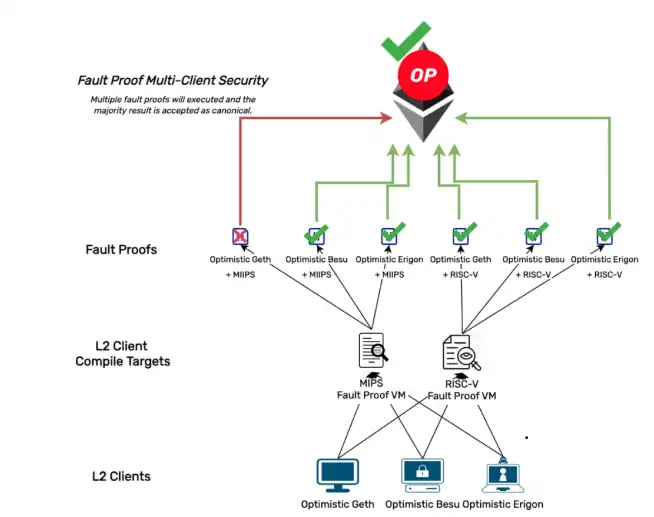
Figure 4-3: The multi-client ecosystem envisioned by Optimism
Source: optimismpbc.medium.com
Development of zkEVM
For the past two years, the focus of ZK Rollup development has been on the development of zkEVM. zkSync, Polygon, and Scroll are all actively developing and have announced that they will launch their versions of zkEVM on the testnet or mainnet by the end of 2022. At present, zkSync seems to have maintained its leading position. It launched the testnet in April and has achieved compatibility at the EVM bytecode level, completing the implementation in the circuit and in the execution environment. In terms of core infrastructure, full node integration has been completed, and compiled smart contracts can be successfully deployed and executed.
Recently, it has been repeatedly announced that the first zkEVM-compatible ZK Rollup running on the Ethereum mainnet will be launched on October 28 this year (it has been launched during proofreading). The team is confident and has also kept a backup plan. The version launched at that time will not deploy any projects. Only the official team can test it with real assets on the mainnet, and then developers will be allowed to use it. A number of well-known protocols and companies have announced that they will be deployed on zkSync 2.0, including Uniswap, Chainlink, OKX wallet, fiat currency deposit and withdrawal solutions Ramp and Banxa, decentralized crypto trading platform Hashflow, insurance protocol Nexus Mutual, etc. After opening to the public, the zkSync ecosystem may develop rapidly.
4.1.2 Ethereum Merger
The biggest upgrade of Ethereum itself this year is the merger. The purpose of the merger is to transform Ethereum's original POW consensus mechanism into a POS mechanism. With the transformation of the consensus mechanism, the network structure has also undergone profound changes, which has also affected the degree of decentralization of Ethereum.
After the merger, Ethereum adopts the consensus layer + execution layer (execution engine) architecture to generate and synchronize blocks. The user's transfer and smart contract call are packaged, broadcast and executed by the execution engine (the original ETH full node), and the tip part of the GAS fee still belongs to the execution engine. The task of the consensus layer is to first establish communication with the execution engine, requiring them to generate or verify ExecutionPayloads, and then the beacon node reaches a consensus based on it to generate a complete beacon block. After EIP-1559, the proportion of tips in revenue has dropped significantly, and the main income of miners comes from block rewards. After the merger, running the execution engine independently can only get tips, which is difficult to make a profit. The execution engine needs to be attached to the consensus node and rely on staking rewards to obtain income.
So it seems to be a fusion of two networks, but it is better to say that the consensus layer will absorb the execution engine to form a new symbiosis. POS Ethereum has 450,000 validators, while POW Ethereum has only more than 10,000 nodes. The substantial increase in the number of validators can also improve the decentralization of the network. Of course, a large number of GPU miners cannot be absorbed, and they have to find a way out, which will be mentioned later.
Ethereum has always had the problem of state explosion, that is, the network accumulates more and more data, and the storage space required is also increasing. This will make the hardware burden of the nodes heavier and heavier, and they have to become centralized. For this reason, the community has proposed a stateless goal, hoping that light clients can verify all transactions and states without actually storing any state. After switching to PoS, Ethereum must achieve statelessness, allowing nodes with all states and stateless nodes to participate in verification work together, and maintain a high degree of decentralization of the network. With stateless technology, there will be 3 types of nodes (clients) in the merged Ethereum consensus layer:
1. Clients without ETH1 execution engine
2. Clients with stateless ETH1 execution engine
3. Clients with full-state ETH1 execution engine
Type 1 clients are the lightest clients. They can only participate in consensus and cannot verify transactions at the execution layer. Its significance lies in supervising other types of nodes at the consensus layer. Type 3 clients have all the states, execution capabilities, and consensus capabilities, and can be understood as full nodes. It requires hardware for storage and computing and staked tokens, so the cost is also high and the number will not be large. Type 2 nodes are stateless nodes that can request data from Type 3 nodes and then use their own execution engines to verify the validity of transactions.
One of the questions raised after the merger of Ethereum is the degree of decentralization of the network. While the aforementioned changes in network structure and statelessness can increase the centralization of the network, the rapid growth of staking solution Lido has caused concern. Lido is a large staking solution that accounts for more than 1/3 of the total amount of stake in the network. Some people believe that if Lido manages to gather another 1/3 of the stake, it will be able to control the network. It is important to note that Lido is not controlled by a single entity. There are 30 node operators within Lido that are not affiliated with Lido. They are all top node operators with a proven record and legal recourse. They need to pass the DAO vote to be eligible to operate and are under the supervision of the DAO. Therefore, Lido cannot be equated with centralized mining pools. On the contrary, it is precisely because of Lido's continuous efforts in decentralization that it has gradually gained the upper hand in the competition with CEX mining pools. Therefore, the risk of a large single entity/consortium controlling the network is not as great as imagined.
Where will Ethereum go after the merger? V God recently said in an interview that Ethereum developers hope to achieve four key goals next year, including scalability, privacy, base layer anti-censorship and account abstraction, among which solving scalability is their "first priority". The Ethereum team believes that expansion will be achieved through Rollup, so the plan after the merger is to become a strong settlement and data availability layer, allowing Rollup to run safely and at low cost. Regarding the future development of Ethereum, we will explain it in the top ten predictions.
4.2 The road to public chain breakthrough
One of the biggest problems that public chains generally face in technology is expansion, and it is constrained by the blockchain impossible triangle (decentralization, scalability, security). Monolithic chains try to improve performance by adjusting block size, but they still cannot avoid on-chain congestion, high gas fees, and excessive centralization. To break through the impossible triangle, the current methods are:
1. Optimize the consensus algorithm and improve the consensus efficiency (POS or NPOS mechanism, the final determination tool), which is essentially a trade-off between decentralization and security;
2. Optimize the execution environment to process transactions in parallel, rather than processing one transaction at a time like EVM;
3. Modularization.
4.2.1 Modularization
The future form of the public chain cannot avoid a revolutionary topic - modularization. Modularization is to split a complex system into multiple independent sub-modules. Each sub-module has independent logic and functions, and then assembled to form a whole, thereby realizing the full functions of the complex system. Modularity has the following advantages: 1. During the development phase, each submodule can be developed or outsourced at the same time to improve efficiency; 2. Each module can work independently, which is conducive to isolation when problems arise; 3. Pluggable, each module can be combined with each other to achieve different functions.
The development of blockchain architecture has gone through three stages. That is, from the traditional monolithic blockchain, to the separation of the execution layer and the consensus layer (Layer2), to the current separation of the data availability layer (Celestia and Polygon). Modularity is an inevitable trend in the development of public chains. This can be explained from two aspects: 1. The limitations of the single chain; 2. The impossible triangle of the blockchain. The limitations of the single chain are actually more obvious. For example, Solana needs to complete the tasks of developing the underlying infrastructure, maintaining network security by itself, and building the upper-level ecosystem. If the public chain is not EVM-compatible, the difficulty of ecological construction will be greater. In addition, the single chain is slightly inferior in cross-chain cost and composability. As for the Cosmos and Polkadot ecosystems, they have unified modular tools at the consensus layer and cross-chain. Since they do not have to stick to repetitive work, public chain developers can focus more on economic model design and innovation at the application layer.
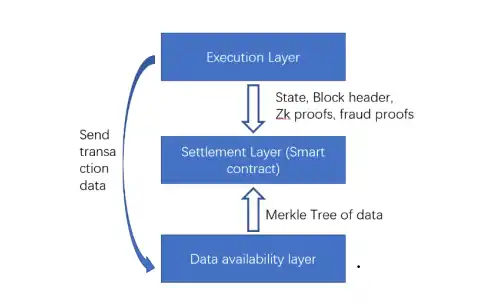
Figure 4-4: Modular architecture of public chains
Source: Huobi Research
Currently, public chains including Ethereum have been moving forward on the modular technology route. The modularization of the consensus layer is represented by Cosmos's Tendermint and Polkadot's Substrate, which mainly provide modular tools for the consensus layer and the communication layer. The separation of the execution layer is represented by Ethereum Layer2, but Layer2 does not belong to the blockchain. They are Ethereum's expansion components, responsible for executing transactions and putting the results on the chain. The separation of the data availability layer is represented by Celestia and Polygon Avail, which are currently independent public chains that can achieve data availability. Data availability can also be solved by sharding technology. ETH2.0, Near and Polkadot all use different sharding technologies to achieve this. The purpose of these technologies is to maximize performance on different modules, and each architectural layer can be further expanded and optimized without destroying the decentralization and security of the main chain.
From the above modular implementation mechanism, Celestia, a modular public chain, has a more innovative design concept. It focuses on dealing with data availability issues of other chains, and Layer2 is built on it as an execution layer. The development of independent data availability models is also being replicated, such as Polygon Avail and zkPorter.
From the perspective of technical implementation and on-chain data, these modular technologies are in the early stages. The public chain that is purely related to modularization has relatively weak on-chain ecology and TVL. However, due to the fact that there are still many problems to be solved in sharding technology, such as "cross-chain" interaction and verification between shards, Rollup is at least Ethereum's expansion solution for a long time. There is still time and space for modularization to continue to develop.
In general, modular blockchains may have more possibilities in cross-chain, not only limited to cross-chain assets, but also easier to achieve ecological composability, but this may lead to risks similar to Terra. Both sharding technology and Celestia are still in the early stages of development, and the actual impact on the industry will not be known until they are launched. But we can predict the situation of public chains in the next bull market. ETH2.0, relying on sharding, may become the infrastructure of the settlement layer and data layer of its ecology. With the cooperation between Evmos and Celestia, Rollup will not only be limited to Ethereum, but may also become the execution layer of other chains. Even if Ethereum implements sharding, Celestia has usage scenarios. The topic of the next public chain narrative is still focused on how to break the impossible triangle.
4.2.2 Development of Multi-chain Networks
Multi-chain networks are mainly built on the same development framework and modular tools. Multi-chain networks have been developing for at least 6 years. Currently, there are Cosmos, Polkadot, BNB Chain, Avalanche, Octopus, and Polygon in the future. These blockchains can provide modular tools for their subnets/zones/parallel chains, but they differ in shared security and cross-chain. The advantages of multi-chain networks are: 1. It provides modular tools for developers; 2. Security, fast confirmation and more composability on cross-chain; 3. Each sub-chain undertakes its own execution and application, forming a DApp dedicated chain to provide better performance.
(1) Cosmos opens the next era
Cosmos is a first-tier, established public chain project in the multi-chain network. With the establishment of Evmos, the rise of multi-chain networks and modular concepts, and the holding of the Cosmoverse conference, Cosmos has been a hot topic. Thanks to the flexibility of Cosmos modular tools and the upgrade of cross-chain technology, many projects have chosen to build chains in the Cosmos ecosystem. Currently, there are more than 263 projects in operation, with a total market value of US$11.7 billion. According to Map of Zones, there are currently 51 links connected to the IBC cross-chain technology, with a 24-hour IBC transaction volume of $26.37 million (data from October 24), and 155,800 transactions. Cosmos' 24-hour IBC transaction volume and transaction amount ranked first among mainstream cross-chain projects, surpassing Multichain, Stargate, Celer cBridge, etc. It is precisely because of the cross-chain ecological characteristics of Cosmos that the prosperity and demand of the cross-chain ecology far exceed other projects.
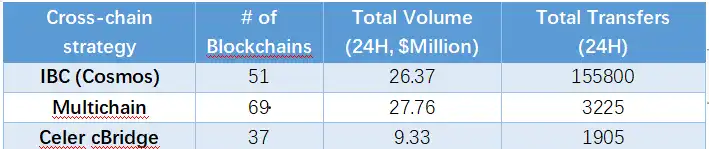
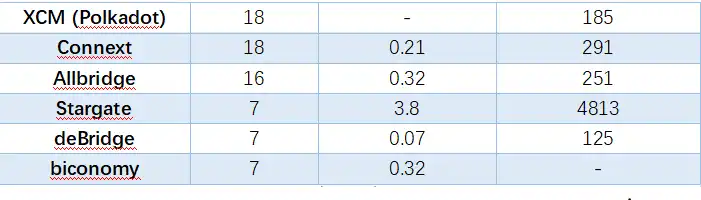
Table 4-1. Some data for crosschain bridges in 24H (Oct.24, 2022)
Source: Huobi Research
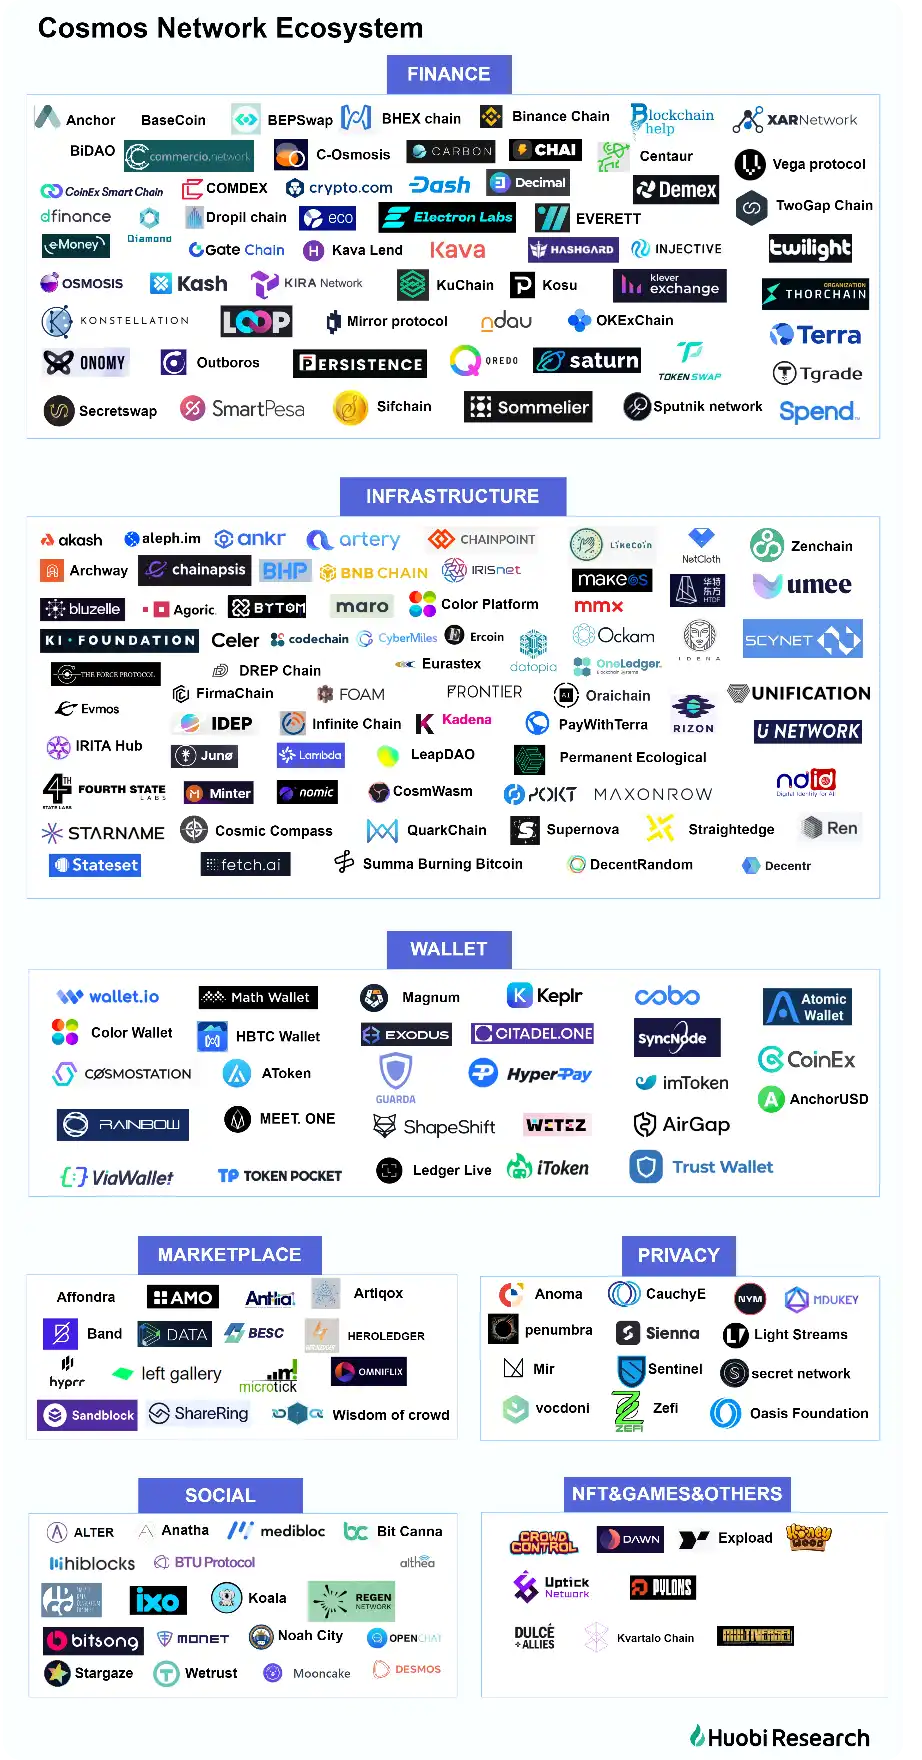
Figure 4-5: Cosmos Network Ecosystem
Source: Huobi Research
Even though it has performed well in multi-chain network projects, Cosmos has always had two problems: 1. The technology upgrade is relatively slow. In 2022, it mainly focused on the technical upgrade of IBC, and inter-chain accounts and inter-chain security have not been launched; 2. The role of Cosmos Hub in the entire ecosystem has not been clear, resulting in low value capture of $ATOM. From the perspective of the number of on-chain addresses, the number of daily active addresses of Cosmos Hub has basically remained above 10,000 since January this year. However, public chains such as BSC, Ethereum, Solana, and Polygon are all above 300,000. Compared with major Layer2 projects, its number of active addresses is almost the same as Optimism. Currently, the network staking rate of Cosmos Hub is almost maintained at a safe state of 66%, with 175 active verification nodes, the annual inflation rate of $ATOM is 12.81%, and the overall annualized staking return is approximately 18.94%.

Figure 4-6: Daily active addresses of major public chains
Source: Artemis, Huobi Research
The Cosmoverse conference held on September 26 brought new vitality to the industry. The most important part of the conference was the release of the Cosmos Hub 2.0 white paper, which will try to solve the existing problems of Cosmos from three aspects: (1) It launched four major functional modules: inter-chain security, liquid staking, inter-chain scheduler, and inter-chain allocator, redefining the new role of Cosmos Hub as the center of the ecosystem; (2) Redesigned the economic model to solve the problems of $ATOM inflation and insufficient application scenarios, and provided funds for the sustainable development of the ecosystem; (3) Established a more reasonable and orderly governance DAO to support the implementation of the above two new solutions.
Whether Cosmos Hub 2.0 will bring the expected effect will not be shown until next year. However, dYdX has announced that it will migrate to Cosmos as an independent chain, and Delphi has published a document that it will research and develop the Cosmos ecosystem. There is still a lot of room for imagination in the future development of the Cosmos ecosystem.
(2) Where will Polkadot go in the future?
As a multi-chain platform, Polkadot's parachains are slow to go online compared to Cosmos, and have not attracted the attention of users and capital. Currently, there are 297 validators in the Polkadot network, the network staking rate is also maintained at around 55%, and the inflation rate of the token $DOT is 7.61%. There are currently more than 179 Polkadot ecosystem projects. Polkadot's total market value has reached US$7.5 billion, ranking 11th among cryptocurrencies. There are only 18 chains connected to the XCM cross-chain technology. According to the on-chain data of Subscan, the number of daily active addresses of Polkadot is around 1,200, while the daily active addresses of many other parachains are only in the double digits. Compared with user activity, developer activity has increased this year compared to last year, and developer activity in September hit a record high.

Figure 4-7: Polkadot Ecosystem Parachain
Source: Subscan

Figure 4-8: Polkadot Developer Activity
Source: santiment
Compared with Cosmos, Polkadot has a certain gap in users, ecology and project market value. There may be multiple reasons:
(1) Cosmos launched its mainnet in March 2019, and its ecology developed earlier. In May 2021, IBC It was successfully launched, and at the same time, it caught up with the flourishing public chain ecology, and successfully achieved a major explosion in the Cosmos ecology. Polkadot launched its mainnet in May 2020, and XCMP was not launched until May 2022. The imperfections of early development tools and infrastructure also caused Polkadot to miss the opportunity of the 2021 ecological explosion.
(2) Compared with Polkadot, Cosmos has a lower threshold for developers to enter the ecology. Projects do not need to stake DOT auction slots to participate in the development of ecological projects.
(3) During the market upswing in the past two years, staking Cosmos to receive a large number of airdrops from ecological projects also allowed many users to enter the Cosmos ecosystem, thus forming a certain wealth effect.
In addition, Polkadot may face a more difficult situation. As its founder Gavin Wood resigned from the position of CEO of Parity Technologies. In the case that Cosmos has begun to develop shared security technology, whether Polkadot can give more flexibility in the slot auction mechanism, or whether there will be more technological and model innovations in the future, is one of the ways for Polkadot to find a way out of the encirclement of new public chains.
4.2.3 New technologies, new expectations
The blockchain industry is in its early stages, and there is huge room for development of public chain infrastructure. As the performance requirements of ecological applications for the underlying infrastructure continue to increase, public chains using new technologies are also constantly being nurtured. The most eye-catching in the second half of this year are the Diem-based public chains Aptos, Sui and Linera. Their technical objectives and innovations are also centered around the blockchain impossible triangle. In the Diem-based public chains, the main focus is on programming languages, parallelization and consensus mechanisms to improve the performance, security and development friendliness of the public chains.

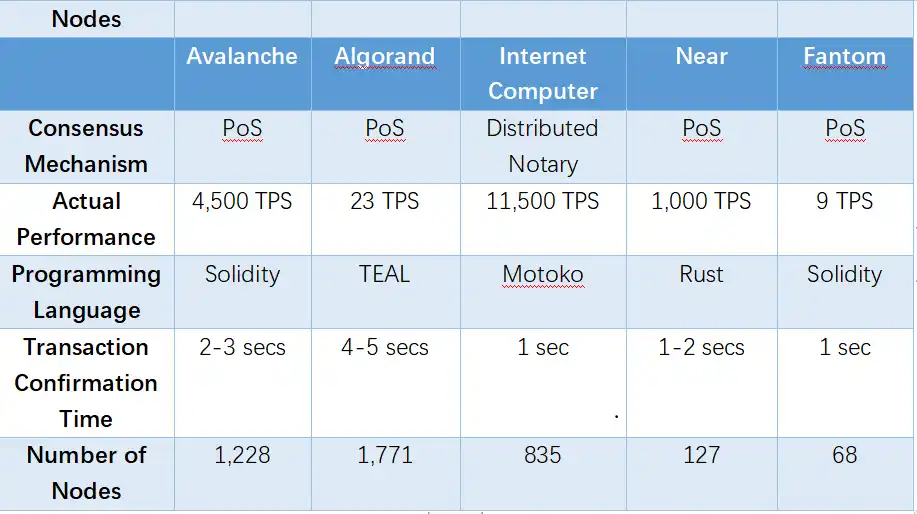
Table 4-2: Public chain performance comparison
Source: Huobi Research
(1) Consensus mechanism
The consensus mechanism has gone through the glorious period of the PoW chain led by the Bitcoin network, and the new era of the PoS chain after the Ethereum merge. At present, most public chains have adopted the PoS mechanism that was born in 2012. In addition to PoS, in order to improve block efficiency and maintain network security, other innovative consensus mechanisms have also been born, such as Solana's PoH and Avalanche's avalanche consensus.
Performance at the consensus layer is the efficiency, economy and security of consensus, which is mainly determined by the algorithm. At present, there are many achievements in the PoS consensus algorithm, such as PBFT, HotStuff, DUMBO, Algorand, which can theoretically achieve relatively high TPS.
Both Aptos and Sui continue the DiemBFT consensus, and have made improvements based on the HotStuff consensus. One of the improvements is the addition of a memory pool, which is equivalent to adding an actual storage layer, similar to Solana. This change greatly improves the performance of the system. In addition, Aptos changed the block structure and reduced the bandwidth required to reach consensus.
(1) Aptos block structure
(2) Traditional block structure
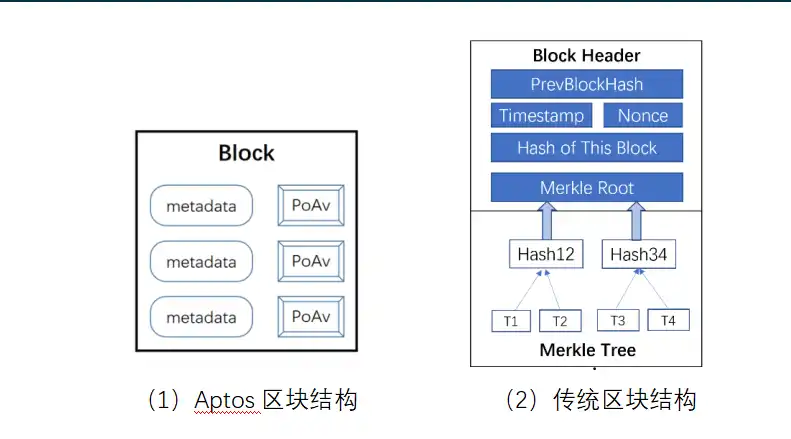
Figure 4-9: Comparison between Aptos block structure and traditional block structure
Source: Huobi Research
Sui's consensus mechanism is its biggest highlight, with breakthroughs in both innovation and solving performance problems. Although both Aptos and Sui are variants of HotStuff BFT, Sui has modified the transaction memory pool in DiemBFT to allow transaction broadcasts to be directly performed in the memory pool. At the same time, a global random coin called Tusk is used to achieve asynchronous consensus. Consensus enables Sui to have faster transaction speeds, low latency, and better scalability.
The innovation of the consensus mechanism by Aptos and Sui is invaluable in the new public chain, and it has also paid a lot of research and development costs. Innovative consensus mechanisms and final deterministic algorithms are very challenging tasks for building public chains. It is difficult to surpass predecessors, and whether the improvements made on them can achieve exponential performance improvements is still unknown.
(2) Programming language
Ethereum uses virtual machines and the Solidity programming language to implement smart contracts, which is one of the fundamental reasons for the last bull market. However, due to Solidity's lack of support for concurrency and low security, many blockchains have begun to use Rust or build new programming languages. Aptos and Sui use the Move language. The following figure briefly compares the characteristics of the three programming languages Solidity, Move, and Rust. In comparison, the Move language performs well in security, parallelization, and development friendliness.
Security: Move provides comprehensive security protection for smart contracts from the aspects of language design, virtual machine, contract calling method, and specific contract execution.
Parallelization: Move has made a special definition for digital assets, classifying and identifying transactions, and combined with a multi-threaded execution engine, transaction data can be run and processed simultaneously.
Development-friendly: Move lowers the development threshold and reduces complexity. It only takes 1-2 days for experienced developers to get started with Move; for developers without smart contract programming foundation, it only takes 1-2 weeks to learn Move from scratch.
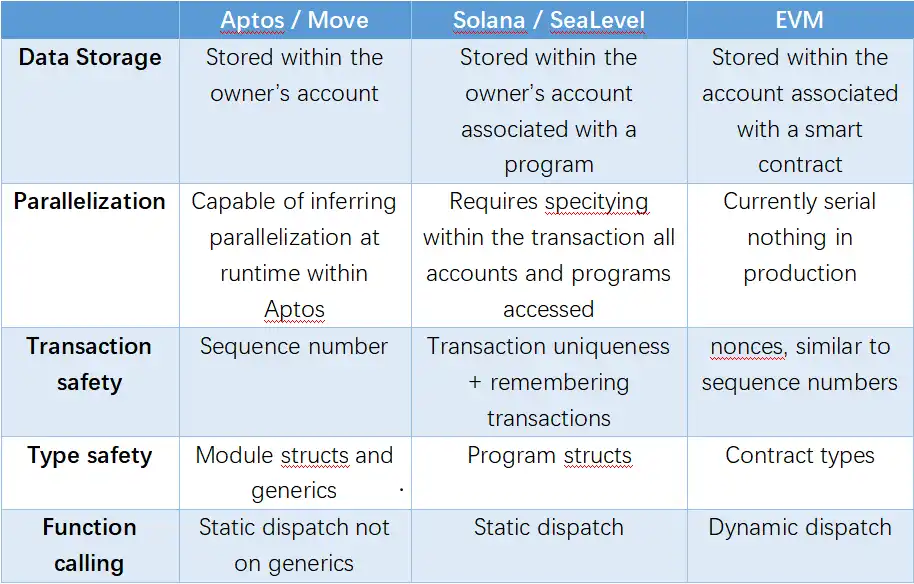
Table 4-3: Comparison of different programming languages
Source: Aptos, Huobi Research
(3) Parallelization
Parallelization is a very systematic solution to the scalability problem, which needs to be considered from the aspects of programming language, virtual machine, underlying architecture, consensus algorithm, etc. Parallel computing is already a very mature technology in web2, but it is just getting started in the blockchain field.
The new public chain uses the Block-STM (Software Transactional Memory) parallel execution engine to execute transactions in the parallelization scheme. It executes unrelated transactions on different cores on the same CPU at the same time, and maximizes parallelism by implementing multiple instruction streams and multiple data streams for transactions. Aptos and Sui have slightly different processing methods to support parallel computing. For example, Sui classifies transaction objects and combines DAG and BFT consensus.
Parallel computing is not only reflected in the increase in TPS, because existing smart contracts are only suitable for serial execution, such as AMM and NFT casting. In the future, to exert the power of parallel computing, smart contracts need to be more in line with the characteristics of parallel computing in terms of algorithms. This requires developers to transform their thinking, develop better ecological applications, and give full play to the advantages of parallel public chains.
From the innovative model of the Diem public chain, we can see that:
(1) Smart contract programming language plays an extremely important role in security, parallelization and developers;
(2) Parallelization is the right path for the determinism of future public chains;
(3) Most of the consensus mechanisms are based on BFT transformation, and the innovations based on the consensus mechanism are small algorithm improvements, so the room for improvement may have reached the ceiling level.
In addition to the Diem public chain, the biggest expectation for the upgrade of traditional public chains is sharding technology, among which there are three representative projects, namely ETH2.0, Polkadot, and Near. The differences between these three projects are mainly reflected in three aspects: 1. The random allocation method of sharding validators and the consensus protocol algorithm; 2. ETH2.0 adopts a homogeneous sharding scheme, and Polkadot adopts heterogeneous sharding; 3. ETH2.0 uses fraud proofs or ZK-SNARK proofs to achieve higher security of sharding node sampling. Sharding technology does not seem to have made any progress this year, and due to its difficulty in implementation, it may take several years of research and development time. Whether more innovative technologies will be applied to public chains in the future is something the entire industry should look forward to.
4.3 Web3’s Data Base: The Development Trajectory of Storage
4.3.1 Current Status of Storage
Storage is one of the earliest and most popular infrastructures. The earliest decentralized storage solutions, Storj and IPFS protocol, were launched in 2017. Some people put storage, computing and consensus as the three pillars of Web3, which shows the fundamental role of storage.
However, the original intention of designing blockchain was not to use it to store large amounts of data. In order to combine the decentralized characteristics of blockchain with the requirements of storing the ever-expanding amount of data, various project teams have made various designs and practices in terms of data storage format, replication method, tracking method, storage proof, etc., forming two major technical routes, namely, storage solutions based on blockchain networks and storage solutions based on P2P networks.
The principle of storage based on blockchain network is relatively simple, and the processed data exists in the block. Arweave is a typical representative. It is not completely a blockchain structure, and the network does not require nodes to store every block. But its SPoRA consensus mechanism requires that if a node wants to generate a block, it must be able to access the historical blocks randomly set by the network. In order to increase the probability of generating a block, the node will store more historical blocks and keep them permanently stored. A typical representative of storage based on P2P network is Filecoin. The user's files are stored in the nodes of the P2P network (IPFS) rather than on the blockchain. These P2P nodes are also nodes of the Filecoin blockchain network, which rely on the replication proof PoRep used to indicate the storage of a specified number of copies and the time-space proof PoST used to indicate the continuous storage of data to prove that they have completed the storage task. In addition, there is also an aggregated platform storage solution, which can be regarded as a combination of the above two solutions, represented by ColdStack and Stratos. They will use other protocols to find the most appropriate way to complete the storage.
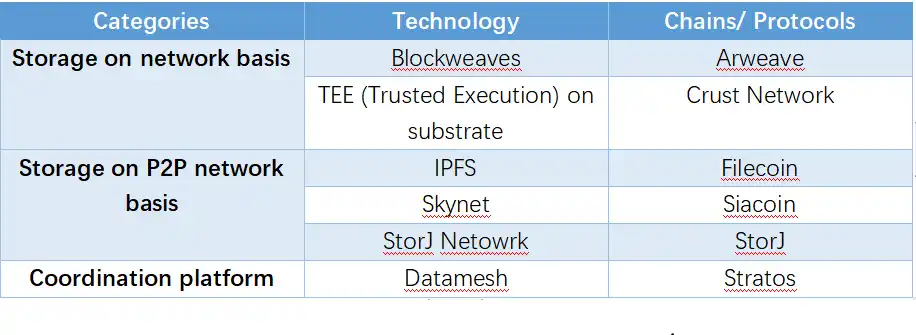
Table 4-4: Technical classification of mainstream storage projects
Source: Huobi Research
The storage track was greatly affected by the overall environment of the crypto industry in 2022, showing a state of slowing growth. The following table shows the data of several mainstream storage protocols in 2022. In terms of available storage capacity and actual storage capacity, Filecoin is still far ahead. Filecoin's storage capacity has entered a stable growth stage, and its storage capacity has increased by 15% in the first three quarters of this year. Although it is still growing, it is not as bright as the high growth rate of 52% in the second half of last year. Its highlight is that the actual storage capacity has grown steadily. By the end of the third quarter, 210.8 PB of data had been stored, more than 7 times the beginning of the year. The storage space utilization of other protocols has also increased, but it is still at a low level, which shows that decentralized storage is still in a very unimportant position in the overall storage market. Sia's high utilization rate is mainly due to its stagnant storage capacity growth and high data redundancy. The principle of Arweave storage is different from the others, so the utilization rate cannot be compared horizontally. Due to the decline in token prices, the storage fees and revenues of various protocols have dropped significantly. Compared with the price of centralized cloud storage of about $0.0007 per GB per month, most protocols still do not have cost advantages. The number of Arweave nodes has dropped by more than 60% compared with the same period last year, while other protocols have increased slightly. In terms of ecological construction, due to the different calculation methods of each company, the data may be biased. Overall, there are not many projects built on or cooperating with storage protocols, which once again reflects that storage has not yet gained more applications.

Table 4-5: Summary of data of some mainstream storage protocols
Note: 1 EB= 1000 PB, 1 PB= 1000 TB, 1 TB= 1000 GB. It is difficult to obtain multi-dimensional data for other storage protocols, so they are not listed.
Source: messari.io, filecoin.io, arweave.org, sia.tech, crust.network, Huobi Research
4.3.2 Storage + Computing
Although the data shows that storage development is not smooth, the storage field is still undergoing upgrades and innovations. The first upgrade is to add computing functions. At present, most storage solutions only realize the function of "decentralized hard disk", which meets the most basic needs, but there is no storage-based computing function. Although the crypto industry has several "global computers", this computing is not the same as that computing. Storage-based computing mainly includes local development environment rendering, data stream insertion and extraction, etc. These are the most commonly used and necessary functions of Web2 applications.
In order to introduce programmability into the distributed storage network and release more value and potential, Filecoin proposed the concept of FVM (Filecoin Virtual Machine) and successfully launched it in the Filecoin v16 Skyr upgrade in July this year. FVM is a multi-language, WASM-based execution environment that will add smart contract deployment capabilities to the Filecoin network. The first phase has been implemented, which means that the core logic of the Filecoin network can be run in FVM, which is implemented in the built-in smart contract (Filecoin calls it actor). The second phase is of greater significance, when users will be allowed to deploy custom logic to the network, and Filecoin will realize the vision of "smart contracts + provable storage". At this stage, FVM must also complete compatibility with EVM, so that it can utilize the existing smart contracts and EVM tools in the Ethereum ecosystem such as Hardhat, Foundry, Remix, Truffle and MetaMask. In addition, Stratos is trying to provide a more complete and comprehensive solution, including multiple modules such as database storage, static storage, computing and consensus. It divides the network into three layers, among which the resource layer, in addition to providing storage functions, will also serve as a general computing platform and provide various application-oriented function call interfaces.
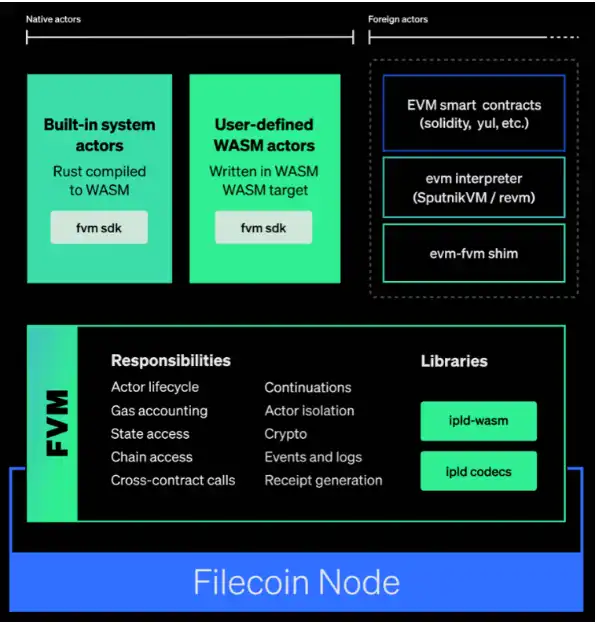
Figure 4-10: Complete FVM
Source: filecoin.io/blog
4.4 Foundation of the application layer: the prosperity of domain names
In Web3 In the world of Web3, all kinds of wallet addresses are composed of a string of characters. For more friendly identification and dissemination, the domain name system was born. The domain name can be linked to the wallet you use, that is, you can directly use this domain name to replace the wallet address, which brings more convenience to users and reduces transaction errors caused by entering the wrong address. As the leader of the DID track in the Web3 world, the importance of domain names is self-evident.
As early as 2017, ENS, a pioneer in the domain name track, was launched on Ethereum. It has now developed into the project with the largest market share. It is far ahead in both quantity and quality. It can even be said that the prosperity of domain names in 2022 is actually the prosperity of ENS. As of the date of writing, the market value of ENS domain names has reached 96 million US dollars (about 52,720 ETH), accounting for 90% of the entire domain name track. The .sol domain name on the Solana chain and the multi-chain domain name service provided by Unstoppable also have a small share, $5.8M and $4.17M respectively, accounting for less than 5%. The remaining domain name projects account for a small proportion. In terms of the number of registrations, the gap between the projects is not as large as the gap in market value. If the right strategy is adopted, other projects can still gain room for development.

Table 4-6: Overview of public chain domain name systems
Source: Huobi Research

Figure 4-11: ENS NFT price and transaction volume
Source: nansen
ENS domain names have experienced explosive growth this year. From the perspective of the transaction distribution throughout the year, the entire market reached its peak in April and May. After a brief period of silence (a series of crashes occurred in the crypto market from April to June), it returned to the hot again in September and October, with the daily transaction amount quickly reaching 12 million US dollars/day.
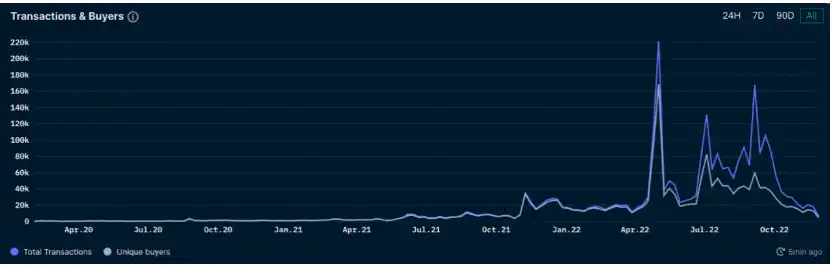
Figure 4-12: ENS transaction in the past year
Source: nansen
In August-October, ENS domain name transactions occupied the top five of Opensea's transaction list for a long time, and it was the most dazzling light in the bear market throughout the year. Driven by the ENS domain name, other public chain domain names, such as ".apt" domain name, ".bnb" domain name and ".bit" domain name have given their own sales plans and roadmaps. It has become the hottest event in the domain name track in the second half of the year.
4.4.1 Reasons for the popularity of domain names
There are many reasons for the popularity of domain names, but the most fundamental ones are three.
First, the most fundamental reason for the popularity of domain names is their own scarcity. Once a specific domain name (especially three-digit and four-digit) is registered, the second person can no longer continue to register and use the domain name. People who are familiar with Internet domain names know that when Internet domain names exploded around 2000, the more scarce the Internet domain name, the greater the subsequent premium. Domain name investors in the blockchain field are already familiar with the history of the Internet domain name explosion that year, so this historic opportunity will definitely not be missed.
Second, the innovative model of blockchain domain names provides an inexhaustible driving force for the popularity of domain names. Traditional domain names are resolved through centralized DNS servers, while blockchain domain names are resolved through on-chain smart contracts, which are decentralized and the domain name assets are highly protected. Through the on-chain contract, the blockchain domain name resolves the wallet address, personal web page, avatar, Twitter account, email, etc. The scope of use is wider and more extensible. At the same time, as an NFT, it can participate in various on-chain transactions and on-chain ecology together with other categories of NFTs. In addition, the subdomains derived from the NameWrapper function can be transferred and resolved separately, which also makes ENS domain names more attractive than traditional domain names.
Third, the continuous narrative relay has pushed the popularity of domain names to a climax. Starting from the hype of 3D (three-digit domain names) and 4D, concepts such as 5D, 6D, emoticons, surnames, Web3 moments, and country codes have been born one after another. A category of domain names represents a category of narrative, and it is this narrative relay that constantly pushes domain names from one story to the next. At the same time, the continued promotion of some well-known KOLs on Twitter (such as Nick.eth, 139.eth) also added more social attributes to the narrative, and the domain name continued to go viral, becoming a bright star in the entire NFT trading market in 2022.
Due to its own scarcity, the popularity of domain names is expected to continue, and new records will continue to be set in the future. The popularity may occasionally decline for a period of time, but the hot wave will continue.
4.5 Cross-chain bridge: rise and crisis
4.5.1 Market conditions and development trends
4.5.1.1 Market conditions
With the flourishing of the public chain ecosystem since 2021, a variety of public chains and Layer 2 networks have developed rapidly. According to statistics from Blockchain-Comparison, there are now at least 126 Layer 1 and layer 2 blockchains. The demand for cross-chain interaction is growing rapidly, and cross-chain bridges have become one of the important infrastructures on the current chain.

Table 4-7: Locked volume of top cross-chain bridges
Source: debridges.com
Due to the large differences in the underlying architecture of each Layer 2 and public chain network, the difficulty of implementing cross-chain interoperability is still relatively high. At present, cross-chain bridges mainly play the role of a bridge for cross-chain assets, providing services for the circulation of tokens between different networks. Cross-chain assets cannot truly achieve cross-chain, but refer to the casting and destruction process of native assets on another chain, or the exchange of native assets and cross-chain assets. At present, the technical solutions of cross-chain bridges are mainly implemented through three categories, such as lock-up + casting/destruction, liquidity pool and atomic exchange. In terms of cross-chain mechanism, cross-chain is mainly achieved through three methods: native cross-chain, external verification and atomic exchange. The external verification scheme has low deployment cost and fast response capability, and is currently the most mainstream cross-chain bridge usage mechanism. However, its security is poor, which has also led to a large number of cross-chain bridge security accidents.
4.5.1.2 Development trend
Based on the data of cross-chain bridges in 2022, we predict that the competition among the head cross-chain bridges will intensify in the future, the number of cross-chain bridges will continue to grow, ultra-light node cross-chain is expected to become a new cross-chain bridge model, cross-chain aggregators will become a new development direction, and NFT cross-chain is expected to achieve a breakthrough.
Currently, cross-chain bridges are mainly concentrated in the head public chains, such as Ethereum, BSC, and Polygon, with the number of cross-chain bridges reaching 101, 74, and 48 respectively. With the emergence of new types of public chain narratives in this round, such as high-performance public chains and modular public chains, more cross-chain bridge projects will inevitably emerge. Currently, only 8 of the 111 cross-chain bridges have a lock-up volume of over 100 million, and account for more than 90% of the total cross-chain bridge lock-up volume. This head effect is expected to be stronger in the future.
Currently, cross-chain bridges and information communications are mainly implemented using external verification and native verification. The former is verified and forwarded by multiple relays on the chain, while the latter requires running light nodes on the chain. Both modes have shortcomings. The former has poor security but low cost and fast response, while the latter has high light node cost but good security. Ultralight nodes (ULN) have both the security of light nodes and the low cost of relays, and are implemented by executing the same verification method as online light nodes. ULN's block headers are not saved in order, but are allocated on demand by decentralized oracles. Layer Zero is the first cross-chain bridge to achieve native cross-chain through ultra-light nodes. Currently, the cross-chain bridge model that chooses external verification has seen several major security incidents. The emergence of the ultra-light node cross-chain model is expected to become a new cross-chain bridge trend.
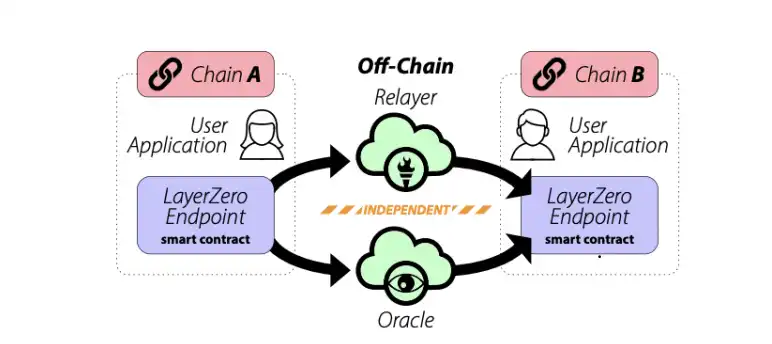
Figure 4-13: LayerZero's ultra-light node architecture
Source: layerzero.network
Cross-chain transaction aggregation also emerged with the emergence of cross-chain bridges. Cross-chain transaction aggregation uses algorithms to provide users with the optimal choice of inter-chain cross-chain paths, facilitating user transactions. This cross-chain + liquidity aggregation model can improve capital utilization to a certain extent and is expected to become a new development direction. In addition, NFT assets have not risen much this year compared to Token assets. According to nansen data, the total transaction volume of Ethereum's trading market in the past 12 months was only about 21 million Ethereum, which is less than the total spot transaction volume of top exchanges in one day. Although the mainstream cross-chain bridges currently support NFT cross-chain, most NFT projects have not found suitable application scenarios and most NFTs lack liquidity, which makes it impossible to increase cross-chain transaction volume. It is expected that in the next year, as a large number of NFT project application scenarios are implemented, cross-chain demand will increase, and cross-chain transaction volume is expected to achieve a breakthrough.
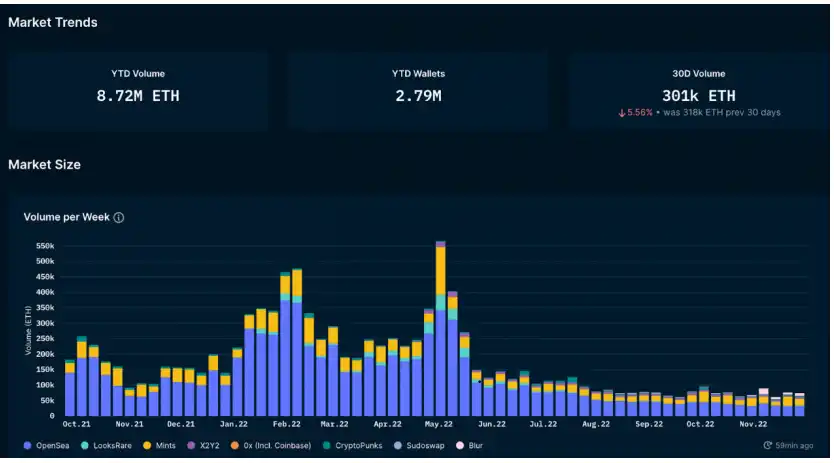
Figure 4-14: Ethereum mainstream NFT exchange transaction volume
Source: nansen
4.5.2 Summary and analysis of cross-chain bridge security incidents
Cross-chain bridges have become a rigid product for connecting multiple chains, but they are also the hardest hit by fund theft. Last year, there were 4 major cross-chain bridge security incidents, which increased to 9 this year. The stolen funds also increased from US$660 million last year to US$1.38 billion this year, involving more than US$2.2 billion. The main causes of security incidents are concentrated in code vulnerabilities and logical vulnerabilities, and only 2 were caused by private key leaks. We mainly summarize the cross-chain bridge projects involved in theft. In fact, most cross-chain bridges have had some technical problems to a greater or lesser extent.
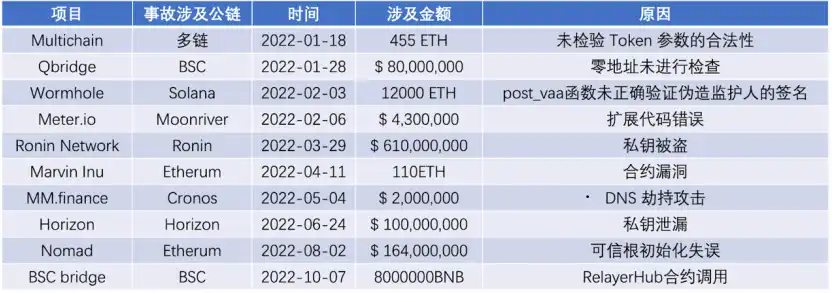
Table 4-8: Summary of cross-chain bridge security incidents in 2022
Source: Huobi Research
The reason why cross-chain bridges are frequently attacked by hackers is that, on the one hand, cross-chain bridges have a large number of encrypted assets, which are extremely attractive to hackers; on the other hand, cross-chain technology is still relatively new. Basically, a large number of cross-chain bridges began in 2021. The technical complexity and immaturity of cross-chain bridge code specifications have led to the emergence of various types of vulnerabilities, and they are mainly concentrated in multi-signature and smart contract vulnerabilities/execution errors.
For project parties, the cross-chain bridge project itself has many potential security risks and is being targeted by hackers. Therefore, the project needs to put security at a higher level in the design, such as selecting more reliable service providers, more decentralized, more rigorous development, etc. In addition, the project should also strengthen external audits and introduce bug bounties to ensure the security of cross-chain bridge funds. For users, choosing mainstream cross-chain bridges with higher security, canceling high-risk project authorizations in a timely manner, and cooperating with top centralized exchanges to complete cross-chain can reduce the risk of cross-chain funds to a certain extent.
5. CEFI
5.1 Current Status of Institutional Business Development
The situation of institutional business throughout 2022 is highly correlated with the overall crypto market. From the data of CryptoCompare from November 2021 to October 2022, it can be seen that the scale of institutional business has dropped from nearly 70B at the end of last year to about 22B. What is gratifying is that there was a slight rebound in October compared with September, an increase of about 1.76%, which was the first increase since July, but still did not exceed the peak in March. In terms of net inflows, institutional business in 2022 also turned from negative to positive in October, reaching $730K, while it was negative $9.2M in September. It is not difficult to see that this situation is completely consistent with the institutional crash in April-June (see Chapter 5.3).
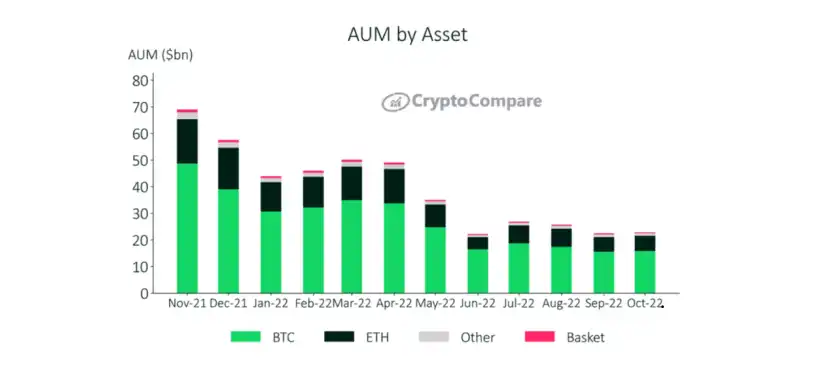
Figure 5-1: Statistics of asset size under institutional management
Source: CryptoCompare
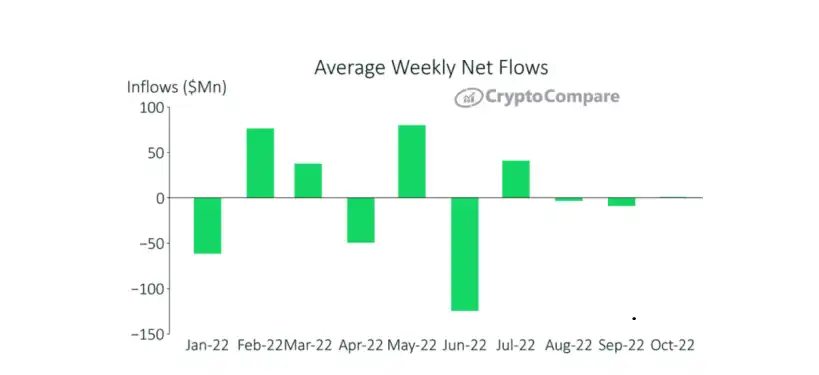
Figure 5-2: Statistics of net inflow of institutional assets.
Source: CryptoCompare
5.2 Competition/Service Landscape of Custody Business
Trust business (crypto asset custody business) is the first part of institutional business to develop. In 2022, more than 150 institutions provide custody services. Among them, the top ones are still Fireblocks, Coinbase, BitGo, ledger, etc. As shown in the figure below, Fireblocks entered the crypto trust market as early as 2018, and supported more than 1,500 types of custody assets. From the perspective of geographical distribution, most of the top players are concentrated in the United States, and most of the custody methods adopt self-operated custody (only one adopts hybrid custody). From a technical point of view, the MPC (multi-party computing) technology has been gradually superimposed from the simple HSM technology in the past.
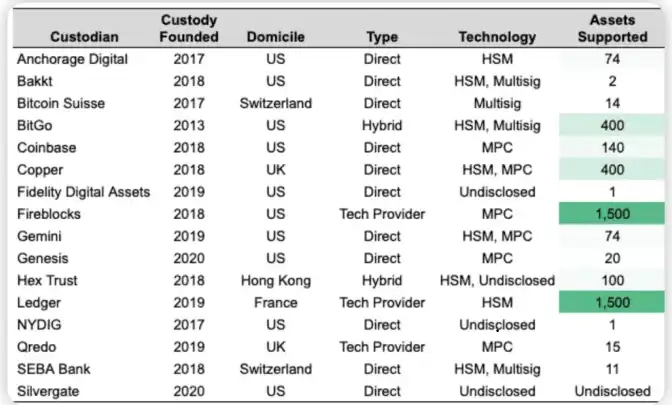
Figure 5-3: List of mainstream trust institutions
Source: gsr.io
Figure 5-4: Major categories of trust institution products
Source: https://cointelegraph.com
From the perspective of the range of products provided, they are gradually divided into three categories. One category is to provide services only to institutional clients, with typical representatives being BitGo and Hex. The other category is to provide services to both institutional clients and retail clients (including high-net-worth individuals), such as BlockFi and Coinbase. The third category is relatively special. They provide hardware services specifically for the market, such as hot and cold wallets, custody systems, etc. Typical representatives include Fireblocks, Bitbond, etc. These three categories have formed the current product competition pattern in the custody market.
5.2.1 CeFi lending and asset management business
Institutional lending business refers to providing crypto asset lending services to institutional investors and some high-net-worth individuals (including family offices) with institutions as the main customers. Its borrowers are usually quantitative institutions, exchanges, mining pools, project parties, etc. Quantitative institutions and exchanges usually use institutional lending services for hedging and partial capital turnover, while mining pools use loans to pay electricity bills and purchase fixed assets such as mining machines. Correspondingly, the lenders of institutional lending business are usually long-term holders such as wealth management institutions and family offices.
The main players in Cefi lending in 2022 include Copper, Hex, Matrixport, BitGo, etc. Their main services and models are shown in the following table:
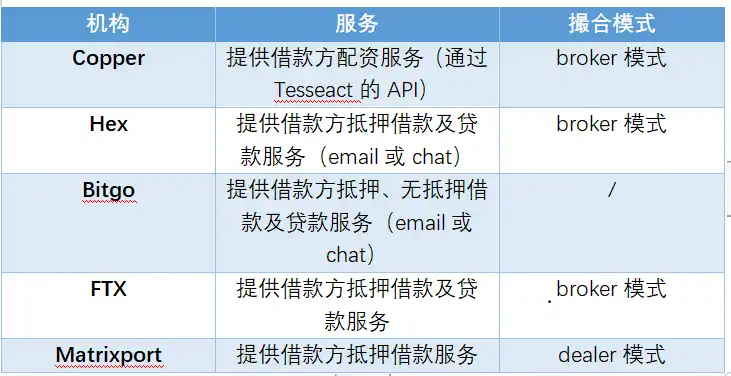
Table 5-1: Introduction to the main players in Cefi lending.
Source: Huobi Research
Currently, the faster way to match loans is to match customer needs through email or WeChat (Hex or Bitgo mode), and the broker mode will be relatively simple. However, it is difficult to build a capital pool dealer due to compliance reasons.
5.3 Statistics and impact of institutional thunderstorms
In 2022, the cryptocurrency market experienced two large institutional thunderstorms. The first was the collapse of Terra. Three Arrows Capital suffered huge losses in the Terra collapse due to improper risk management, implicated other investors, and opened a capital exposure in the cryptocurrency circle. Because of this, all institutions that had financial dealings with Three Arrows Capital were implicated. The bankruptcy of Three Arrows Capital reflects the huge risks of unsecured lending (credit lending) in the cryptocurrency market, and a series of institutional thunderstorms have also arisen as a result. Governments of various countries have also become more vigilant due to a series of risk explosions in the cryptocurrency market and decided to implement stricter supervision to prevent similar incidents from happening again.
The second storm was the thunderstorm of FTX. The fuse of the incident came from its sister company Alameda, which needed a lot of funds for its business, borrowed user funds from FTX and used its tokens such as FTT and SOL as collateral. Coindesk published an article pointing out this risk problem on Alameda's balance sheet and issued a warning. Later, Binance founder CZ used this as an excuse to announce that he would sell the FTT he held to avoid risks, which caused market panic and led to a sharp drop in the price of FTT, which in turn caused a significant shrinkage in the FTX asset side and triggered a wave of user runs. In the end, FTX was depleted of liquidity due to user runs, and the sharp drop in assets such as FTT and SOL it held led to insolvency and eventually declared bankruptcy. Previously, FTX was the second-largest centralized exchange in the industry. The bankruptcy of FTX directly triggered an industry earthquake. The collapse of FTX is already one of the most spectacular disasters in financial history. Hours after it filed for bankruptcy, FTX Exchange was hacked, and more than $600 million was withdrawn from the cryptocurrency exchange, and most users were unable to withdraw their funds. The impact of the FTX incident continues to spread.
5.3.1 Inventory of Institutional Collapses
1. Terraform Labs
Terraform Labs is the cryptocurrency company responsible for developing the Terra blockchain network and Anchor. The company created the stablecoin TerraUSD, but later decoupled from the US dollar, leading to the collapse of Terra and a massive sell-off in the cryptocurrency market. The Luna token was once a cryptocurrency worth more than $40 billion, but because TerraUSD broke its peg to the US dollar, it lost value. Terraform Labs also suffered huge losses as a result. The collapse of Terra was the source of a series of institutional collapses that followed.
2. Three Arrows Capital
Three Arrows Capital is a cryptocurrency hedge fund based in Singapore. Until March 2022, Three Arrows Capital managed $10 billion in assets and was known as one of the world's most famous cryptocurrency companies. However, its $200 million investment in Luna tokens was one of the main reasons for its bankruptcy. The company declared bankruptcy on June 29, two days after receiving a loan default notice from Voyager Digital. The company defaulted on more than $650 million in loans to Voyager Digital in June this year. Since then, the British Virgin Islands Court has ordered Three Arrows Capital to liquidate its assets after determining that the fund is unable to repay.
3. Voyager Digital
Voyager Digital is an American cryptocurrency loan company that operates primarily in the United States and Canada. Because of Three Arrows Capital's bad debts, Voyager Digital lost more than $650 million, fell into financial crisis, and once suspended trading and froze customer funds. On July 6, Voyager Digital disclosed that it had filed for bankruptcy protection. Despite a rescue loan from FTX founder Sam Bankman-Fried's trading firm Alameda Research in June, Voyager Digital could not avoid filing for bankruptcy. The company also stated in its bankruptcy protection application that it had more than 100,000 creditors at the time and debts between $1 billion and $10 billion. FTX then acquired Voyager Digital for $1.4 billion. After FTX's collapse, CZ expressed his intention to acquire Voyager Digital again in November.
4. Celsius Network
Celsius Network is a US-Israeli cryptocurrency company. The company was once a leader in cryptocurrency lending platforms. However, in June this year, it stopped trading and withdrawals on the platform, and about $12 billion of user assets were frozen. Celsius Network filed for bankruptcy protection on July 13. The company also laid off about a quarter of its employees on July 4. Later, Celsius was also damaged in the FTX explosion because of its assets placed on FTX, and it is currently estimated that nearly $354 million was affected.
5. Babel Finance
Babel Finance is a cryptocurrency lender based in Hong Kong. The company stopped all user withdrawals in June. After announcing the suspension of user withdrawals, Babel Finance disclosed that it was hit by unprecedented liquidity problems due to the volatility of the cryptocurrency market. Babel Finance is one of many crypto companies affected by Terra and the Three Arrows, which have seen billions of dollars of investor funds frozen.
6. CoinFLEX
CoinFLEX is a futures exchange. It temporarily halted all withdrawals in June due to financial issues amid the recent cryptocurrency selloff. CoinFLEX later announced plans to recover the $84 million owed. It also partially reopened withdrawals to users capped at 10%, leaving 90% of user balances as locked funds that users still cannot withdraw or trade. The reason for the freeze was that CoinFLEX had liquidity issues after one of its lenders defaulted on $47 million in margin. CoinFLEX's funding shortfall was also estimated at $84 million.
7. BlockFi
BlockFi is one of the world’s leading cryptocurrency companies, providing financing services and loans. The company suffered a loss of $80 million due to bad debts from Three Arrows Capital. In June of this year, BlockFi announced that the company would lay off 20% of its employees. After that, FTX acquired the hard-hit BlockFi for $240 million. Later, in the FTX thunderstorm, BlockFi announced that it had a significant risk exposure to FTX (about $355 million was frozen in FTX), suspended user withdrawals, and announced bankruptcy on November 28.
8. Genesis Trading
Genesis is a well-known cryptocurrency company that provides crypto asset trading, lending, custody and brokerage services, with an asset management scale of tens of billions of dollars. Genesis has $175 million of funds tied up in FTX during the FTX crash. Genesis announced on November 16 that it has suspended redemptions and new loans due to its risks in FTX. Genesis is currently looking for $1 billion in emergency loan assistance to meet customers' high redemption requests.
9. Vauld
Vauld is a cryptocurrency company based in Singapore that provides cryptocurrency lending and investment services to more than 800,000 customers. On July 4, the company announced that it would stop all customer withdrawals and deposits. Vauld's CEO Darshan Bathija said that the unreliable and unstable market environment has led to the company facing financial challenges. The company had been operating strongly for about four years and raised $27 million from investors such as Coinbase Ventures. Due to the collapse of the Terra UST stablecoin and other institutional crashes, its customers have withdrawn $197.7 million since June 12. Vauld also faces liquidity problems.
10. Inventory of FTX crash institutions
Since the FTX crash just happened in November, the following list counts the known affected institutions (not all institutions will choose to disclose their funding gap to FTX in the crash). It is known that most institutions are also affected because their funds are tied up in FTX and cannot be withdrawn, and some institutions are also hit because they hold a large amount of FTT.
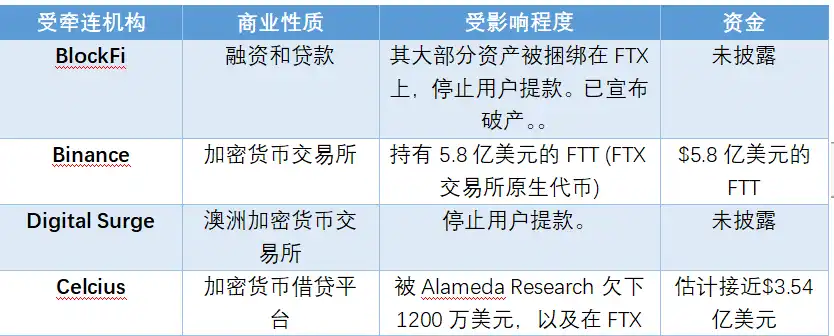
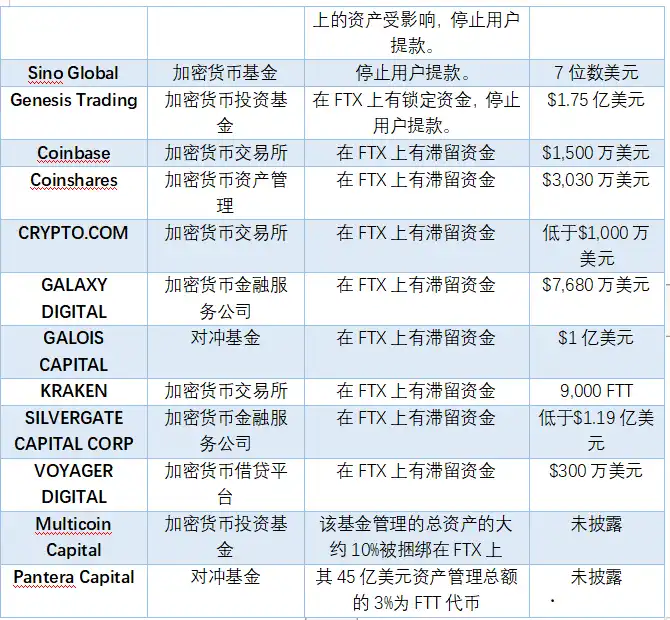
Table 5-2: Statistics of large institutions affected by FTX
Source: Huobi Research
6. NFT
6.1 Current Status of NFT Market
NFT is a new type of crypto track that emerged in 2021 and has received great attention from the market since April 2021. NFT has gradually become popular and has entered the public's eyes since the second half of last year, and reached a climax in early 2022. However, in the context of the worrying environment of the crypto industry, the performance showed that it was incapable of doing so and lacked stamina.
6.1.1 The popularity of the NFT market declined with the overall market
Throughout 2022, the total market volume of NFT dropped from 31.14B in January to 21.73B in October, a decrease of about 42%, and the daily transaction amount dropped from 842M in January to 48M in October, a decrease of about 94%. The number of active NFT users has dropped from 45,000 at the end of 2021 to 5,000, with a corresponding sharp decline in buyers and sellers. We see that the main transactions are active in January, April and June, and from the second half of the year, the performance is quite bleak. The cumulative user scale of NFT has increased from 1.4459 million at the beginning of the year to 3.4266 million, a relative increase of 138% (the NFT market only started in the second half of 2021). The increase in the total number of users accompanied by the decrease in the number of active trading users indicates that there are more buyers, and most users are in a state of holding losses.
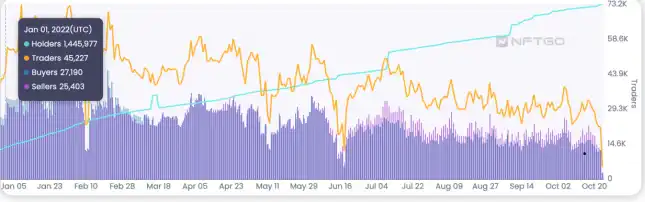
Figure 6-1: Number of days NFT Meme rose and fell
Source: NFTGO.IO
6.1.2 Asian market’s interest in NFT remains high
From the Google Trends chart, the search trend of NFT on Google reached its peak in mid-January 2022, and then began to decline. There was another small peak in April and May, and it has been in a declining trend since then.
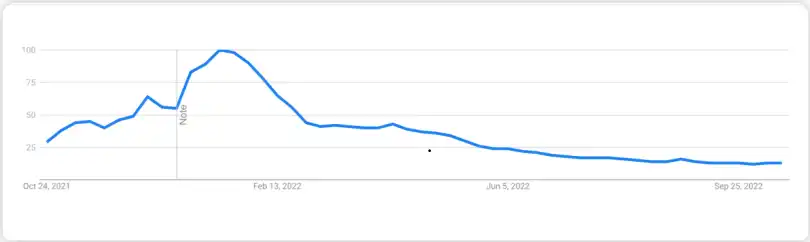
Figure 6-2: NFT Global Trends
Source: Google Trends, Huobi Research
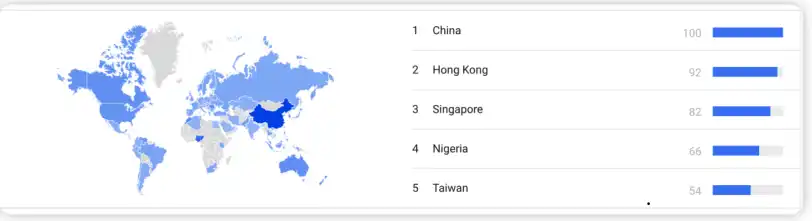
Figure 6-3: NFT Regional Interests
Source: Google Trends, Huobi Research
From the perspective of regional interest, Mainland China ranks first in the search index, followed by Hong Kong, Singapore, Nigeria and Taiwan ranked 3-5 respectively, and the United States ranked 19th. Compared with the previous year, in the context of the bear market, the interest of Chinese regions (mainland China, Hong Kong, Singapore) in NFT has gradually surpassed that of European and American countries, and it is still high.
6.1.3 NFT has obvious head effect and long tail market emerges
From the classification of NFT, about 12.67B of the 21.73B in 2022 are PFP, accounting for as high as 58%, followed by collectibles and game NFTs. This shows that the NFT market is still dominated by avatar series, and there has not been much innovation and out-of-circle in category expansion compared with 2021.
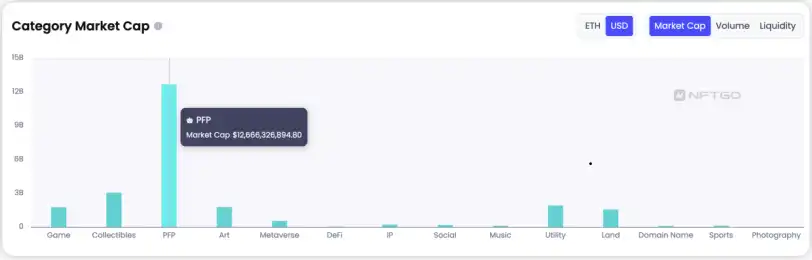
Figure 6-4: NFT Category Market Cap
Source: NFTGO.IO
From the collection of NFTs, the top three are BAYC, CryptoPunks, and Otherside Land. Almost more than half of the top ten (Meebits and Punk were acquired by Yuga Lab) are occupied by the Yuga Labs family. It shows a trend of constant strength at the top.
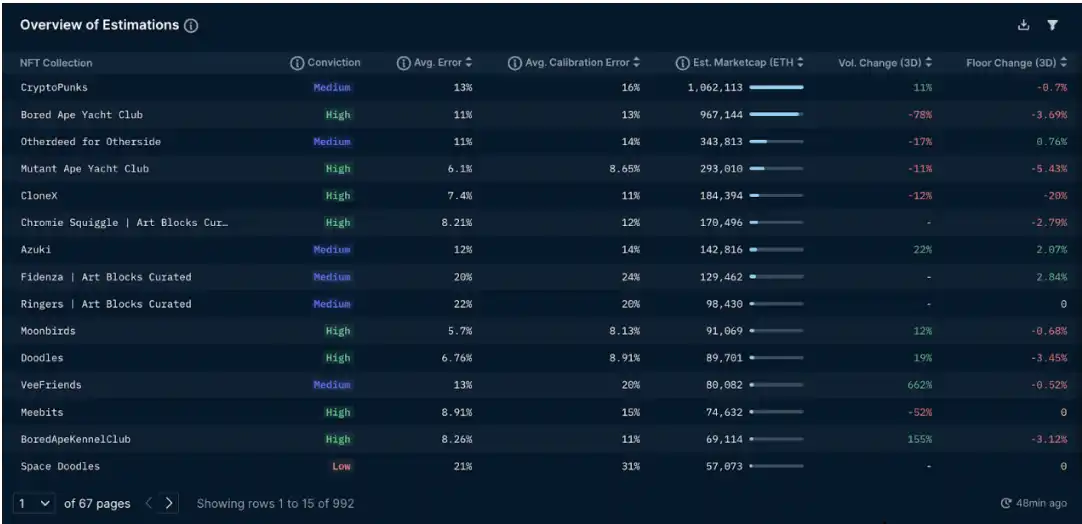
Figure 6-5: NFT Collection Distribution in Market cap
Source: nansen
However, apart from the first ten well-known NFTs, other niche NFTs account for 62.05%, and the long-tail market is emerging. The NFT market is gradually conforming to the "28 phenomenon".
6.2 New Trend of NFT--Meme Bubble Burst, Layered Dolls
Looking at the entire NFT market in 2022, after a honeymoon period from January to April, it began to go downhill in May (marked by the sale of Monkey Land on May 1). From May to October, in the context of the bear market, various Meme NFTs emerged in an endless stream. From the initial we-are-going-to-die to the extremely pyramid-like Mts, and finally to goblintown.wtf, the confidence of NFT players was constantly overdrawn in the bear market. In particular, goblintown.wtf, this project raised $20m in funds in 1 week under the strong "pyramid scheme" color, and it was also the "ugliest" NFT. The subsequent "Shit God, Shit Beast" series carried out nesting doll operations on this basis, and also attracted a large number of FOMO people. But since June, many projects have all gone to zero. The prevalence and rupture of NFT Meme is one of the biggest features of the NFT market in 2022.
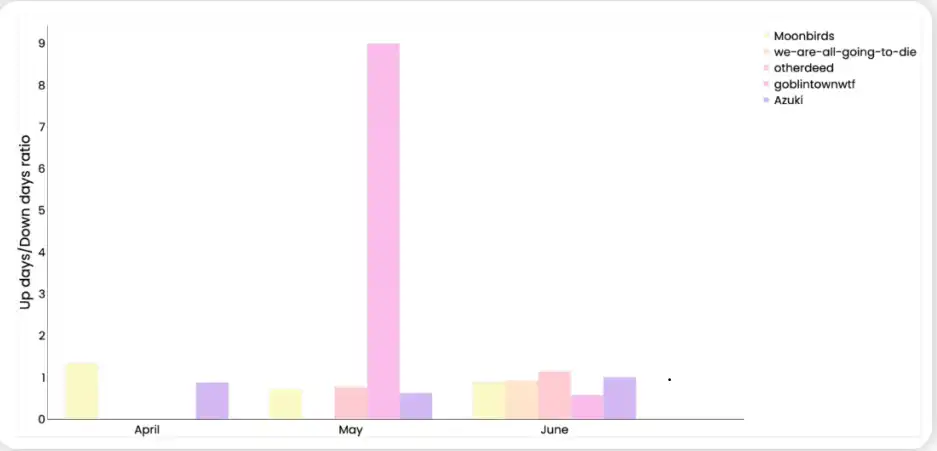
Figure 6-6. NFT Meme Rise and Fall Days
Source: NFTGO.IO
Another innovative model of the NFT market in 2022 is that the story relationship between the various NFT series is getting better and better, and the narrative is enhanced. Combined with airdrops and the issuance of Tokens, trends and gameplay combined with Crypto have also emerged. In particular, drawing on the gameplay of DEFI, a new chapter of NFTfi has gradually emerged and enriched.
6.3 NFTfi--Newly Shown, In the Ascendant
NFT (non-fungible token) has become an indispensable part of the crypto world. Today, NFT has developed from a simple PFP project to a combination with games, the metaverse, mortgage lending, etc., and is initially forming a model of NFT+decentralized finance. But in essence, NFT is a non-fungible token. Its indivisibility causes it to encounter greater difficulties in liquidity compared with FT, such as limited transaction accuracy, high capital occupation, and insufficient price discovery mechanism.
In order to solve these problems of NFT, financial applications and tools for NFT assets have appeared in the market, aiming to increase the liquidity and priceability of NFT assets through the combination of NFT and Finance, and improve the utilization rate of NFT funds in order to create a better NFT user experience. We refer to such applications and tools as NFTfi applications.
6.3.1 NFT lending - emerging
NFT lending is the most direct way to solve the liquidity of NFT assets, and it is also the most important demand of the current NFT market. Before 2022, there was little discussion of NFT lending in the market, but this year NFT lending has gradually begun to gain momentum. In 2022, the NFT lending market is mainly divided into two models: P2P peer-to-peer lending and P2Pool peer-to-pool lending. The more typical representatives are the NFTfi protocol and the BendDAO protocol. Both have their own advantages and disadvantages in terms of transaction frequency, trial scope and price discovery effectiveness, and the overall market still accounts for a small proportion of homogeneous token lending.
Figure 6-7: NFT Lending Landscape
Source: Twitter
From the previous chapters, we know that the entire NFT market is on a downward trend in 2022, which has led to the development of NFT lending projects not getting out of a good market. The current NFT lending mainly stays in the field of blue-chip NFTs, and for medium and low-priced NFTs, due to large price fluctuations and the lack of oracles, it has not yet been widely recognized in the lending market.
Overall, NFT lending has seen some innovations in 2022, but the development is still slow. The overall market still accounts for a small proportion of homogeneous token lending, and the market capacity is relatively limited. It is expected to expand to waist or tail NFT lending in the future, and at the same time realize more financial derivatives and application scenarios in the model.
6.3.2 Current Status of NFT Liquidity Solutions
In 2022, the entire crypto market environment shrank, and NFT liquidity solutions came into being. The current popular NFT liquidity solutions are mainly NFT fragmentation, crowdfunding agreements, and liquidity pool agreements.
NFT fragmentation transforms NFTs into homogeneous tokens with higher transaction accuracy, and uses mortgages, pledges, and leverage of homogeneous tokens or equity to improve user trading experience and enhance capital utilization;
The crowdfunding agreement solves the market's excessively high user threshold from the demand side, allowing participants to pool funds and jointly manage NFTs in a multi-signature environment;
The liquidity pool protocol brings together many NFTs near the floor price, providing users with a stable market-making platform.
Overall, liquidity solutions will emerge in an endless stream in 2022, and some projects (such as PartyBid) have won the favor and investment of capital. Various emerging projects are beginning to emerge.
The above liquidity solutions have diverse ideas, which can improve capital efficiency to a certain extent. However, due to problems such as pricing difficulties, the liquidity of long-tail and rare NFTs has not been effectively solved. In the future, as the accumulation of historical transaction prices gradually improves the NFT quotation mechanism, the liquidity of NFTs will definitely get better and better.
6.3.3 NFT Aggregator-The Strong Will Always Be Strong
NFT aggregators integrate listings and offers information from different order book trading markets into one platform, providing one-stop purchases, pending orders and sales. At present, the mainstream general aggregator platforms are Genie and Gem, and there are various vertical track aggregation platforms, such as ENS.vision. NFT aggregators performed extremely well in the first half of 2022, among which Genie and Gem were acquired by SudoSwap and OpenSea respectively. The entire aggregator track is basically dominated by Gem and Genie, showing a state of strong getting stronger.
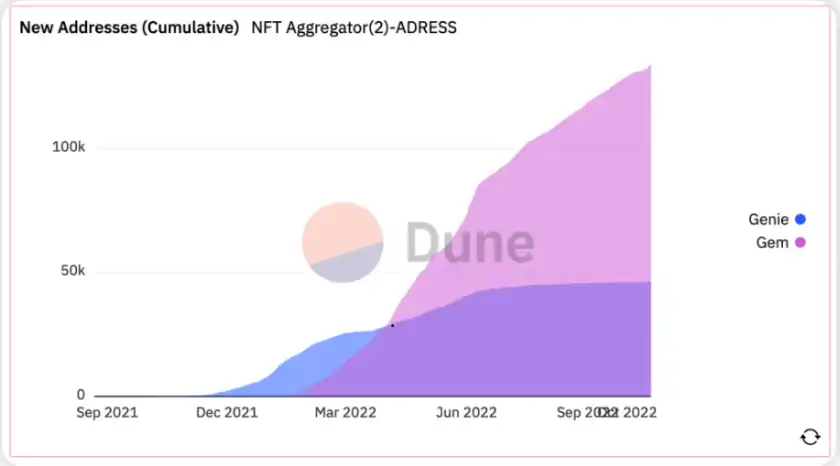
Figure 6-8: NFT Meme Rise and Fall Days
Source: Dune
On the other hand, NFT aggregators meet the needs of information aggregation and transaction aggregation, and the integration with upstream trading markets and downstream data analysis tools is in-depth. The upstream trading market/protocol naturally needs to rely on the aggregator tool to provide it with a "channel", while the downstream data analysis tools provide users with attributes, rankings, chip distribution and other services when screening NFTs. In the first half of 2022, there has been a phenomenon of upstream trading protocols acquiring aggregators, and the integration of aggregators and data analysis tools is also underway. It is expected that there will be more integration cases next year. The vertical integration of NFT aggregators with trading markets and data analysis tools is the general trend.
Figure 6-9: Upstream and downstream relationships of NFT aggregators
Source: Wu Shuo
Welcome to join the official BlockBeats community:
Telegram Subscription Group: https://t.me/theblockbeats
Telegram Discussion Group: https://t.me/BlockBeats_App
Official Twitter Account: https://twitter.com/BlockBeatsAsia

 Related Articles