How to identify, analyze and avoid NFT "wash trades"
Original title: How to identify NFT wash Trades?
原文作者:ANNDY LIAN, Forkast
原文编译:Katie 辜, Odaily 星球日报
wash trading is not a new term for financiers. Cryptocurrencies are being "washed" back and forth in the same pattern of buying and selling. NFT So does the market. "Wash trades" make it difficult for NFT enthusiasts to gauge the true interest in a particular series, exaggerate and distort trading volumes, and mislead platform analysis.
How can on-chain data be used to identify "wash trades" and detect suspicious activity?
What is a "wash trade"?
Wash trading is a form of market manipulation in which investors buy and sell the same financial product at the same time to create misdirection in the market.
In NFT trading, a "wash trade" occurs when the same user acts as both buyer and seller in an NFT trade. Unlike traditional securities, the NFT market is not regulated by the government and the real identity behind the address is difficult to tell. As a result, wash trades are very common in the NFT market.
Why do people wash NFTS?
There are two main motives behind the "wash up" in NFT.
Earn platform Rewards
Some NFT markets, such as X2Y2, reward active users by giving them a payoff (in the form of a protocol Token) based on their transaction volume. Wash traders take advantage of this to maximize their returns by generating large amounts of fake trading volume. In turn, this can easily fool users who want to quantitatively analyze NFT collections or markets based on liquidity.
Create the illusion of value or liquidity
To create an illusion of liquidity and inflated values for particular NFT collections, some unscrupulous creators turned to wash trades to deceive buyers. They profit when real buyers are duped into buying NFTS from them at inflated prices. This type of washer hides their activities with new wallet addresses, which are self-funded by the centralized trading platform wallet. This type of wash trading generates relatively small volumes and is less disruptive to the market than type 1 wash trading.
How does a "wash trade" work?
由于第一种「洗盘交易」对 NFT 交易数据的干扰性,我们用从链上数据来识别。要理解这种类型的洗盘交易,我们必须先理解 X2Y2 和 LooksRare 的 Token 奖励系统。X2Y2 和 LooksRare 每天根据地址的交易量(作为市场平台每日总交易量的一部分)向卖方和买方分发 Token 。 Token 奖励每天都是固定的,所以洗盘交易者可以进行洗盘交易,并在每日分配重置时重复获得奖励 Token 。
Figure 1 shows an example of a wash trade activity in the X2Y2 market.
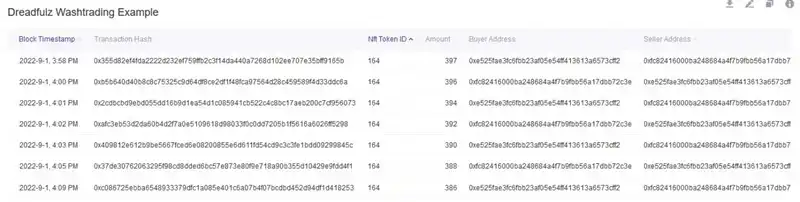
Figure & have spent 1 - NFT series & have spent Dreadfulz Example of a wash trade by (source: Footprint Analytics)
As can be seen from the above figure, two wallets with the same NFT (ID 164) were purchased back and forth several times in a day, with each transaction costing more than 300. ETH . On September 1, 2022, the two addresses traded. 7228 ETH transactions were generated and 36.14 ETH were paid for the X2Y2 platform. And Dreadfulz's royalty rates aren't set on X2Y2. Therefore, no creator fees were paid. Wash traders will choose the zero version of the tax series to minimize their trading costs.
How to identify a "wash trade"?
I studied the detection methods of some analytics platforms. Based on my own knowledge and analysis, here is a list of questionable data and activities:
A particular NFT is traded at the same address more than X times per day, while other collectibles remain the same;
The same address is conducting the same NFT transaction in high-frequency mode;
NFT series sell themselves at high frequency without marketing or promotional support;
The average historical transaction price in market A is X times that in market B;
The selling price of the NFT is X times higher than the lowest price NFT available for sale;
The same wallet funds all the suspicious wallets that buy and sell NFTS;
Continued unusually high trading volume.
The above assumptions are not perfect, and I hope to work with researchers to develop a more comprehensive "scorecard" that can more effectively determine NFT trends and behavior. The ability to track multiple wallets to identify different levels of relationships over time is also critical.
Top & have spent NFT How do collections get "washed up"?
In Figure 2, Footprint Analytics applies their identification rules to the most traded NFTS series on X2Y2 and LooksRare.
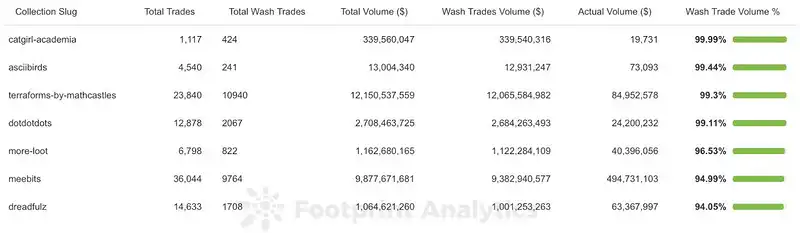
Figure & have spent 2 - selected & have spent Wash Trade statistics for NFT Series (Source: Footprint Analytics)
According to their rules, they have detected that 95% or more of the volume in these series is wash trading. Washing accounts for an extremely high proportion of the volume of transactions in these collectibles, which gives a misleading picture of the historical volume and sales activity of the collectibles.
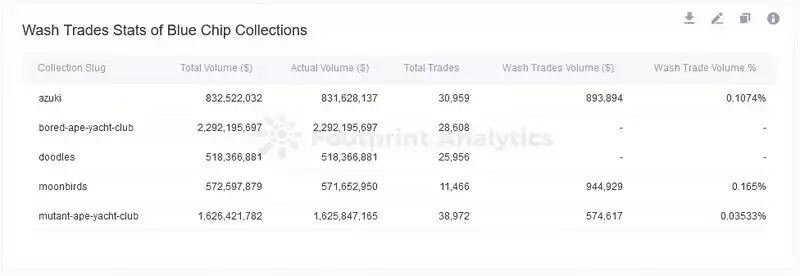
Figure & have spent 3 -- blue-chip & have spent Wash Trade statistics for NFT Series (Source: Footprint Analytics)
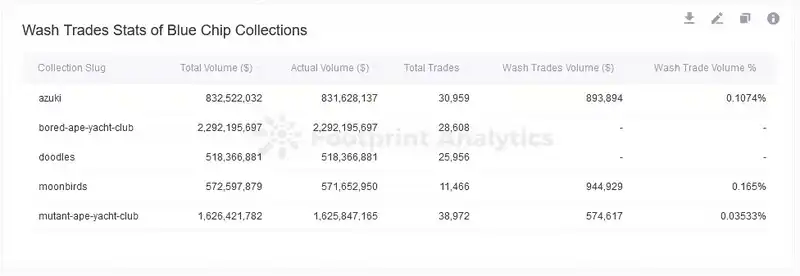
Figure 4 -- Wash trade data for LooksRare and X2Y2 (Source: Footprint Analytics)
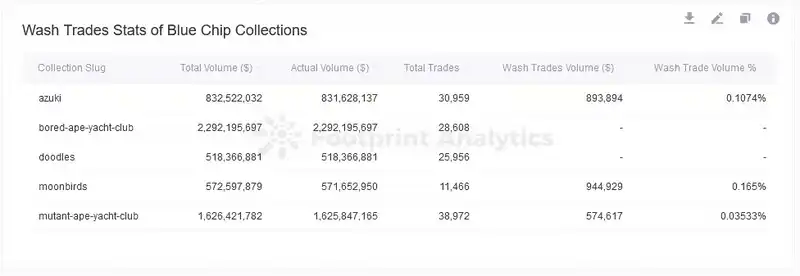
Figure 5 -- Unfiltered transaction data for Opensea, LooksRare, and X2Y2 (Source: Footprint Analytics)
Figure 4 shows that 94.71% and 81.04% of the volume on LooksRare and X2Y2 are wash trades, which seems to be consistent with the market statistics, as shown in Figure 5. As we can see from the unfiltered data, Looksrare's average price per transaction is almost $85,000. OpenSea At around 90 times the average price, it's outrageously expensive.
conclusion
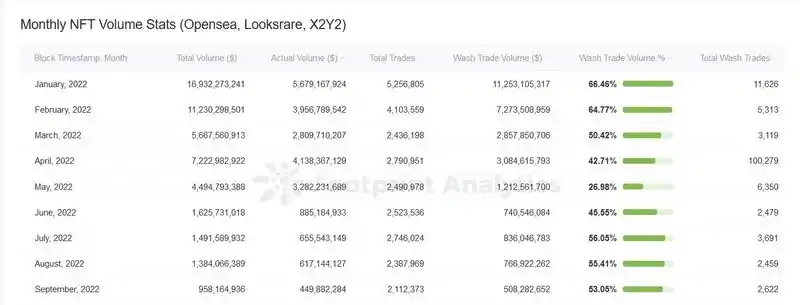
Figure 6 -- Monthly for OpenSea, LooksRare, and X2Y2; NFT Sales Data (Source: Footprint Analytics)
As can be seen in Figure 6, the monthly trading statistics of the NFT market have accounted for more than 50% of the total trading volume in almost every month since January 2022. While total volume is down sharply from January highs, the percentage of wash volume in the NFT market has remained similar month to month. This highlights the disruptive nature of wash trading to accurate NFT trading data and the importance of "filtering" NFT data analysis of wash trading pairs.
The original link
Welcome to join the official BlockBeats community:
Telegram Subscription Group: https://t.me/theblockbeats
Telegram Discussion Group: https://t.me/BlockBeats_App
Official Twitter Account: https://twitter.com/BlockBeatsAsia
 Related Articles