Data analysis: The NFT market has accelerated its decline, is it entering the moment of bottom hunting?
Original title: "Data analysis: The NFT market has accelerated its decline. Is it time to buy bottoms? "
Original Source: Echoo Research
< /p>
This week's market trend
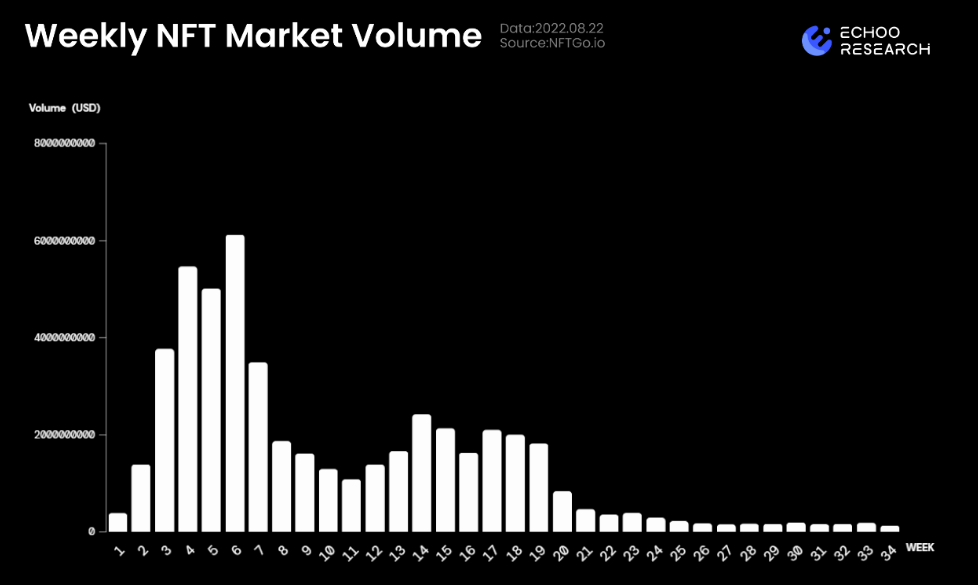
Weekly NFT Market Volume (Source: echoo.substack.com)
This week’s NFT trading volume has dropped sharply compared with last week. The current trading volume of OpenSea, which accounts for the largest trading volume, is less than 10% compared to the "peak of the bull market". %,
From a larger time span, the total trading volume of the entire NFT market is still hovering in a low range, and there is no sign of a strong rebound. Since May this year, this trend has been going on for 14 weeks, and we are still waiting for a stronger rebound signal to appear.

Weekly NFT Market Traders (Source: echoo.substack.com)
This week, the number of people participating in transactions has dropped sharply, even breaking the The "law of volatility" we mentioned in the past few weeks, after the trend has been maintained for 10 weeks, the market has not improved, and most people choose the strategy of "reducing transactions".
The current trader data (Buyers, Sellers) is at a low level in the historical range, and the number of sellers is slightly greater than the number of buyers. This shows that while people's participation in the NFT market is getting lower and lower, In terms of willingness, it is more inclined to "sell".

Blue Chip Index (Source: echoo.substack.com)
The blue-chip NFT index has fallen for 5 consecutive weeks, which means that NFT in the top range is flowing out more funds, which is important for the overall stability of the NFT market Sexuality has had an impact. At present, the blue chip index is close to the lowest value of this year. Whether it will fall below the lowest value is the next thing we must pay attention to.

Weekly Trend On The Net Value Of Whale Capital (Source: echoo.substack.com)
< /p>
This week, the net inflow of giant whales has reduced the outflow compared with last week, but it is still negative.
Through the tracking of the previous few weeks, we found that the behavior of the giant whale is ahead of the NFT market. When the overall trading volume of the market is currently sluggish, the overall liquidity of the giant whale is low, which represents the giant Whales are more inclined to participate in NFT investment on a small scale.
The NFT market is weakly affected by giant whales, and more retail investors are leading transactions.
Exclusive indicators
< /p>
1. The NFT of the giant whale last week
The following table shows the top 20 NFTs purchased by giant whales. The detailed purchase quantity and average cost are as follows:

NFTs Bought By Whales In The 34th Week
2. Blue chip NFT buy and sell signals
< p line="Tk8n" ql-global-para="true" linespacing="115">The indicators provided by this research are the blue-chip NFT buying and selling signals. NFTGo Research first selected the classic RSI and SMA indicators for testing and conversion, which has certain reference for buying and selling behaviors.

Buy-Sell Signals Of Blue Chip NFTs In The 34th Week
Most of the blue-chip prices this week triggered a buy signal. Those who want to buy blue-chip NFTs at low prices can pay attention to the latest prices, and they may There are good chances.
Indicator Description
RSI Strategy: A buying and selling signal designed according to the relative strength of buying and selling of RSI .
Simple method of use: below the fluctuation range is a buy signal, above the fluctuation range is a sell signal, the greater the deviation, the stronger the signal.
3. SMA trend of blue chip collection
< br>
The recent trend of blue-chip NFT is still a downward trend, and there is a possibility of continuous decline.

SMA Trend Of Blue Chip NFTs In The 34th Week
Indicator Description
This indicator synthesizes the market capitalization of blue-chip NFTs and uses moving averages for calculation to reflect the trend of the NFT market.
SMA: Reflects the trend of short-term to long-term.
Simple method of use: When the short-period line crosses the long-period line from below, it is a buy signal, and when the short-period line crosses the long-period line from above, it is a sell signal.
This article is from a contribution and does not represent the views of BlockBeats.
Original link
Welcome to join the official BlockBeats community:
Telegram Subscription Group: https://t.me/theblockbeats
Telegram Discussion Group: https://t.me/BlockBeats_App
Official Twitter Account: https://twitter.com/BlockBeatsAsia