Overview of 15 Metrics on the State of DeFi in 2022

Original Article Title: " What Is the State of DeFi in 2022? Look at These 15 Metrics "
Original Article Author: Ignas, DeFi Research
Original Article Translation: DeFi Way
So, what is the state of DeFi in 2022?
Here are 15 metrics to understand.
1. Total Value Locked
At the time of writing this article, $556 billion is locked in DeFi smart contracts.
This figure is down 69% from the previous all-time high of $1820 billion on December 3, 2021.
Maker's TVL dominance is 13.98%, much lower than the over 50% dominance during the early 2020 DeFi summer period.
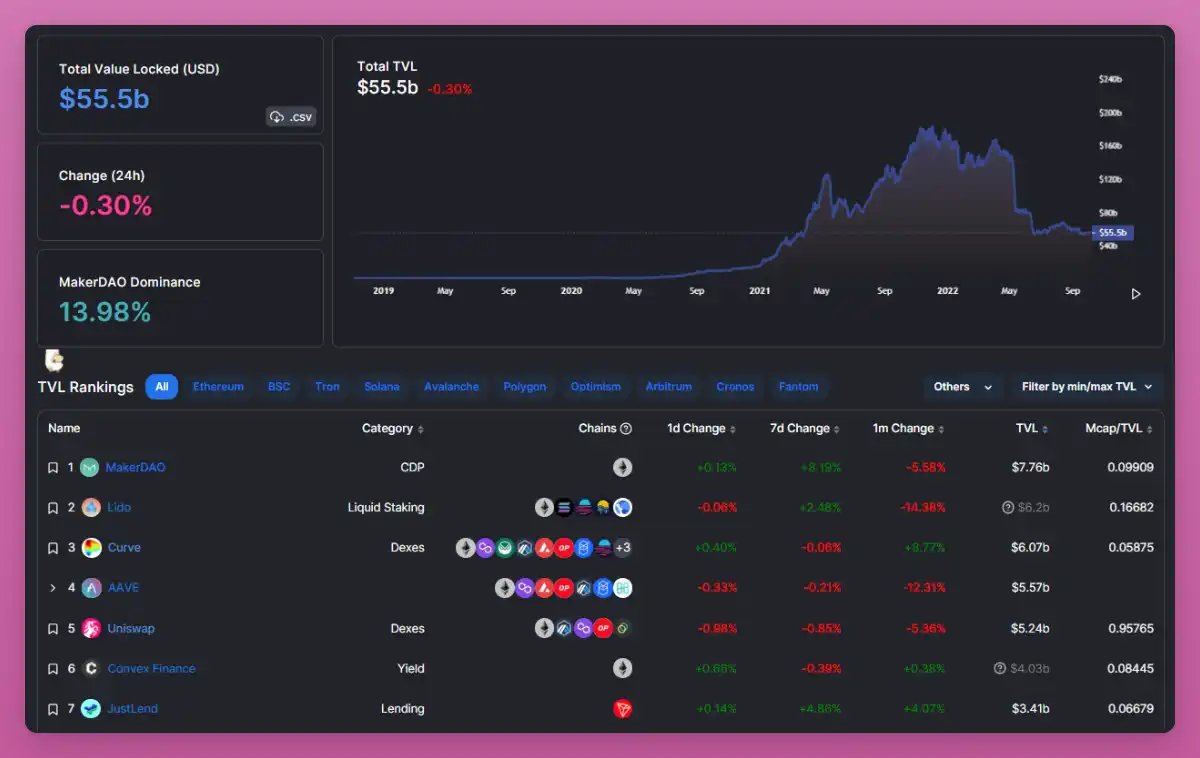
https://defillama.com/
Note: DefiLlama's TVL calculation does not include governance Tokens staked in protocols, so-called two- pool LP Tokens, borrowed assets on lending markets, staked assets in liquidity pools, and double-counted TVL from other protocols.
If those metrics were included, DeFi TVL would be $927 billion.
2. DeFi Token Price (Year-to-Date)
The DeFi Pulse Index (DPI) tracks the performance of the leading decentralized finance assets in the market.
In dollar terms, DPI has declined by 67.8% year-to-date, performing 5% worse than ETH.
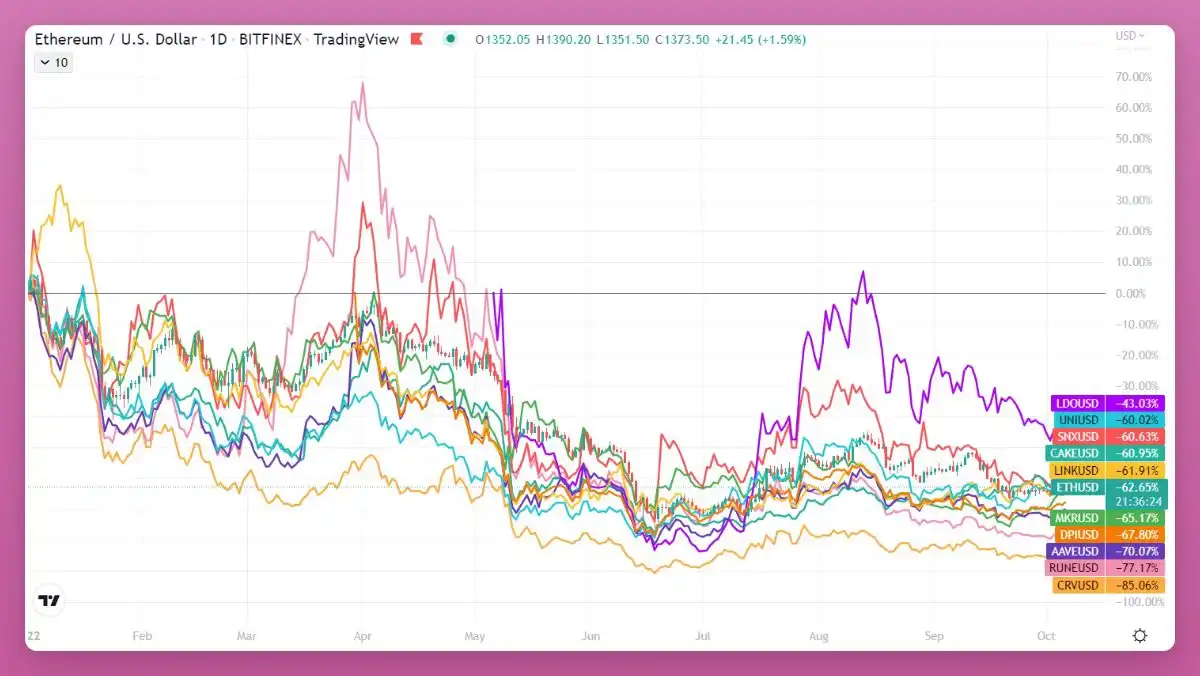
Among the major DeFi Tokens , CRV has seen the largest drop, reaching 85%.
While significantly down in dollar terms, holders of LDO, UNI, SNX, CAKE, and LINK will outperform ETH-only holders.
3. Blockchain Developer Activity
Data from each on-chain new GitHub repository shows developers are still building.
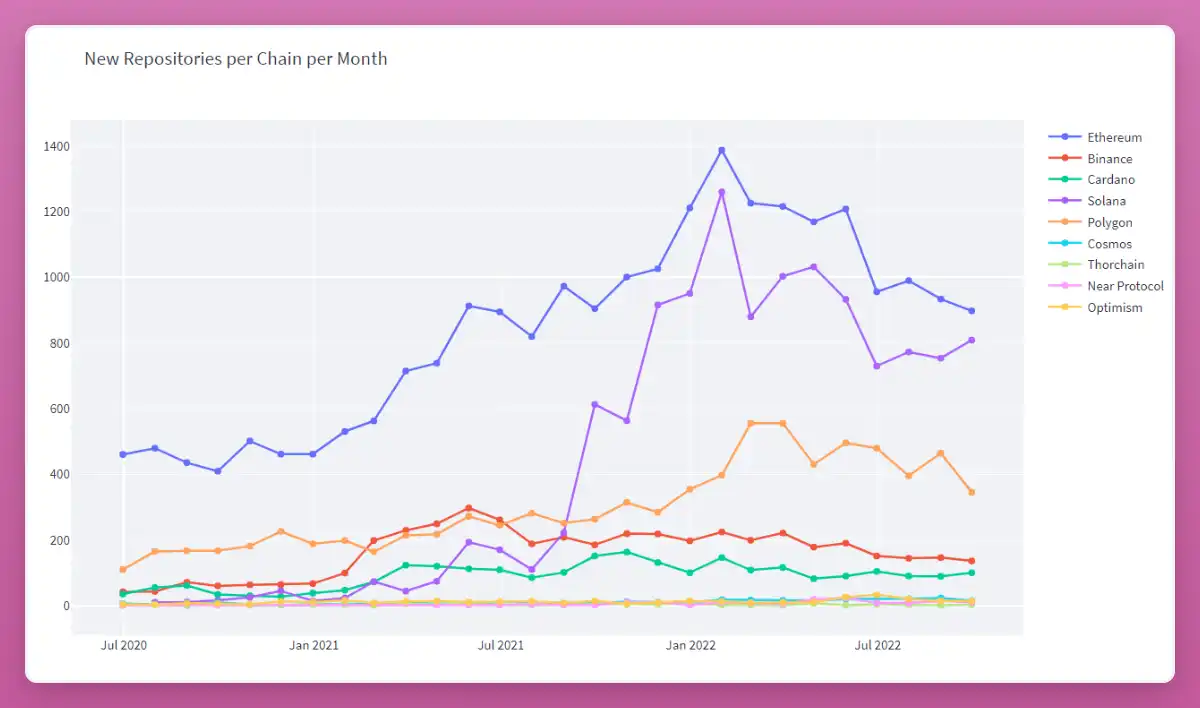
Source: https://leodatavinci-blockdevmonitor-1--chain-activity-dashboard-rbz4 n5.streamlitapp.com/
A repository is a place where code is stored on GitHub.
Based on tracking 87,116 repositories and 98,960 developers, Ethereum and Solana are the most active, with Polygon in third place.
BNB Chain and Cosmos have steady development activity, but much lower compared to the top three blockchain leaders.
When it comes to the number of code commits per chain (tracking changes to code repositories), the situation looks even worse.
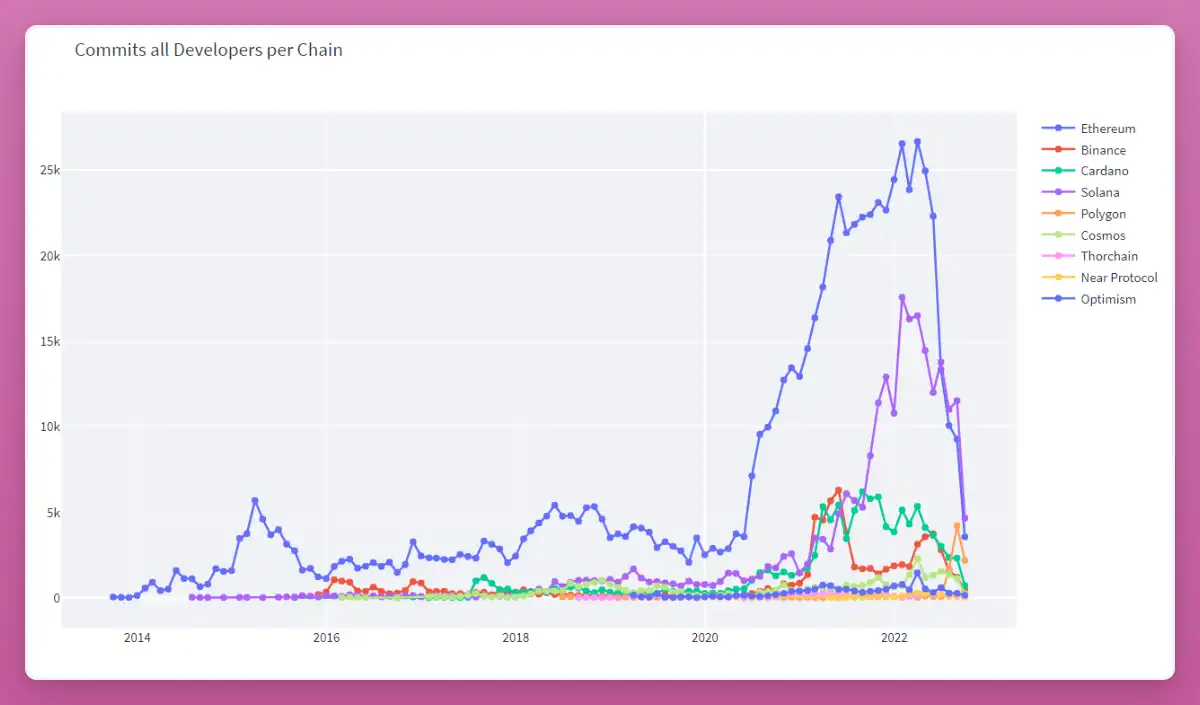
Source: https://leodatavinci-blockdevmonitor-1--chain-activity-dashboard-rbz4 n5.streamlitapp.com/
All blockchain code changes have significantly decreased, but Solana seems to have more activity than Ethereum.
Finally, the new developer data for each chain is also not very promising.
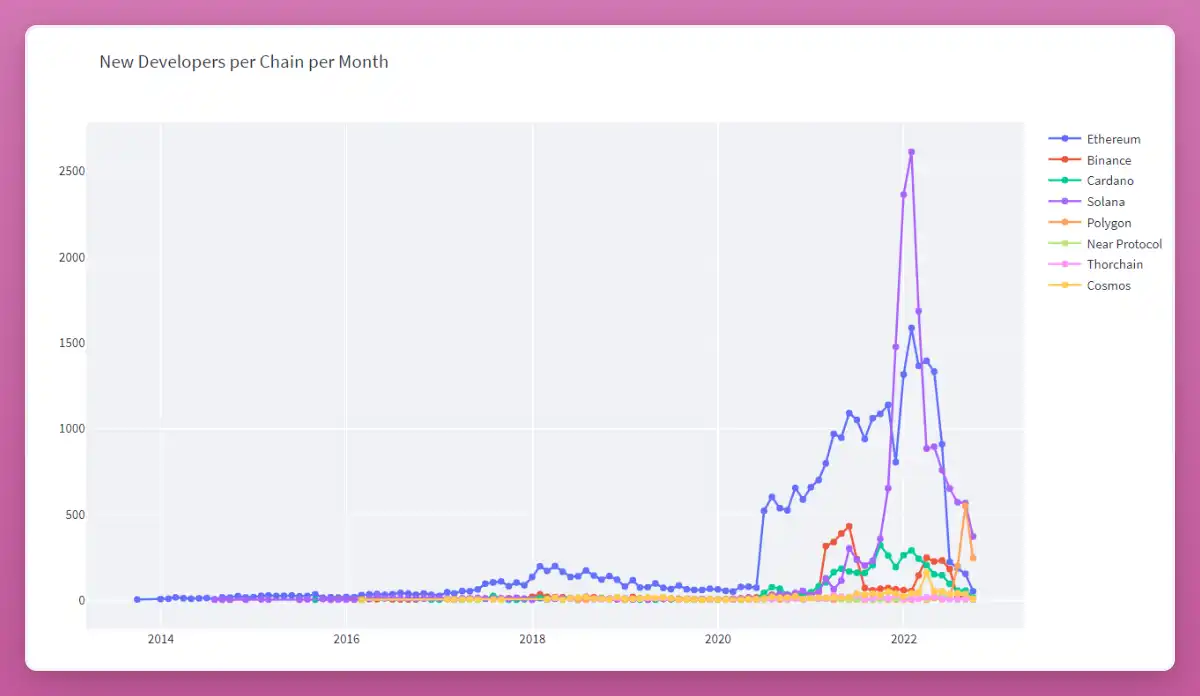
Source: https://leodatavinci-blockdevmonitor-1--chain-activity-dashboard-rbz4 n5.streamlitapp.com/
Interestingly, in the past month, there have been more developers joining Solana and Polygon than joining the Ethereum ecosystem.
4. Smart Money Holdings
Smart Money on Nansen refers to cryptocurrency entities that are considered knowledgeable, well-informed, or "in the know" when trading or investing.
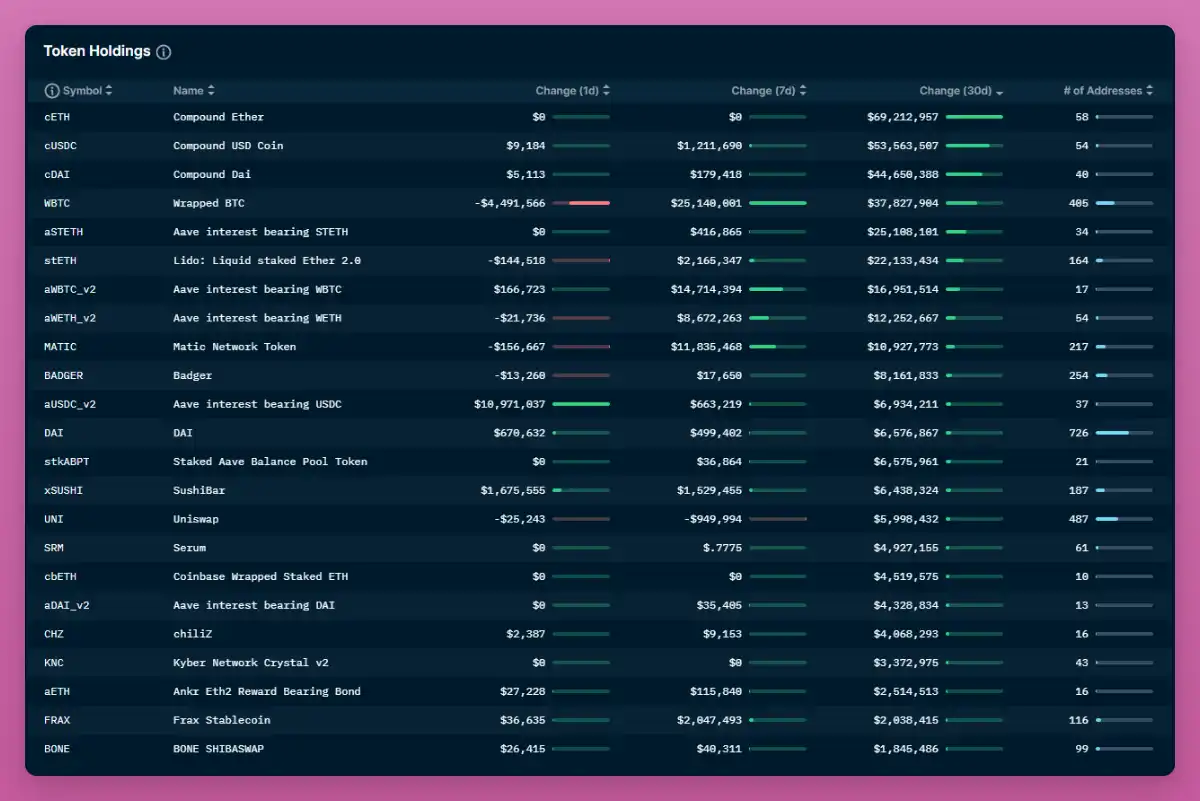
https://pro.nansen.ai/smart-money/holdings
Over the past 30 days, we have observed Smart Money moving funds to Compound, Aave, and wBTC. They are also accumulating MATIC, UNI, SRM, CHZ, KNC, and Shiba Inu's BONE (anticipating Shiba's L2 launch).
5. Weekly DEX Trading Volume
The weekly trading volume of DEXs has been declining but remains at $80 billion.
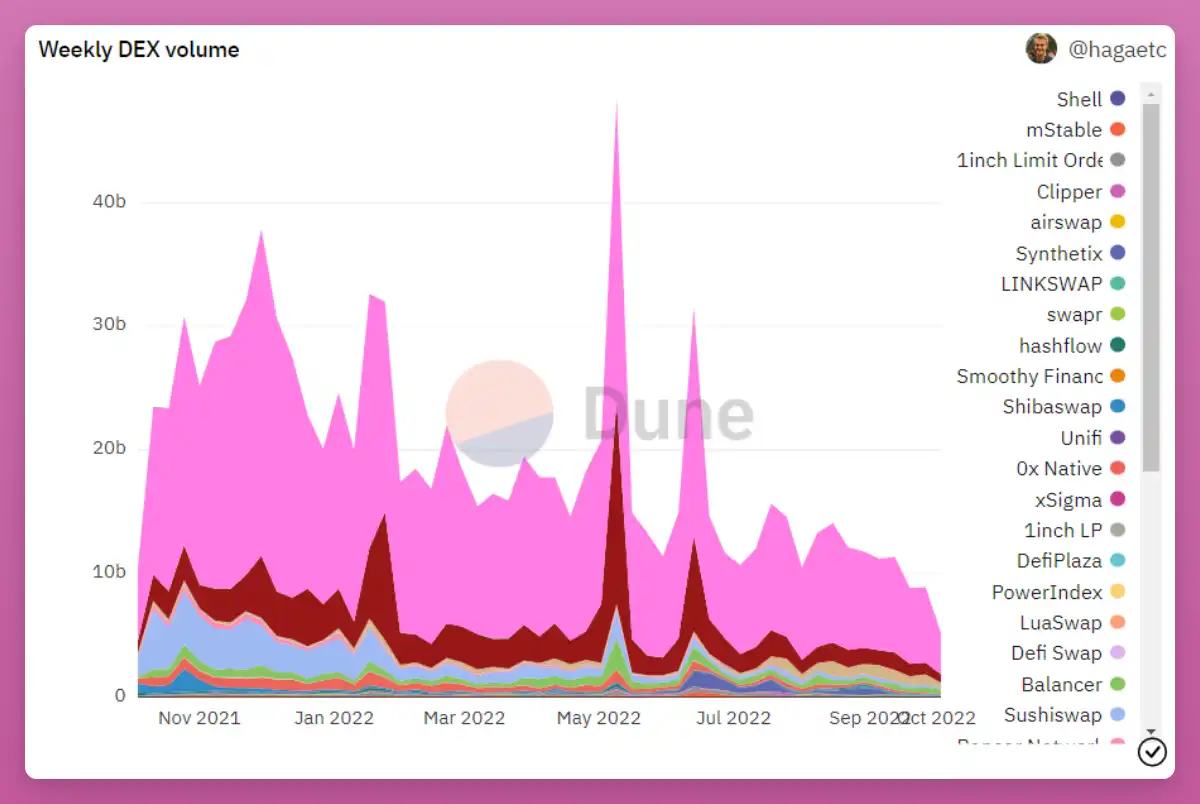
Source: https://dune.com/hagaetc/dex-metrics
Top 5 DEXs by 7-day trading volume:
Uniswap $54 billion Pancakeswap $13 billion (data not included in this Dune table as it is from DefiLlama) Curve $9.745 billion Dodo $7.31 billion Balancer $6.01 billion Sushiswap $1.7 billion
Most of Dodo's volume comes from stablecoin pairs.
6. DEX to CEX Spot Trading Volume
Centralized exchanges dominate decentralized counterparties.
This ratio reached a historical high of around 25% in February 2022 but has since dropped to around 12%.
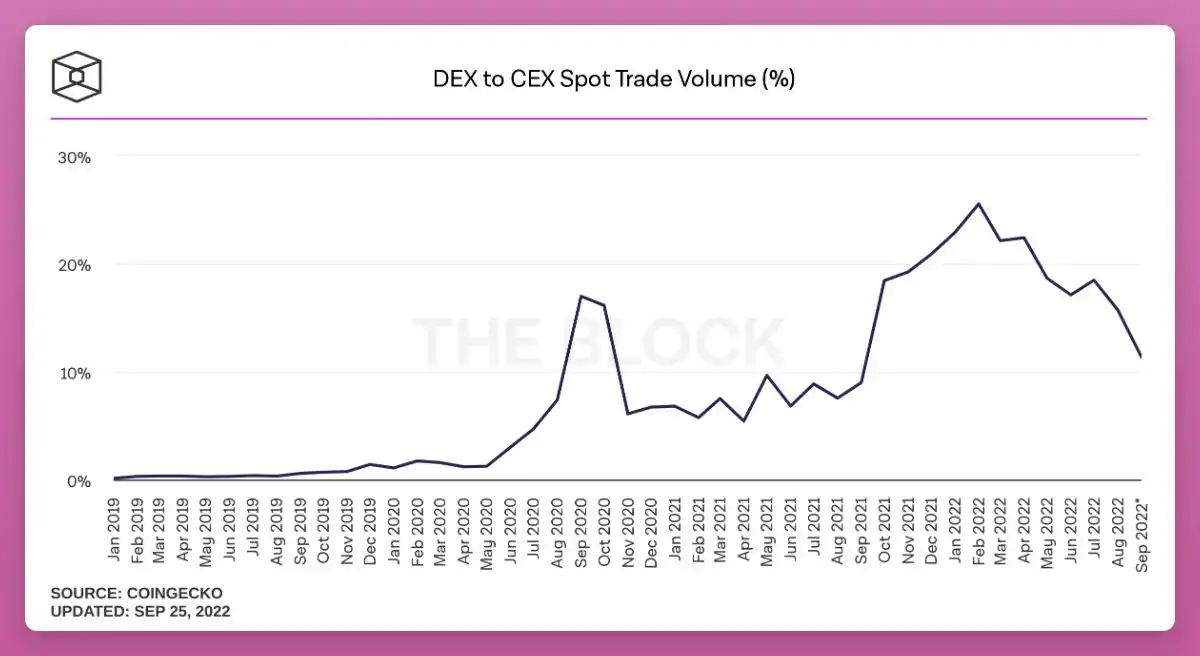
Source: @TheBlock__, data @congecko
Remember how cheap it is to trade on a CEX; this ratio isn't bad!
7. Stablecoin Yield
The days of high yields are long gone.
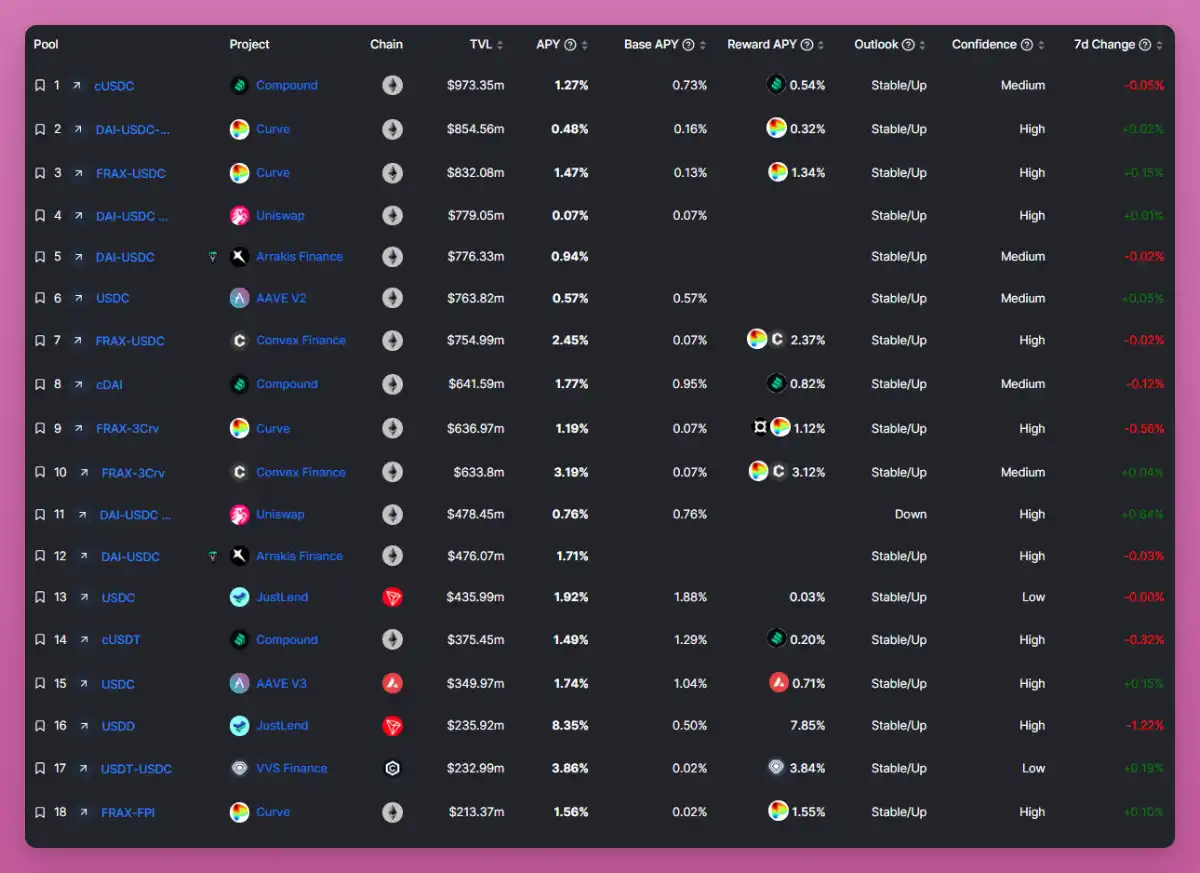
Most stablecoin lending rates on Compound, Curve, Uniswap, or Aave range from 0.1% to 1.5%.
Considering risk-adjusted returns, Convex FRAX-USDC at 2.45% or FRAX-3 CRV at 3.19% could be the optimal choices.
Source: https://pro.nansen.ai/smart-money/holdings
However, only Tron's USDD depositors can earn significant yields.
But please DYOR (Do Your Own Research) on USDD before depositing, as USDD is centrally issued, and the issuance/redemption policy is not transparent.
8. On-Chain Stablecoin Ratio
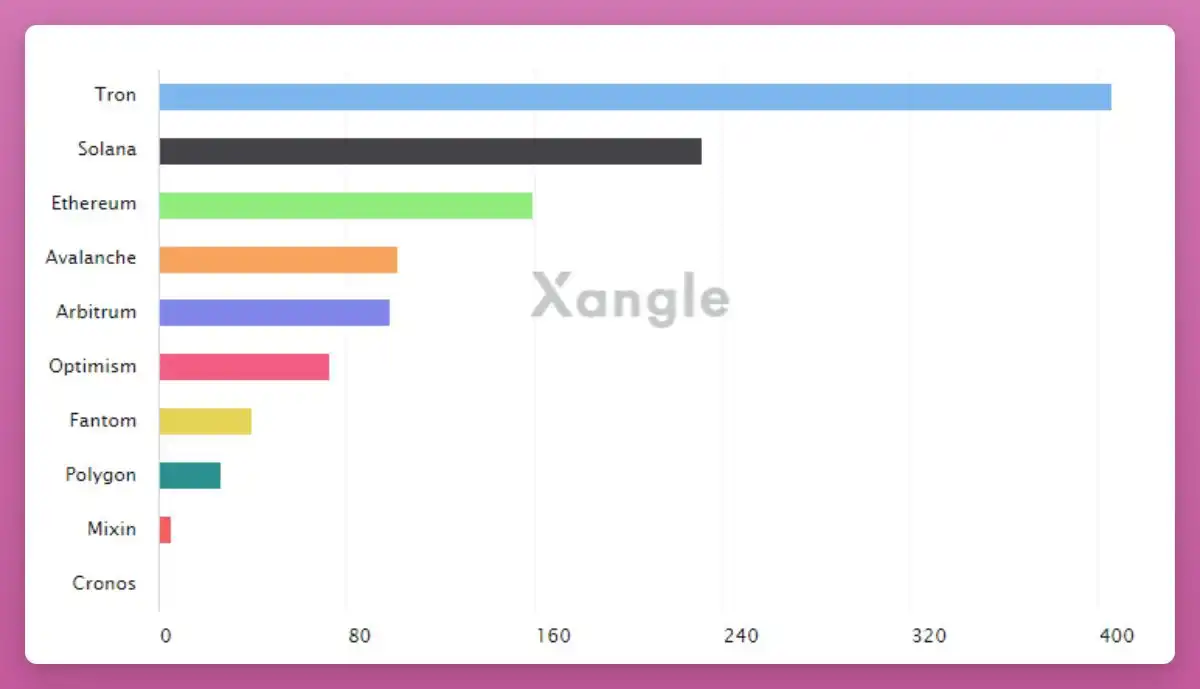
This ratio shows the comparison of stablecoins to the DeFi TVL held on each chain. Tron is the blockchain of stablecoins.
Source: https://xangle.io/en/analytics/CHAINS/tvl
The market cap of stablecoins on the Tron network is four times the entire on-chain DeFi TVL.
9. Staked ETH Amount
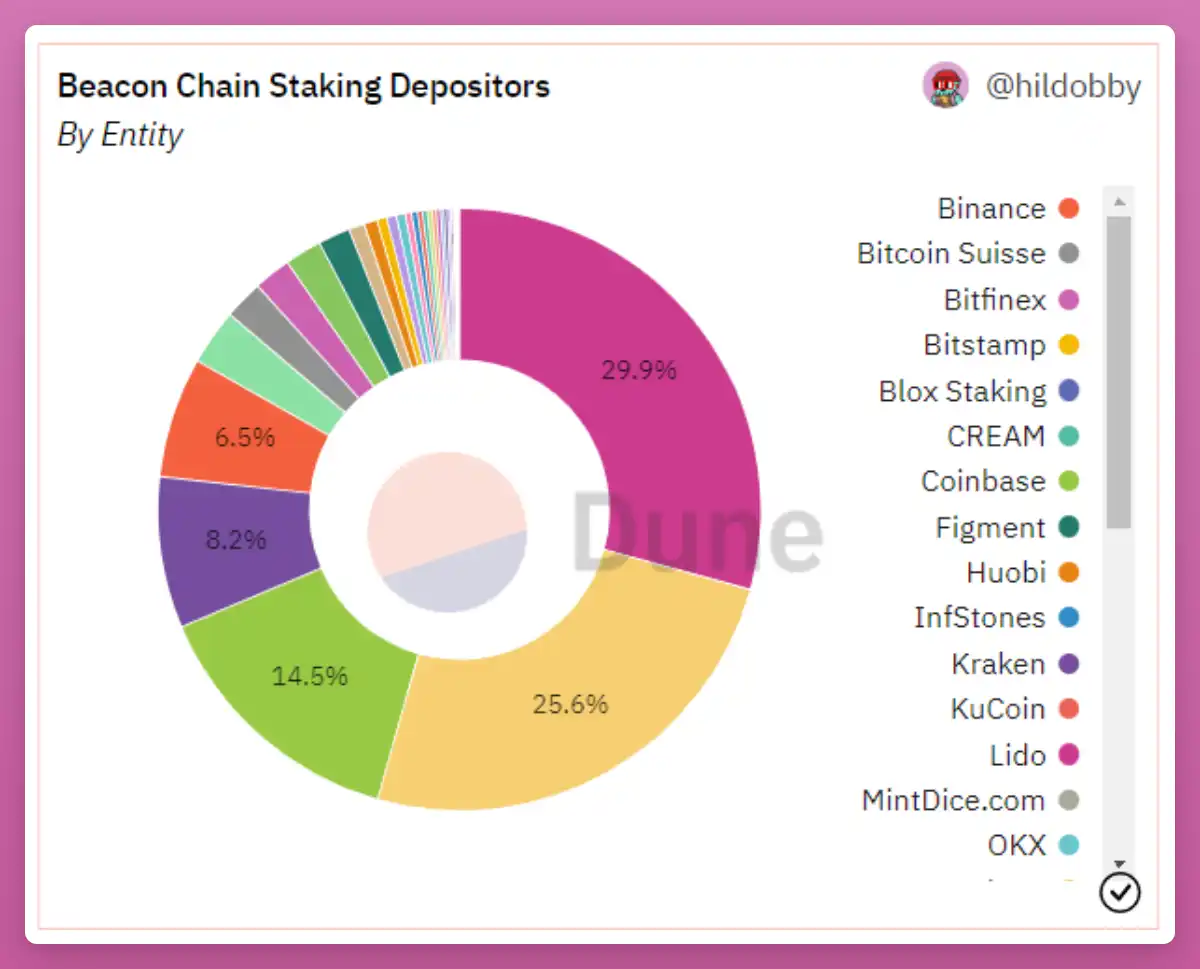
A total of 14.1 million ETH (11.7% of total ETH supply) is staked, worth $19.4 billion.
Source: https://dune.com/arch1111/eth-staking-dashboard
Top 5 staking entities by market share:
Lido 29.9% Coinbase 14.5% Kraken 8.2% Binance 6.5%
Staked.us 2.9%
Liquid staking represents 33.4% of all staked ETH. Lido is dominant, but RocketPool's share has recently grown to 1.95% of all staked ETH.
10. Top Earning Project/dApp
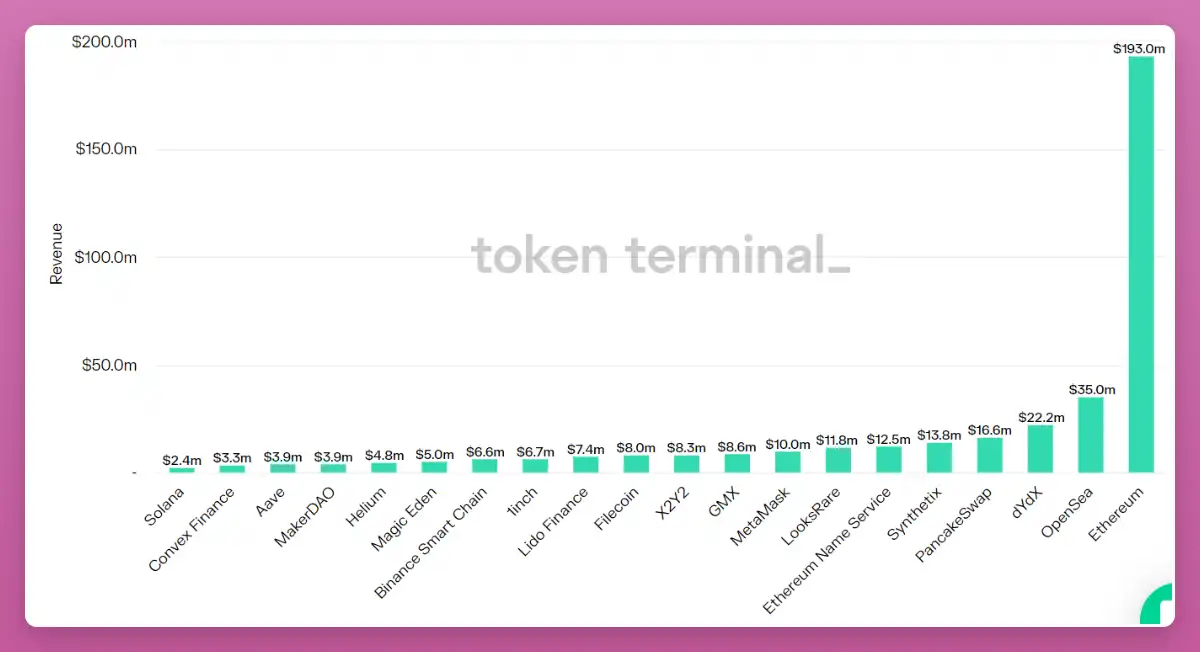
Token Terminal tracks crypto projects based on cumulative revenue.
Source: https://tokenterminal.com/terminal/metrics/protocol-revenue
Ethereum leads with $193.1 million in revenue over 90 days. Following closely are:
OpenSea $35 million dYdX $22.2 million PancakeSwap $16.6 million Synthetix $13.8 million ENS $12.5 million
Interestingly, Solana's low transaction fees also mean low revenue.
11. Revenue Distribution
This DefiLlama table shows fees generated by protocols that flow into the treasury or holders.
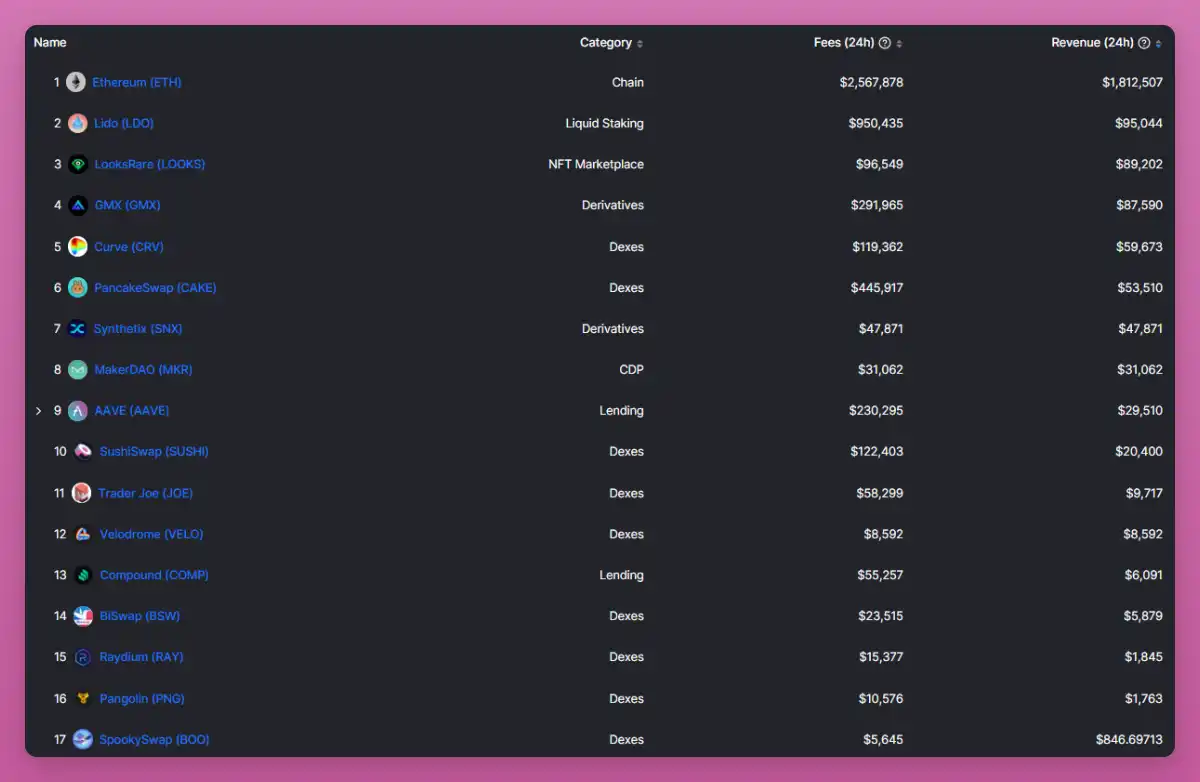
Source: https://defillama.com/fees
While some protocols generate high fees, the actual revenue is very low.
For example, Lido generated $950,435 in the past 24 hours, but only 10% ($95,044) of that was allocated to Token holders or the treasury.
Ethereum once again emerged as a clear leader, with $1.8 million flowing to stakers daily.
12. DeFi Protocols Ranked by Treasury Size
The treasury is the dollar value of the on-chain protocol funds (including undistributed governance Token s).
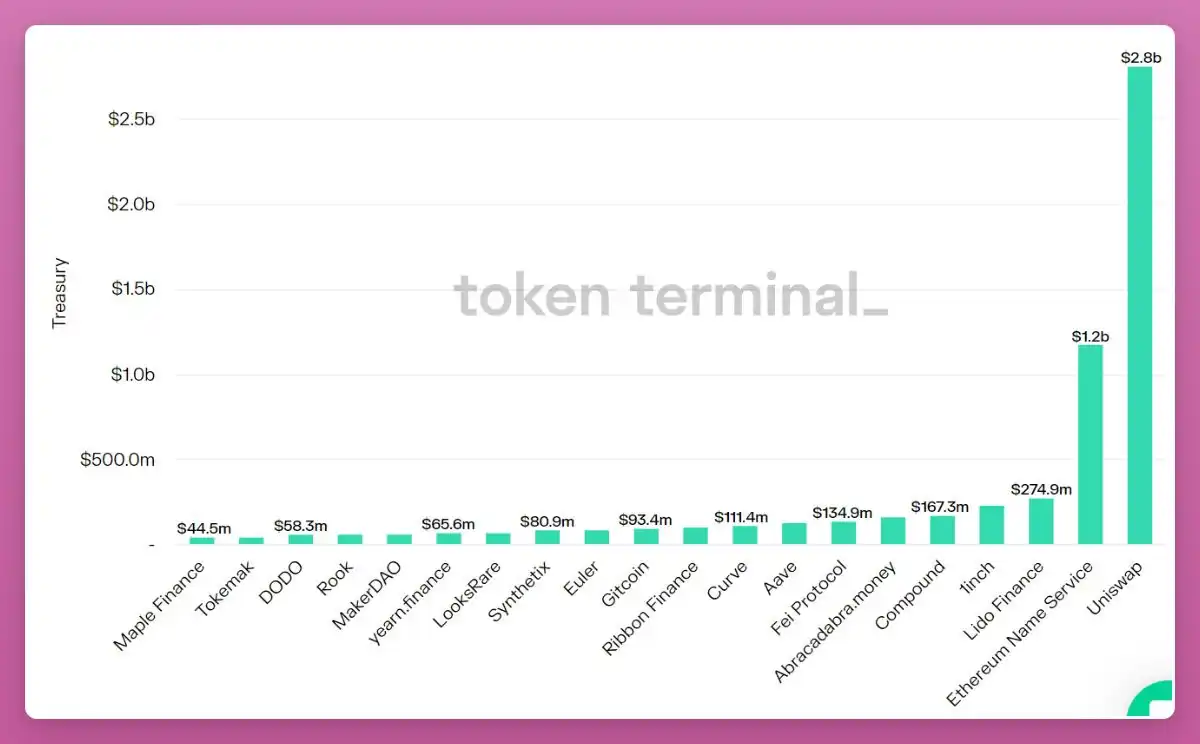
Source: https://tokenterminal.com/terminal/metrics/treasury
Uniswap boasts a $28 billion treasury asset! The Ethereum Name Service (ENS) also surprisingly finds itself in a favorable position during a bear market, with a treasury size of $12 billion.
Higher funds allow projects to hire more people, build new features, and expand operations.
13. Losses Due to CeFi and DeFi Scams, Hacks, and Exploits
According to Defi Yield App's data, a total of $600 billion was lost due to scams, hacks, rug pulls, or other attacks.
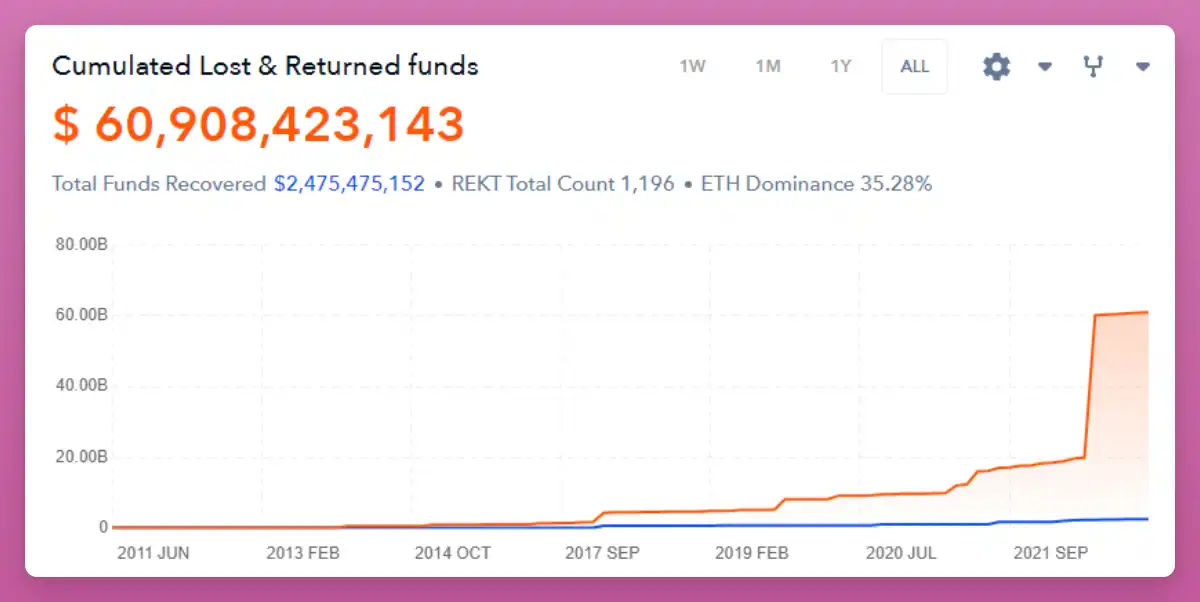
Source: https://defiyield.App/rekt-database
Terra alone lost $400 billion.
2022 Other Major DeFi Hacks and Losses:
Ronin Network—$625 million Wormhole—$326 million Nomad Bridge—$190 million Beanstalk—$181 million Wintermute—$162 million
14. Blockchain Fund Loss
More importantly, DeFi Yield App data shows a significant fund loss on the blockchain.
BSC gained notoriety during DeFi Summer for frequent hacks and rug pull events. Ethereum lost more funds over the course of a few months, but in October, BSC reclaimed its "leader" position.
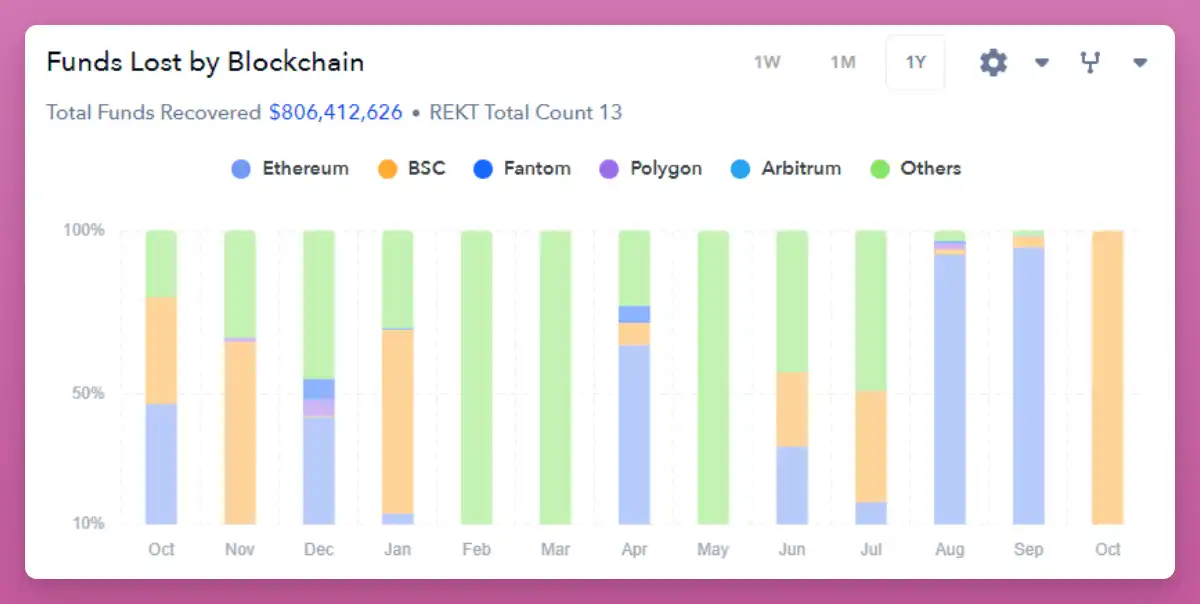
Source: https://defiyield.App/rekt-database
15. Types of Hacks
According to a Chainalysis report, in the first 3 months of 2022, DeFi protocols accounted for 97% of all stolen cryptocurrency.
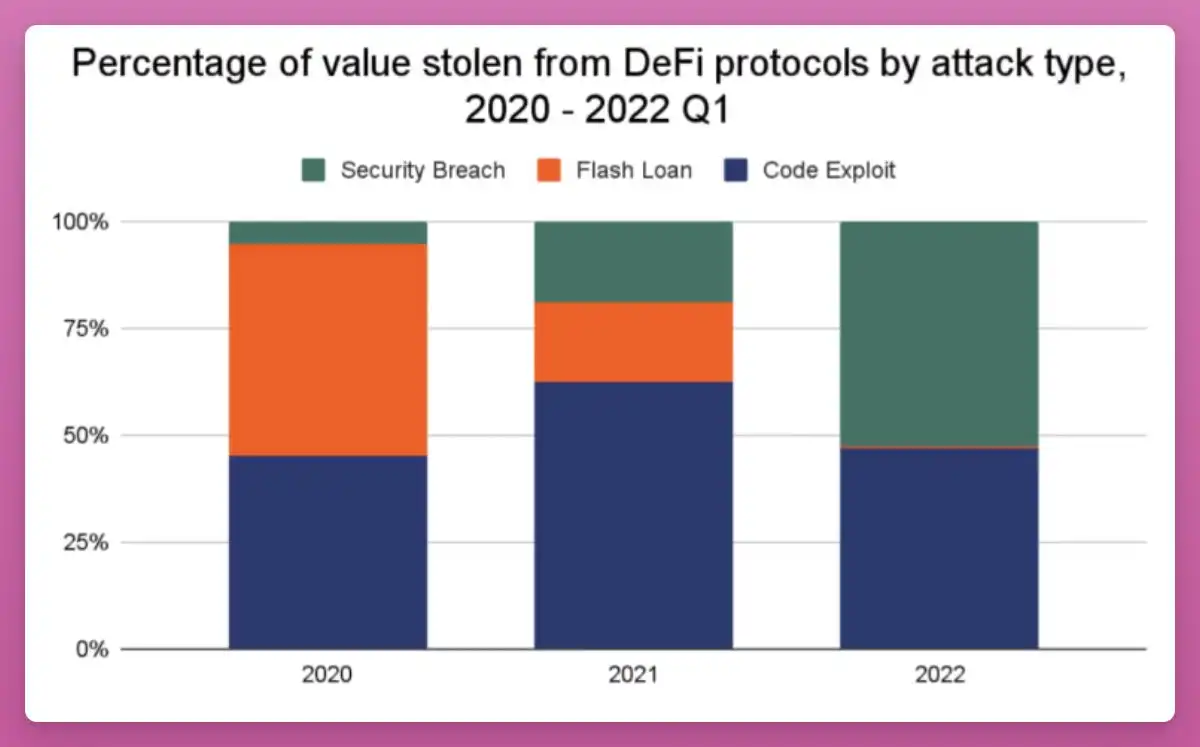
Source: https://go.chainalysis.com/2022-crypto-crime-report.HTML
Good news?
Flash loan attacks have nearly disappeared in 2022. Most hacks now result from security vulnerabilities or code issues.
Original Article Link
Welcome to join the official BlockBeats community:
Telegram Subscription Group: https://t.me/theblockbeats
Telegram Discussion Group: https://t.me/BlockBeats_App
Official Twitter Account: https://twitter.com/BlockBeatsAsia