Why is it possible that all your Uniswap v3 liquidity staking calculations are wrong?
Original title: "All your Uniswap v3 liquidity staking calculations are completely wrong! This is why"
Original author: Ivan Vakhmyanin, Coinmonks
Original compilation: RR
This article comes from WeChat public account: Old yuppie
Uniswap is Ethereum and the entire area The largest decentralized finance (DeFi) project in the blockchain industry. Thousands of liquidity providers use this data every day to formulate their own investment strategies. So how could these numbers be inaccurate?
Let's go step by step, starting with the problem.
The Problem
First, what is TVL and how is it used? In short, TVL is defined as the dollar value of all crypto assets currently entrusted to a blockchain or protocol by users. These assets could be the total liquidity of a decentralized exchange, cross-chain bridge protocol or lending protocol, or the total collateral assets of a PoS blockchain.
Cryptocurrency market investors and other participants use TVL in a number of contexts:
Compare protocols. If I were a crypto trader, I would prefer to use DeFi tools with higher TVL such as decentralized trading platforms or cross-chain bridges.
Measuring protocol growth. If investors see a rapid increase in the TVL of an agreement or project, they will regard this as a bullish signal for the Token price of the agreement.
So, knowing the exact TVL number is important, right?
However, what if I'm misleading when I say the latest data on Uniswap v3 TVL? However, what surprised me the most was that the official Uniswap Chart App also had issues! This is how I found out:
I was working on a liquidity analysis project at the time, combining the official data on Uniswap v3 with the original data I did using the blockchain Compute for comparison. This step is critical to adhere to the highest data quality standards. To start the validation, I chose a popular liquidity pool USDC-WETH (fee level 0.3%).
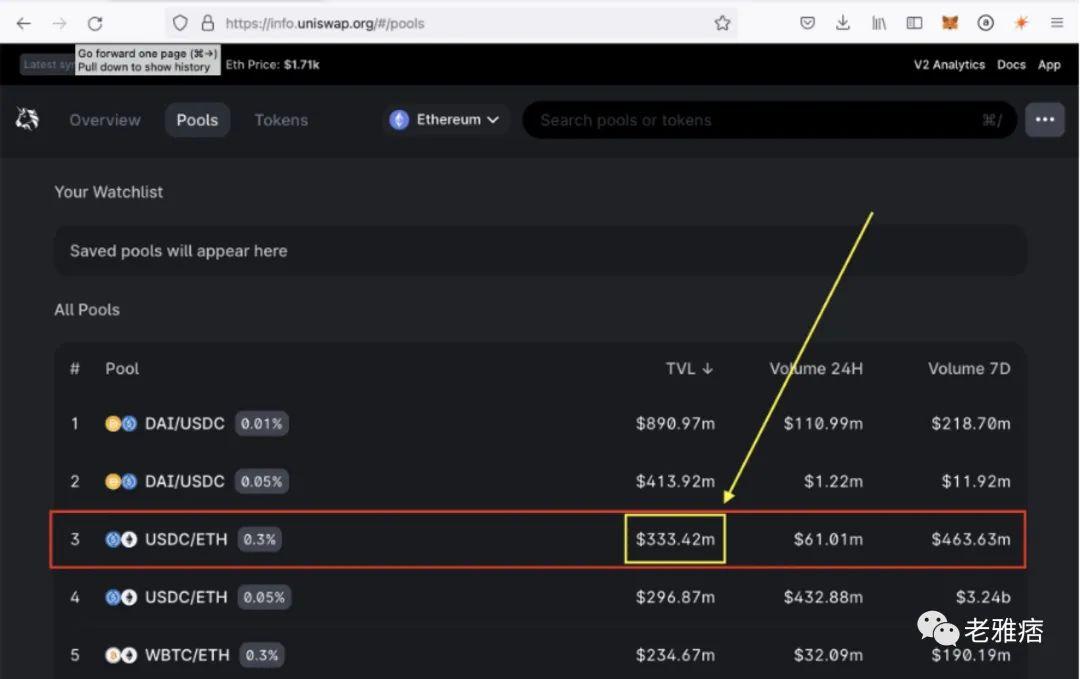
Look at Pool 3 on Uniswap v3 - it has $333M TVL and $61M daily trading volume.
I immediately ran into a problem: the TVL value I calculated was $176 million, not the $333 million reported on the Uniswap website. Well, a bug happened. But before starting to debug, I decided to verify the TVL on Etherscan, the most popular Ethereum blockchain explorer. Strictly speaking, each Uniswap v3 pool is a smart contract. Therefore, the blockchain browser can display the Token balance in the pool, which is TVL.
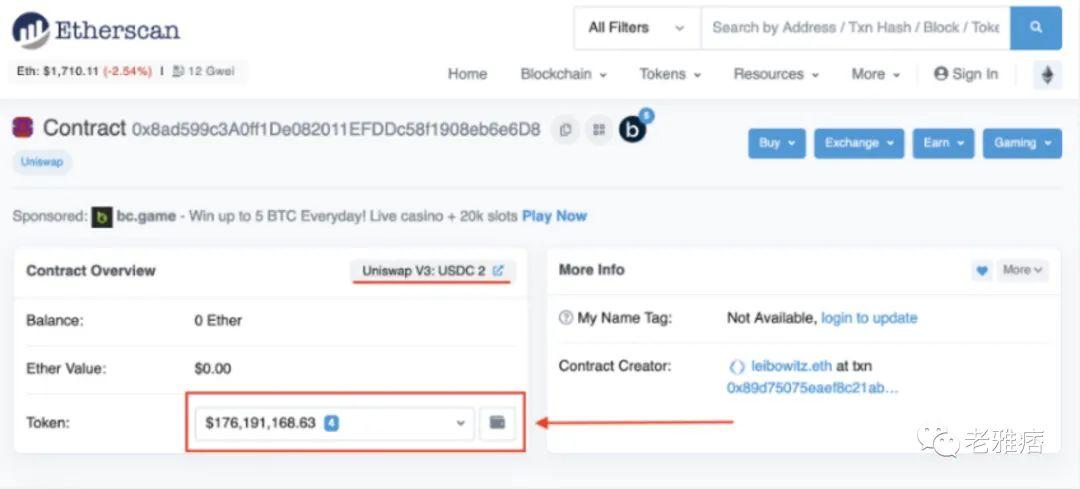
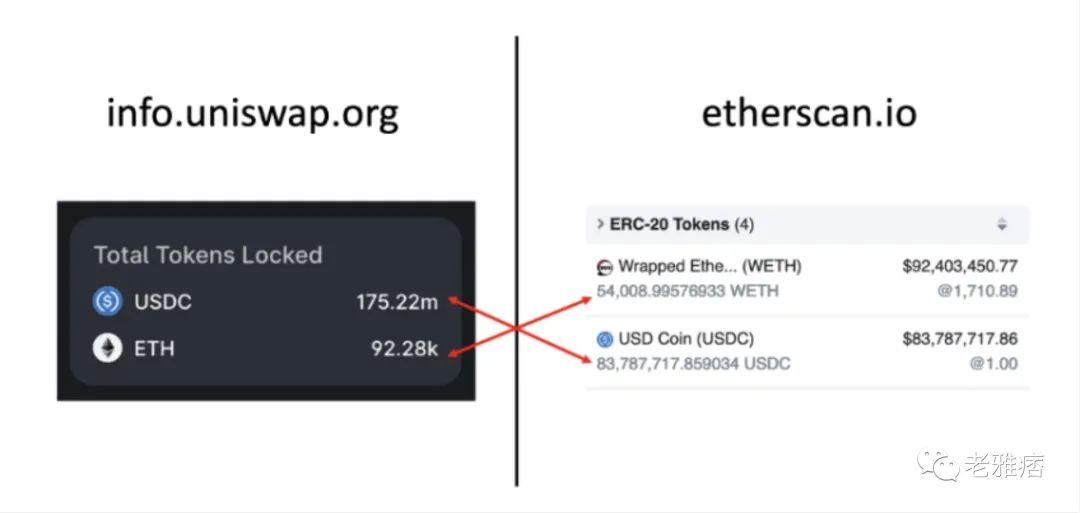
I expect the Token balance of the fund pool to be slightly higher than the TVL reported by Uniswap. This is because the pool not only holds liquidity, but also fees that have accrued but have not yet been claimed. But the resulting balance was almost half of what Uniswap reported, and surprisingly, it was the same number as I calculated!
Comparing the liquidity of assets one by one also shows Made a huge difference. At this time, I realized that this mistake had nothing to do with my math ability.
But how is this possible? After some research, I found out that Uniswap relies on The Graph, a decentralized blockchain indexing service. Through this service, any developer can add personal analysis code (called a subgraph) for a specific blockchain data use case and provide analysis through an API.
Uniswap Labs created its own subgraph for Uniswap protocol analysis and made it available through The Graph hosting service. Fortunately, its code is public. Unfortunately, though, its TVL calculation is wrong.
A brief analysis of the code shows that it accounts for all swap and liquidity events, but not fees. Uniswap pools have a fee of 0.01% to 1% for each swap. This fee is deducted from the trading assets and accumulated to the liquidity provider. In turn, liquidity providers can charge accrued fees at any time.
However, the current Uniswap v3 subgraph shows numbers as if fees were never accrued and charged. Therefore, the TVL data of Uniswap v3 does not match reality every time it is swapped.
You may be thinking: "Before writing this article, did you submit an issue ticket on GitHub?" Yes, this is after I found the error first intention. do you know? This issue has been logged and was created by core developers in November 2021!
So, why hasn't this problem been solved? I have no idea. Perhaps this error was negligible when found. However, this is a cumulative error that increases with each swap. Therefore, as pool fees and transaction volume grow, the TVL discrepancy created by this bug will result in a larger and larger discrepancy from reality. We can see that in large pools like USDC-ETH with fees as high as 0.3%, things are getting out of hand! The current figure is almost double the true figure.
Let's verify the total TVL
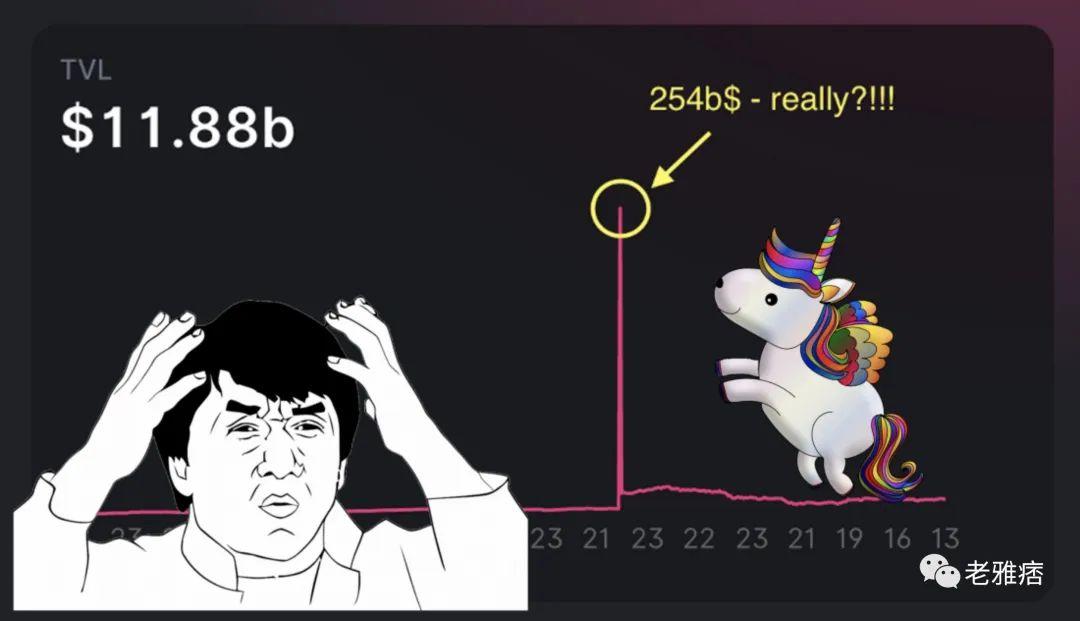
Okay, we now know the pools The TVL numbers in are distorted. Below we explore how this affects investment decisions. But before we get started, let's see how these bugs affect the total TVL of the Uniswap v3 protocol. As of this writing, TVL is reported to be nearly $12 billion.
Even if you are not a data scientist you can see that there is a problem here.
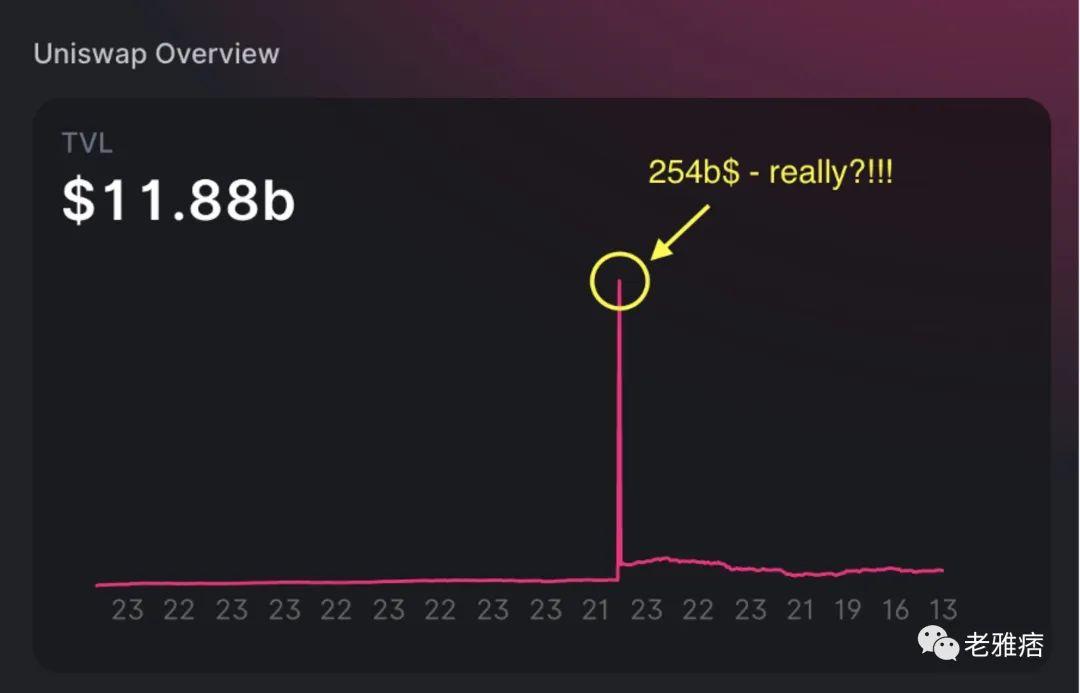
We can see above that TVL is slowly but steadily increasing from $500 million on March 6, 2022 increased to $4.5 billion. Then something crazy happened, TVL was reported as $254 billion on March 7, 2022. This is 2.5 times the highest TVL ever recorded for the entire Ethereum network - in one day! Clearly, the data is wrong. In the following weeks, TVL was reported as $10-20 billion.
At this point, I've lost all trust in Uniswap's analytical data. But how do we know the true TVL? I have two options.
Option 1: Fork and fix the Uniswap v3 subgraph. The downside of this option is that subgraph reindexing can take several days. And I don't like the GraphQL language used by The Graph.
Fortunately, I still have option 2: Datamint, a high-performance analytics database for all Uniswap v3 and Ethereum data, ready for complex online queries.
After some experimentation, I created the following algorithm to calculate TVL accurately.
1. Use these two steps to calculate TVL for all existing Uniswap v3 pools.
2. Add all ERC-20Token transfer pool contracts (including all unclaimed fees), and match the Token balance on Etherscan
3. Add all liquidity activities and then add all swap activities to explain the fees
4 、Comparing the two methods to ensure that there are no unexplainable differences
5. Delete the abandoned pool and empty pool with the number of swaps less than 50 or 0.00000000000001 Token (detected 7863 pools (including 2,083 pairs of stablecoins), my algorithm removed 112 pools as empty/abandoned pools)
6. Find a stable currency path for each Token, and convert the TVL of the fund pool into a dollar value
7. Remove the problematic low liquidity of the dollar value pools, as some pools show insufficient value after liquidity is completely removed (see image below for reference)

< /p>
8. Convert the TVL of all remaining currency pairs to USD values and add them up
After many cross checks, I have A TVL result came out:
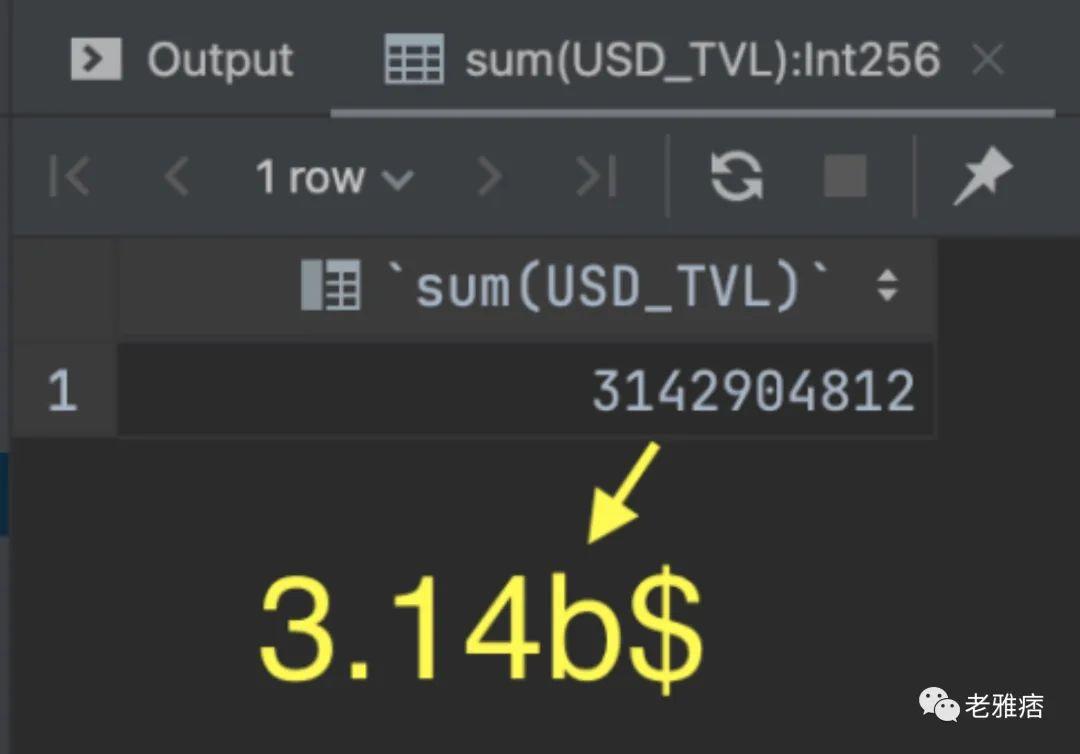
It is almost 4 times less than the reported $11.8 billion.
Disclaimer: My calculations may contain errors. In data projects for enterprise clients, we use documented methods, automated tests and many other tools to achieve the highest data quality. These tools are redundant for a personal research project like this one. This study highlights problems evident in the existing data rather than offering definitive solutions.
OK, we'll fix the TVL calculation. Will this help?
The problem is not the incorrect numbers, but the decisions we make based on those numbers. For example, most profit calculators for liquidity providers use these numbers for forecasting.
However, it is not difficult to correct the calculation of TVL. Uniswap Labs either fix it in their subgraph code, or the calculator devs start using other data sources. The central question is whether we can trust the calculator's predictions to be correct.
I did some calculations and the short answer is - not at all.
I know this is a bold claim. Many liquidity providers use existing calculators and influence decisions that cost tens of millions of dollars. But let's go through the calculation steps so you can make your own judgement.
First, let’s review some core concepts of the Uniswap v3 protocol.
One of its main innovations is centralized liquidity. Essentially, with Uniswap v3, you can choose the price range at which you want your funds to be used as liquidity providers. This is an amazing concept that could bring enormous value to protocol users. Liquidity providers limit their exposure to impermanent losses, and traders can enjoy less price slippage when volatility is lower. But all these potential benefits come at a price, and that is complexity.
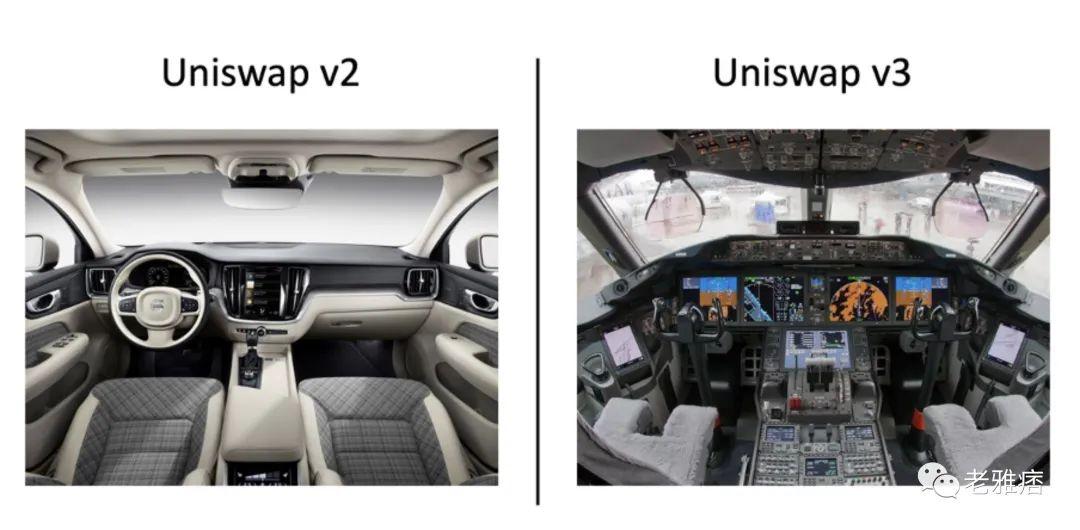
Therefore, we would like to understand how the income of Uniswap v3 liquidity providers is calculated.
In Uniswap v3, liquidity providers choose the price range at which they want to provide liquidity. Once the price is within this range, he will get a share of the swap fee. At first glance, liquidity providers want the widest possible price range for their liquidity positions. Liquidity, however, is distributed proportionally across this range. Therefore, the wider the transaction range, the lower the swap fee per transaction.
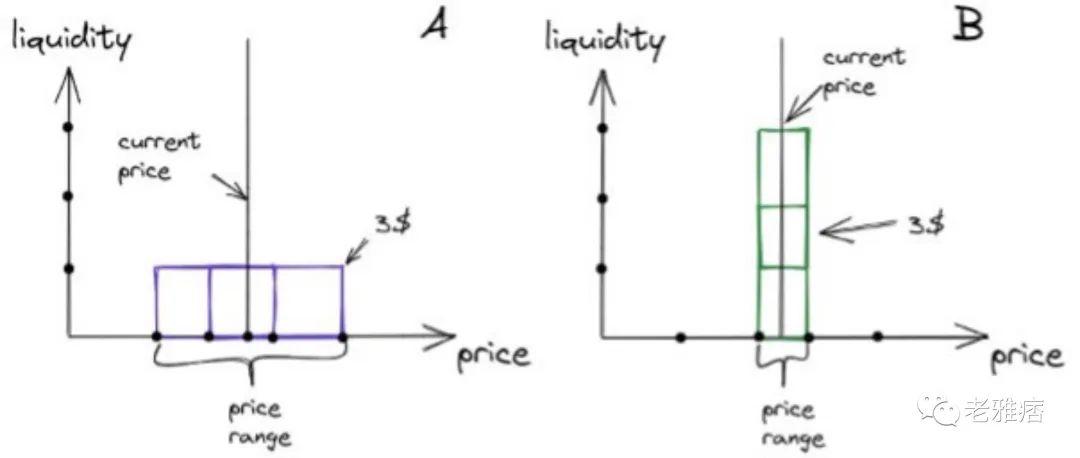
In this example, option A shows that the liquidity provider has chosen a wider price range, option 2 shows a narrower price range for the same amount. If in both cases the price is within the selected price range, the liquidity provider gets 3 times more fees in option b. However, if the price volatility is high, the liquidity provider may end up with higher profits in option a.
So choosing the right price range really depends on finding the best balance between risk and getting a lower return.
There is another parameter that affects the profits of liquidity providers and is often overlooked. I don't know of any LP profit calculator that takes this parameter into account, but it changes everything. You must be wondering what this is by now. That is the distribution of LP. Check out the example below:
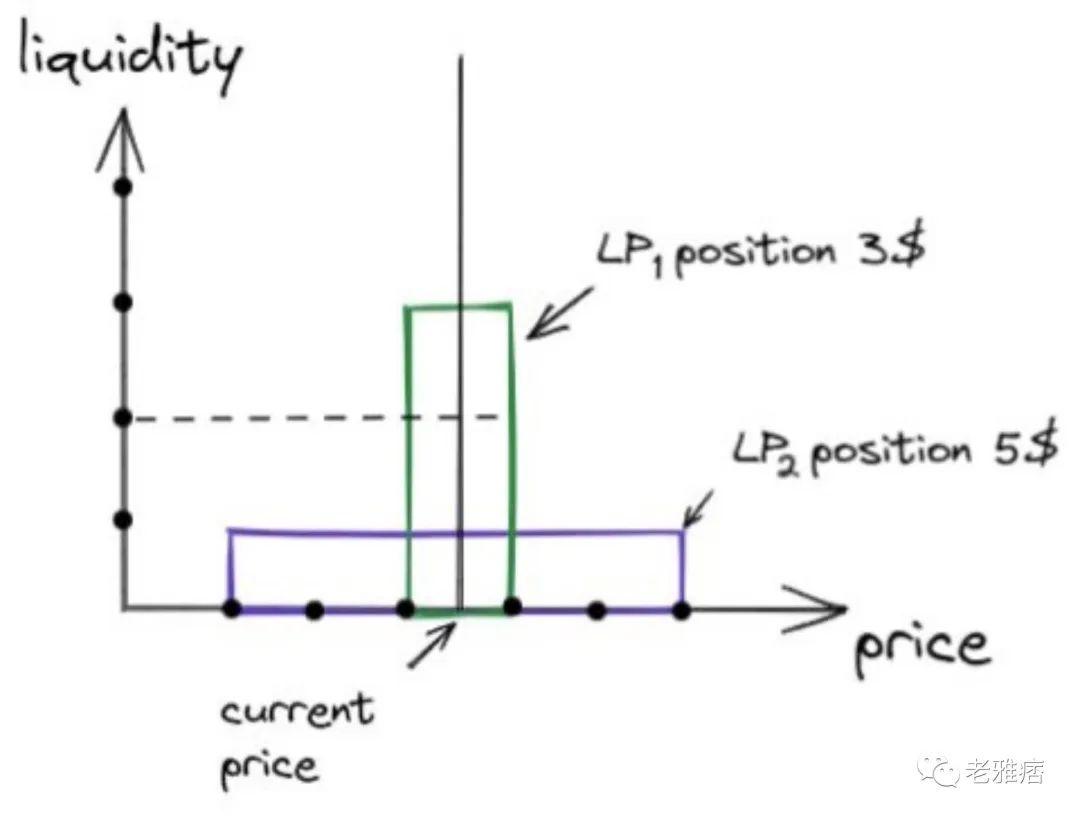
In this example, two liquidity providers (LP1 and LP2) Take a position. LP1 has a narrower position at $3. The LP2 position is wider at $5. In this case, if the price does not go out of the position range of LP1, he will get 3 times more fees than LP2. This is because LP2 is only $1 in this range. This $1 will compete with LP1's $3.
If you look at the liquidity distribution of any Uniswap v3 pool, you will see that it is not even.
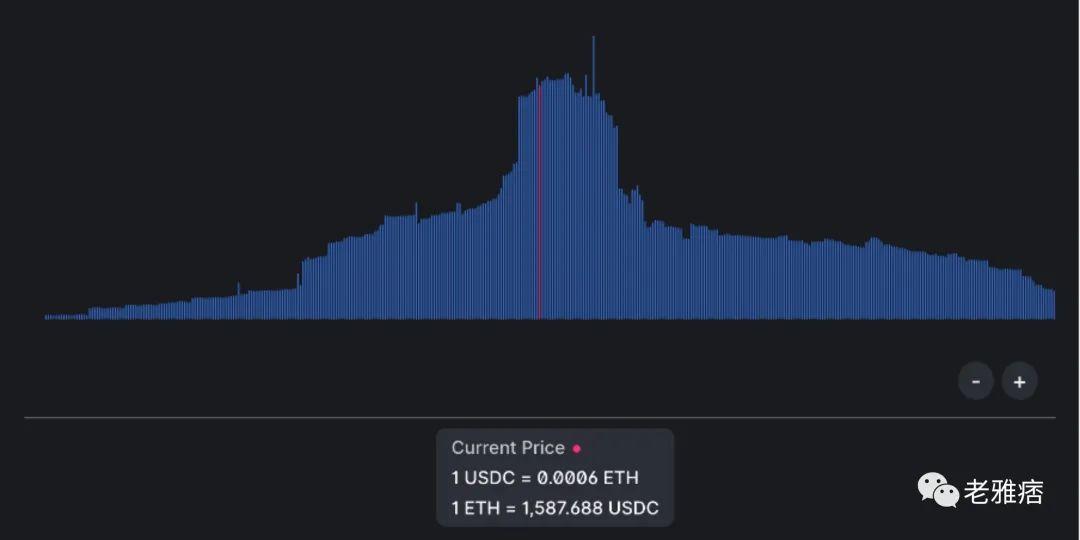
The higher the threshold, the more intense the competition. Liquidity providers need to find a balance between choosing a competitive range and a range with a low probability of price decline. This is why this distribution plays an important role in LP profit forecasting and strategy formulation. The only problem is, I'm not sure if this distribution is calculated correctly.
Liquidity Sniper
As a liquidity provider, you need to guess the price, compete status and volume. If LPs have one desire, it is to know the future of transactions in order to adjust liquidity positions in advance.
But what if I told you it was possible?
During the course of my research, some unusual liquidity providers came to my attention. They add and remove large liquid positions (over $10 million) multiple times a day. Even more surprising is that they always add and remove liquidity on the same block.
Let's see an example:

There are three transactions all in block 15413416, positions 3-5, executed in bottom-up order. The first transaction using the Execute method was a contract called "MEV Bot" that added $22 million in liquidity to the USDC-WETH pool.

The second transaction is from USDC swap to DogeChain through WETH. This is an ordinary swap worth about $16,500.

The third transaction is "MEV Bot" again, removing 2200 from the USDC-WETH pool million dollars of liquidity.
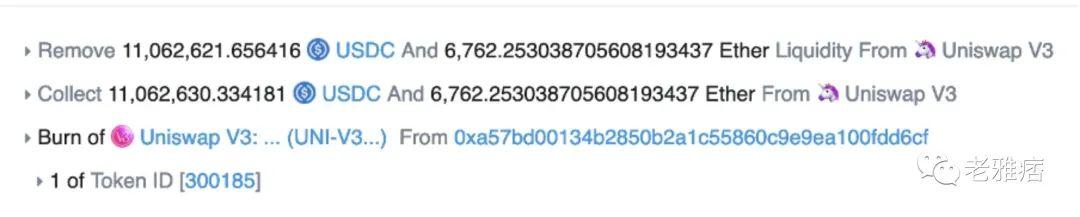
What's happening in this example is called "liquidity sniping". Let me explain how this works:
Someone sends a transaction to swap USDC to DogeChain
MEV Bot detects this transaction in the mempool and activates a private link to the pool using Flashbots technology or similar
MEV Bot pays miners to include a swap transaction and two transactions in a specific order in order to extract value
MEV Bot at a very narrow price Added a lot of liquidity ($22 million) in scope, so in effect, all fee profits from a particular USDC-DogeChain transaction go to him
Then MEV Bot removes liquidity and earns a fee (about $35)
So, after deducting gas fees, his gross profit is about $30. Not a lot, is it? Yes, but he executes this strategy multiple times a minute, and it all adds up to a lot. You can go and see for yourself.
What does this mean for you as a liquidity provider? This means that liquidity snipers can take a significant portion of your fee profits.
Conclusion
Don't get me wrong. I believe Uniswap is a great project with huge potential. I also respect the idea of centralized liquidity at the core of Uniswap v3. However, I find that the analytics part of the Uniswap ecosystem is far from mature. I'm sure this will change soon!
Let me summarize my findings:
TVL data in Uniswap v3 chart Very inaccurate. All analytical tools that rely on the official Uniswap v3 subgraph suffer from the same error.
The total TVL of Uniswap v3 is $3.14 billion, while the official website reports a figure of $11.8 billion (at the time of writing).
The Uniswap v3 liquidity provider calculators are of little value for real strategy as they don't take competition and liquidity blockers into account.
Fortunately, you can now better understand how Uniswap v3 liquidity pools actually work, and Adjust your research accordingly.
I can't offer financial advice, but I think there are only two ways to build a prominent liquidity provision strategy:
Simple type. Use historical data. Try holding liquid positions with small amounts of collateral to see which option works better. Obviously, this only works if the market is stable.
Advanced. Do your research and optimize your LP strategy accordingly. As mentioned earlier, this requires a deep understanding of the Uniswap v3 protocol, as well as mathematical and game theory capabilities, as well as powerful data analysis tools to process large amounts of data in real time.
These two options have one thing in common - base your decisions on data rather than intuition or random tools. Working with data is hard at times, but it pays off.
Original link
Welcome to join the official BlockBeats community:
Telegram Subscription Group: https://t.me/theblockbeats
Telegram Discussion Group: https://t.me/BlockBeats_App
Official Twitter Account: https://twitter.com/BlockBeatsAsia

 Related Articles