The market fluctuated violently, and what signal did the Federal Reserve meeting that raised interest rates frantically reveal?
Original author: Alf
Original compilation: Jack(0x137), BlockBeats
This Fed FOMC meeting was interesting. As always, the real "devil" is in the details, so let's take a look at some of the most interesting nuances and market implications.
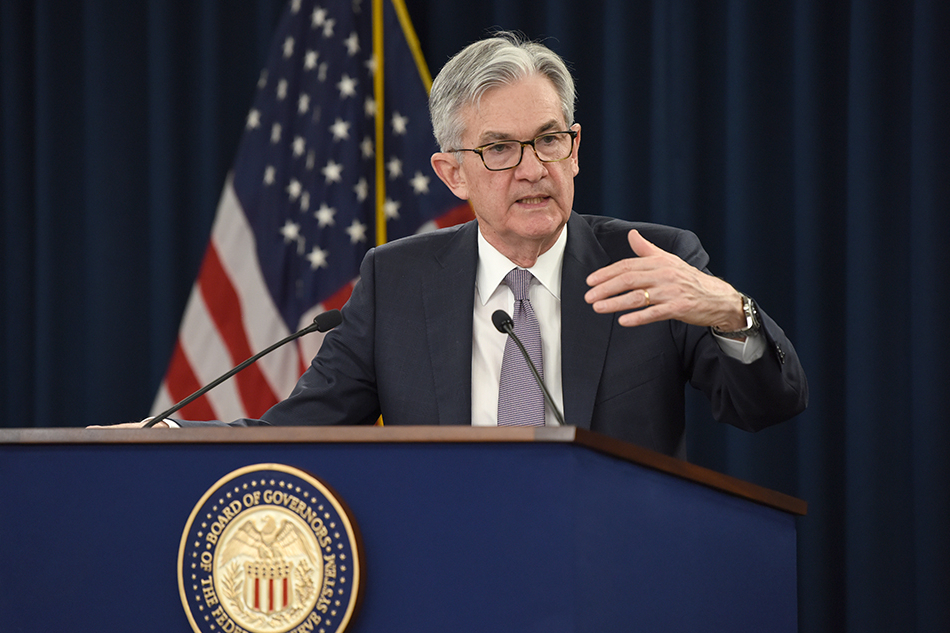
"Trust me, we're austerity enough to bring inflation down to 2%" That's what Powell said at the end of his press conference, and the strong message is reflected in the updated dot plot.
Interestingly, FOMC participants on 12/19 expect federal funds to be released by December 2023 The interest rate will be between 4.50 - 5.00%. Despite the poor predictive power of the dot plot, its signaling effect is clear - the Fed is prepared to keep tight conditions for a long time.

Will the market (blue) pay for such an aggressive bitmap (orange)?
The answer is, so-so. OIS markets are pricing in a similar terminal rate of 4.6%, but it's really hard to believe the Fed can keep rates above 4% for 2 years.
(Recession) Data > Dot Plot.

Powell referred to the late 1970s several times during the meeting: premature easing of monetary policy while fighting inflation could have adverse as a result of.
The core PCE has basically not shown a straight-line downward trend, let alone a pause in tightening policies , "We'll keep going until the job is done."

The "necessities" inflation Powell mentioned also seems relevant, as if as long as it's around, low earners will take advantage of the still tight The labor market, to demand further increases in their own wages.
After all, in terms of consumption expenditure, low-income people represent an important group.

Overall, this is another reiteration of the Jackson Hole speech: the Fed will hang on until the job is done, and they understand that pain is crucial to reducing the necessary for inflation.
But if the CPI cannot be reduced, more costs will be incurred in the future. In other words, the Fed is not inverting.
Before we turn to market implications, I find it interesting that Powell is completely dismissive of selling mortgages securities. Low-probability, high-impact event: It would "help" the Fed further weaken the housing market, but it could also cause surprises in the market. So leave it alone for now.
Turning to the market, let's look at bonds first.
Real yields were largely unchanged, but Powell will be pleased to note that the entire real The yield curve (orange) is well above 0% - there is room for tightening to last longer. And that wasn't the case 3 months ago (yellow).

High real yields in the bond market are not necessarily positive for risky assets. But if real growth is also slowing, they become one - and that's exactly what's happening now.
The harder the Fed tightens, the more long-term damage it will do to future growth. The clearest expression is the slope of the yield curve, which has once again begun to flatten dramatically.
U.S. 2s10s OIS curve trading at minus 90 bps, more aggressive Fed policy, inversion more and more.

Damage to long-term nominal growth could be 30-year bond relative to front-end rate levels more relevant drivers.

Overall, when it comes to risk assets, the story is simple: if they rise, financial conditions ease, and the Fed doesn't like it so.
Alternatively, we can simply plot a 5-year bond real rate (orange) vs SPX (blue, inverted) comparison chart, do you see this obvious gap?

Even without downward adjustments to earnings or assuming a larger risk premium, risky assets don't seem like a good investment opportunity here.
My base case is that the SPX will retest the 2022 low.
What about precious metals?
It may also is a positive real interest rate, and alternative and non-interest-bearing forms of money tend to be downgraded. That said, it's not good for gold.
Welcome to join the official BlockBeats community:
Telegram Subscription Group: https://t.me/theblockbeats
Telegram Discussion Group: https://t.me/BlockBeats_App
Official Twitter Account: https://twitter.com/BlockBeatsAsia

 Related Articles