Retrospective analysis of the correlation between Bitcoin and the Nasdaq 100 Index from 2018 to 2022

Original title: "Removing Noise, Finding Signal: 18-22 Years Bitcoin and Stock Market Correlation Analysis"
Original Author: David, W3.Hitchhiker
< br>
Author's note:
General hedge funds will introduce correlation indicators as an important reference for investment and asset allocation. By reviewing the correlation trend between BTC and the Nasdaq 100 Index (NDX 100 Index) in the past four years, it can help us eliminate market noise, eliminate the false and preserve the true, and extract the key factors that really affect the market trend. In operation, grasp the real signal.
Instructions for indicator selection:
NASDAQ 100 Index (NDX100):
In the stock index selection, we mainly consider the Nasdaq 100 Index. The index includes the top 100 largest non-financial companies listed on the NASDAQ market. At present, 56% of the weight in the index is technology companies, including Tesla, Apple, Google, Nvidia, Netflix, etc., followed by consumer service companies, such as Amazon and Starbucks. The market value status of BTC in the currency circle and the industry attributes of the blockchain, NDX100 and BTC have strong similarities and comparability.
Monetary policy and macro indicators:
Considering that the overall currency circle and the stock market have been greatly affected by macro trends and monetary policies in the past four years, various related interpretations on the news surface are overwhelming, and the general investment People often feel overwhelmed by it. This analysis also lists the main indicators of macro and monetary policy. In the extended time dimension, we can make a peek at the real relationship between market trends and macro.
Federal Funds Rate:
The federal funds rate is the target interest rate guideline set regularly by the Federal Reserve Monetary Policy Committee. Banks borrow excess reserves overnight to meet reserve requirements, which can be understood as the minimum cost of funds in the U.S. financial system. The interest rate is one of the important tools of U.S. monetary policy.
U.S. 10-Year Treasury Yield:
The ten-year treasury bond yield can be understood as the lowest cost of capital for enterprises. Investors in bonds, stocks, commodities and real estate generally use the ten-year treasury bond yield as a measure of the opportunity cost of funds, so fluctuations in the ten-year treasury bond yield usually directly affect the pricing of large categories of assets.
Fed Balance Sheet Size:
The expansion and contraction of the Fed's balance sheet is equivalent to the easing and tightening of monetary policy. According to the Federal Reserve's own research, the impact of 2.5 trillion asset contraction is equivalent to a 0.5 percentage point increase in interest rates (Substitutability between Balance Sheet Reductions and Policy Rate Hikes: Some Illustrations and a Discussion1 ). This indicator needs to be examined together with the federal funds rate.
Correlation coefficient (CC) and BTC independent market:
The correlation coefficient is an indicator of the strength of the existing relationship between two different variables x and y. A linear correlation coefficient greater than zero indicates a positive correlation. A value less than zero indicates a negative relationship. A value of zero indicates that there is no relationship between the two variables x and y. Note that CC can only measure the correlation between the two, not the proportion of change in each.
When comparing the BTC price to the NDX100 index, we used the CC indicator (purple area). The larger the purple area on the horizontal line, the greater the positive correlation between the two; the larger the purple area below the horizontal line, the greater the negative correlation between the two; the closer to the horizontal line, the smaller the correlation between the two.
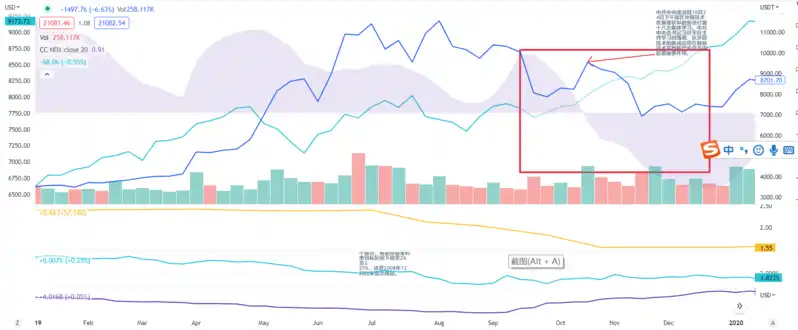
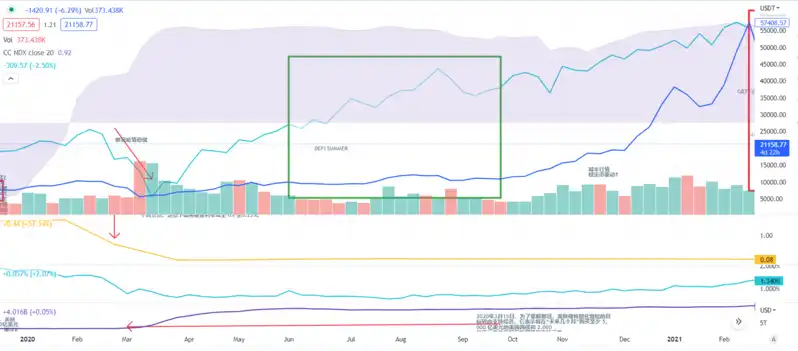
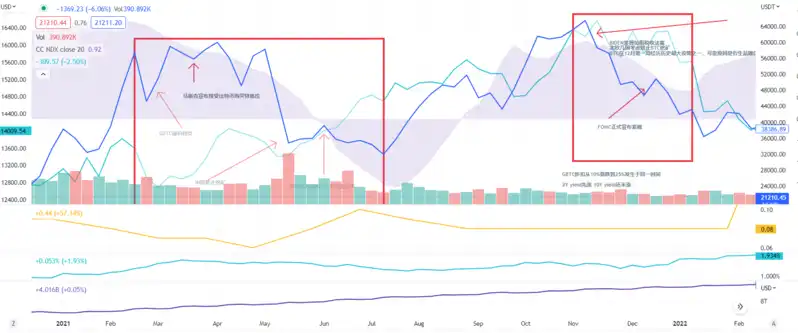
In general, it can be seen from the figure below that the positive correlation between BTC price and stock index is gradually increasing. However, there are also multiple stages in the middle where the trend of the two shows a weakening positive correlation or even a negative correlation interval (marked with a red box). This range shows that BTC has stepped out of the independent market with the stock market, and it is worthwhile for us to focus on the reasons behind it.

2018:

Market Summary:
Macro progress:
On October 31, 2018, the Federal Reserve did not replace the US$23 billion released by the Treasury bonds due on that day with new bonds, thus setting a record for a single week The scale of shrinkage reached a record high, and the Fed shrunk a total of 33.8 billion US dollars that week. As of November 7, the Fed's total balance sheet had shrunk to $4.14 trillion, the lowest level since February 2014, and a total reduction of more than $320 billion.
Independent market for BTC:
In 2018, due to the impact of the ICO bubble burst in 2018, the entire BTC market fell sharply from a high level. For several months, when the stock market stabilized and rose slightly, it did not follow the rising trend, but continued to consolidate at the bottom. The tightening of monetary policy at the end of the year also affected the trend of the stock market and BTC.
2019:
Market summary:
In 2019, the price of BTC resumed its upward trend, rising from 3500 at the beginning of the year It reached around 11,500 in early July, an increase of 228%. It fell in the second half of the year, falling to 6,900 in early November at most, and closing at around 8,700 at the end of the year. During the same period, NDX100 rose from 6800 at the beginning of the year to around 9300 at the end of the year, an increase of 37%.
Macro progress:
In the early morning of September 19, the Fed announced another 25 basis point rate cut, which is the second time the Fed has cut interest rates within 50 days; The gold rate was cut by 30 basis points. Powell said that the question of when to expand the balance sheet will be rediscussed, and the expansion time may be earlier than expected.
At 02:00 on October 31, the Federal Reserve cut interest rates by 25 basis points, and the target range of the federal funds rate was lowered to 1.50% to 1.75%, in line with market expectations. And just after this rate cut, the Fed hinted that it will pause interest rate cuts in the future. The Fed's statement removed language that had said it would "act as appropriate" to sustain the economic expansion, suggesting they believe that policy accommodation may have ended for now. The shrinking of the balance sheet lasted for two years, and the scale of the shrinking balance sheet reached 44600-37700 (September 2019). The total scale of the shrinking balance sheet was 690 billion.
On the afternoon of October 24, the Political Bureau of the Central Committee of the Communist Party of China conducted the eighteenth collective study on the development status and trends of blockchain technology. Xi Jinping, General Secretary of the Central Committee of the Communist Party of China, emphasized when hosting the study that the integrated application of blockchain technology plays an important role in new technological innovation and industrial transformation. For such heavy good news, the price of BTC did not rise but began to fall after the news was released. It is not ruled out that there are big funds to sell the news.
< b>BTC's independent market:
The correlation between BTC and the Nasdaq has maintained a certain degree of positive correlation since the beginning of the year. Until September, BTC began to decline, while the stock market opened up during the same period due to dovish policies such as cutting interest rates and expanding the balance sheet. A wave of big gains during the year, from 7800 to 9000 points, an increase of 15%. We believe that the price of BTC in the first half of the year is partly due to the fact that there are funds to start planning for the BTC halving in May 2020 a year in advance. At the end of the year, BTC did not follow the rise of the stock market. It is speculated that part of the reason was due to large funds selling the news.
Observing the BTC independent market in 2018/19, it was found that BTC did not follow the rise of the stock market when the monetary policy improved twice, and it seems to be still Digest the impact of the 2017 ICO bubble burst.
2020:
Market summary:
In 2020, BTC rose from 9300 to around 38000 at the end of the year, an increase of more than Four times, but most of the increase occurred in the fourth quarter, and the price of BTC in the first three quarters was consolidated around 10,000. In terms of NDX100, due to the new crown epidemic at the beginning of the year, the index fell from 9,000 points to about 7,000 points in mid-March, and then rose under the stimulus of the Fed's easing policy. double.
Macro progress:
On March 15, 2020, in order to alleviate the new crown, the Federal Reserve shifted the goal of quantitative easing to support the economy. The Federal Reserve announced on the same day that the federal funds rate was directly lowered by 1.5 percentage points. Reduce the funds rate to 0% to 0.25%. It said it would buy at least $500 billion in U.S. Treasuries and $200 billion in government-guaranteed mortgage-backed securities "in the coming months." These moves quickly lifted market sentiment, and the stock market came out of a V-shaped reversal.
These policies led to the rapid expansion of the Fed’s balance sheet, from 4.2 trillion in March to more than 6 trillion at the end of the year, less than a year The table has been expanded by more than 50%, which is rare in the world. The federal funds rate has remained near zero throughout the year.
BTC independent market:
BTC maintains a high correlation with NDX100 throughout the year. The stock market rallied. During the DEFI summer in the second and third quarters, BTC was basically consolidating around 10,000, and in the fourth quarter, it went out of a nearly four-fold big market. During the DEFI summer, the amount of funds locked on the entire ETH chain increased sixfold from 20 billion at the beginning of the year to 120 billion at the end of October, attracting a large number of new users in the currency circle, especially institutional users. One of the reasons for the skyrocketing.
At the same time, the output of Bitcoin will be officially halved in May 2020. Although there are already funds in 2019 to expect the benefits of halving, we have observed that the halving In the five months before and after, the price of the currency has not changed much. The BTC market did not start until the fifth month after the official halving occurred.
The big market started in October 2020 and lasted until March 2021. Bitcoin went from 10,000 to 60,000. Did not keep up with the rise (digesting the previous round of bubbles for a long time), experienced one of the largest releases in history, experienced a substantial increase in new investors brought by DEFI summer, and a large influx of traditional enterprises and institutional investors (see Appendix ) and the benefits of halving, surrounded by so many benefits, it feels quite late.
2021:
Market summary:
In 2021, BTC will rise from around 38,000 at the beginning of the year to the top The half-year high was close to 60,000, then adjusted to an annual low of 32,000 in mid-July, and then surged to a peak of around 69,000 in early November, closing at around 43,000 at the end of the year, an annual increase of 43%. The NDX100 index rose from 13,000 at the beginning of the year to 16,500 in mid-November, and closed at 15,600 at the end of the year, an annual increase of 20%.
Macro progress:
Easy policies in response to the new crown epidemic throughout 2021.
At the FOMC meeting on November 3, 2021, the Federal Reserve began to release hawkish signals, announcing that the pace of asset purchases will be gradually reduced, and it will purchase US$10 billion a month in U.S. National debt and $5 billion in MBS.
By the end of 2021, the U.S. inflation rate will reach 6.8%, far higher than the Fed’s 2% target, the overall unemployment rate will drop to 4.2%, and the labor market will be close to the Fed’s "maximum employment" target. At its December 2021 meeting, the Federal Open Market Committee, the Fed's policymaking committee, said a majority of its members expect to raise interest rates by three-quarters of a percentage point in 2022 while reducing the size of its balance sheet. Doubled the speed, reducing US Treasury bond purchases by $20 billion and MBS bond purchases by $10 billion per month. The meeting marked the official start of austerity.
BTC independent market:
BTC has gone through two independent market movements this year, from mid-February to mid-July. to negative; the second time was from the beginning of November to the end of the year, and the correlation showed a significant decline.
In the first independent market, the BTC price tried to break through 60,000 4 times. From May 3rd to 17th, it fell directly from 57,000 to 35,000 in half a month, a drop of 39%. On May 19th, China announced the ban on mining, causing a large number of miners to shut down, and the computing power reached a historical low. After 519, BTC went out of a two-month downward trend, falling from 35,000 to around 32,000.
After the failure of BTC to hit 60,000 for the first time in mid-February, Grayscale’s GBTC market began to undergo significant changes, and the premium of GBTC began to turn from positive to negative. It marks that a large number of institutional disks have begun to stop entering the encryption market, and even began to withdraw.
After failing to hit 60,000 for the second time in March, Musk began to shout for BTC: not only Tesla accepts BTC as a means of payment, but also Tesla The purchase of BTC as a reserve asset was also announced. In hindsight, Internet celebrities using market sentiment to shout orders usually means that the price has reached a staged top.

In the second independent market at the end of the year, BTC rose from its all-time high in early November 69,000 dropped rapidly to 42,000 at the end of the year, a drop of 40%. In the same period, NDX fell from a high of 16500 to 15600, a drop of only 5%. In hindsight, this decline was a response to the Fed's policy shift, and it is clear that BTC is more sensitive to changes at the macro level than the stock market during the same period.
Before the Federal Reserve officially announced its turn to the interest rate meeting in December, the interest rate meeting on November 3 had already reduced bond purchases. The day after the peak, first manifested in the institutional market: in the first two weeks of November, the discount rate of GBTC suddenly dropped from about 10% to 25%. At the same time, from December 4th to 6th, the BTC futures market also showed open positions The sharp drop in positions, from 23 billion to 16 billion, accelerated the decline in the spot market.
By observing the BTC independent market stage in 2020-2021, we can see that after the last round of sharp rise, BTC is subject to periodic price pressure , after several upward surges, only a downward correction is possible. At the same time, due to the entry of traditional institutions in this round, the large outflow of funds in related derivatives markets such as GBTC or futures often points to periodic high prices. It is also because of traditional institutions that BTC price trends are more sensitive to changes at the macro level than the stock market.
Summary:
Through the investigation and analysis of the correlation between BTC price and NDX100 index, we can conclude the following conclusions:
1. The overall price trend of BTC is more and more positively correlated with NDX100.
If The decline in correlation is generally because of specific factors in the BTC market that make BTC go out of the independent market.
2. BTC often takes a long time to digest the impact of the bubble burst.
Observation 18/ In the two years of independent BTC market in 2019, it was found that BTC did not follow the rise of the stock market when the monetary policy improved twice. It seems that it is still digesting the impact of the ICO bubble burst in 2017.
From October 2020 to March 2021, Bitcoin went from 10,000 to 60,000. During this period, it experienced two macroeconomic benefits but did not follow up ( Digesting the previous round of bubbles for a long time), experienced one of the largest releases in history, experienced a substantial increase in new investors brought by DEFI summer, a large influx of traditional corporate and institutional investors (see appendix) and halving Surrounded by many good news, the big market this time seems to be a bit late.
3. BTC is more sensitive to changes at the macro level than the stock market.
By observing 2020 - In the BTC independent market stage in 2021, we can see that after the last round of sharp rise, BTC is subject to periodic price pressure levels, and only corrects downward after several surges. At the same time, due to the entry of traditional institutions in this round, the large outflow of funds in related derivatives markets such as GBTC or futures often points to periodic high prices. Also because of the intervention of traditional institutions, the BTC price trend is more sensitive to changes at the macro level than the stock market.
Appendix: As the popularity of DEFI summer increases, the most eye-catching events in 2020-2021 are Rapid entry of traditional financial companies
< br>
Visa announced the USDC stable currency settlement payment blockchain on Ethereum, and PayPal has begun to allow users to use Token payments in its global online merchants. Listed blue-chip companies are expanding their direct holdings of crypto assets, such as Microstrategy, Tesla. Centralized exchanges and other fintech companies offer products with user-friendly interfaces (e.g. Metamask wallets) related to DeFi protocols and/or native cryptoassets issued in DeFi.
Meanwhile, institutional investor interest is growing, with many funds releasing products that allow sophisticated investors to gain indirect exposure to cryptoassets:
p>
CME launches bitcoin futures and options in 2021, Goldman Sachs launches bitcoin investment tool, Morgan Stanley offers its private wealth management clients access to bitcoin and cryptocurrency funds. BlackRock has added bitcoin futures as a potential non-prime investment (small allocation) for two of its funds, while some investment banks are launching digital asset divisions. In October 2021, the ProShares Bitcoin Strategy ETF launched, the first ETF linked to CME BTC futures listed on the US market.
Original link
Welcome to join the official BlockBeats community:
Telegram Subscription Group: https://t.me/theblockbeats
Telegram Discussion Group: https://t.me/BlockBeats_App
Official Twitter Account: https://twitter.com/BlockBeatsAsia