Bitcoin Erases Nearly 90% of Its Gains: Is $62,000 the Bottom, or the End of a Bear Market Rally?
TL;DR
· Bitcoin fell for a sixth consecutive week, dropping 12.6% last week and touching a low of $62,029 on November 15, a drawdown of about 29% from its September high. Price has returned to the July consolidation range of $61,300 to $67,000, which will determine whether the prior rally was the start of a new bull market or a rebound within a bear market.
· Market selling pressure has not yet been fully released. About $2 billion in liquidations occurred in the crypto market on November 14, short-term holders are cutting losses at a pace close to the July lows, and U.S. spot Bitcoin ETFs saw net outflows for seven consecutive trading days. The recent rebound was mainly driven by short covering, with no evidence yet of sustained buying returning.
· Fed rate hike expectations and a stronger dollar have become the main macro pressures driving Bitcoin lower. The U.S. 10-year real yield rose to 2.91%, the dollar index hit a 19-month high, and gold also fell notably, indicating the selloff is not unique to crypto markets.
· Bitfinex expects Bitcoin may trade between $61,800 and $69,400 this week, with a bias toward retesting the $62,029 low. If it breaks further below $61,300, the next key level is $57,803; if it reclaims $72,700 and ETF inflows recover, it could mean a阶段性 bottom has formed.
On November 15, Bitcoin fell to $62,029, marking a new low since July 13.
Over the past week, Bitcoin fell 12.6% cumulatively, closing lower for a sixth consecutive week and recording its longest losing streak since March 2025. Measured from the September 21 high of $87,392, Bitcoin has retraced about 29%.
However, Bitfinex argues in its latest Alpha report that Bitcoin's current position matters more than the size of the decline itself.
After this round of declines, Bitcoin has re-entered the $61,300 to $67,000 range. From early July to mid-August, Bitcoin traded sideways here for nearly seven weeks before rallying to a阶段性 high in September. Bitfinex calls this price zone the "July Base."
Now that price has returned to the starting point of the rally, the market must once again answer a question: was the July-to-September advance the beginning of a new bull market, or a rebound within a longer bear market?
Bitfinex believes that $57,803 is the key to judging this issue. If Bitcoin can form a new low above this price level, it still retains the trend structure of rising lows since July. If the price falls back to this low, it means that the previous rise was more likely just a bear market rebound.
And from the current market structure, the real test may not be over yet.
I. The $61,300 defense line: Bitcoin is returning to the starting point of the rise
On July 1, Bitcoin hit a cycle low of $57,803. After that, the price consolidated between $61,300 and $67,000 for nearly seven weeks. As the price broke back above multiple key holding cost levels, the market gradually developed upward and reached $87,392 on September 21.
However, the recent decline has almost wiped out this round of gains.
From $57,803 to $87,392, Bitcoin rose by about $29,589 in total, and the decline as of November 15 has already given back 85.7% of that.
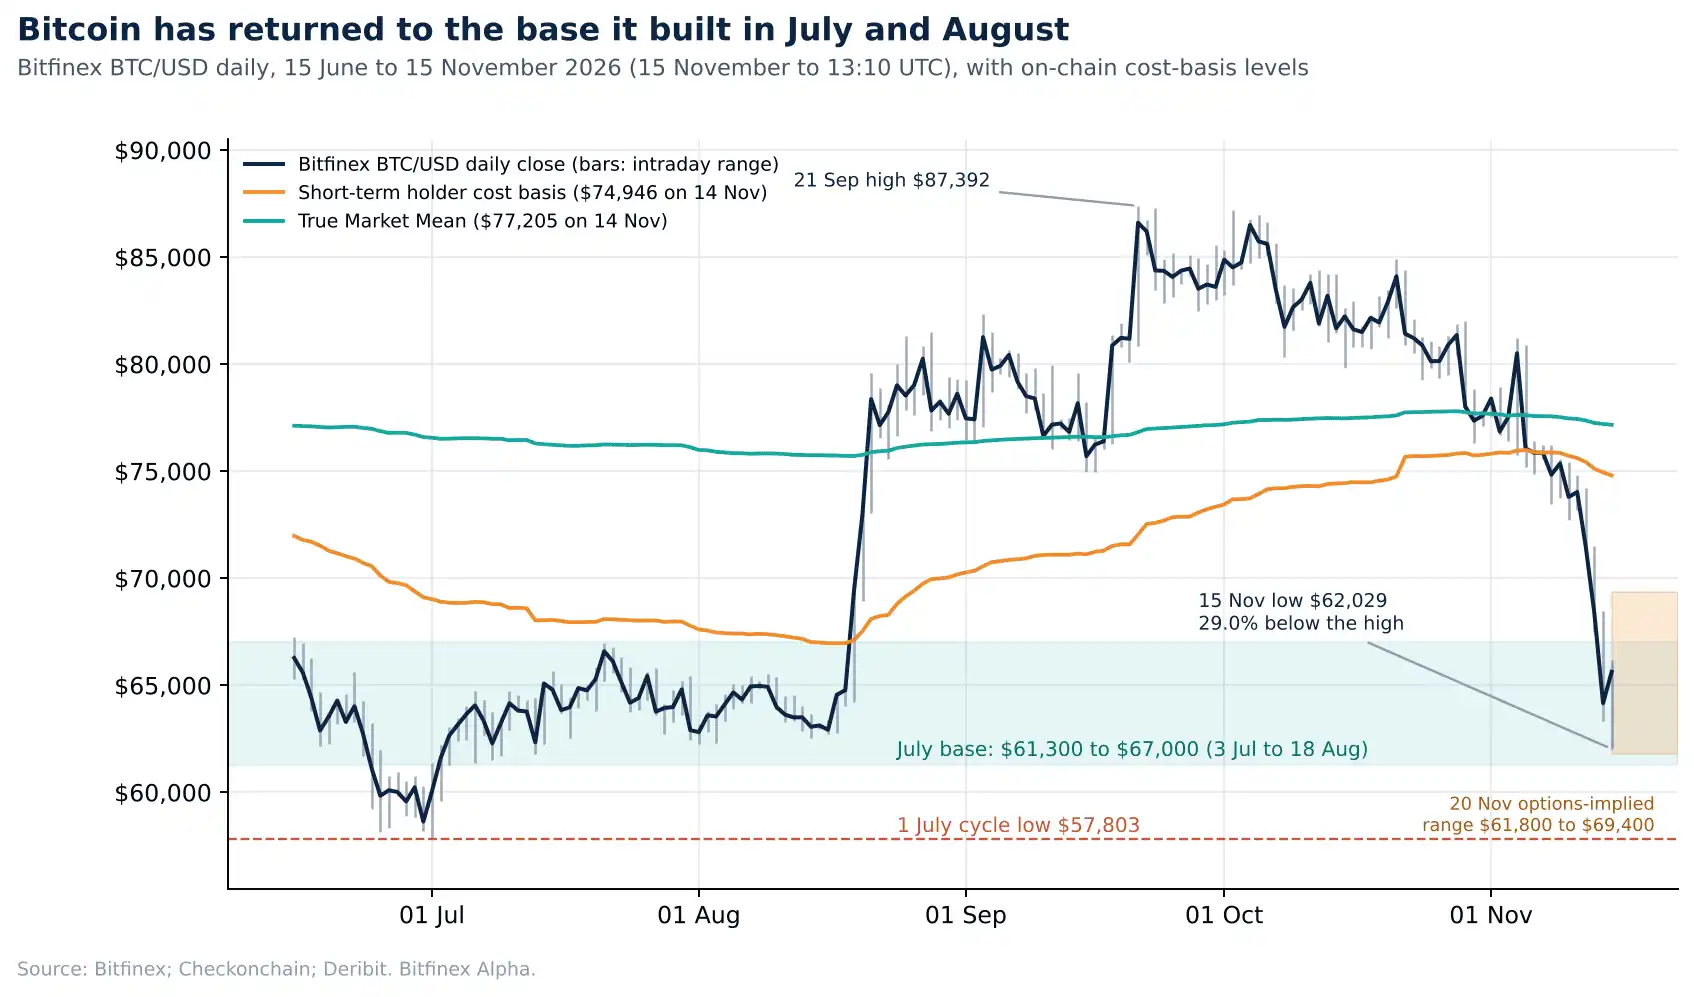
Caption: Bitcoin daily chart and the late-July bottom range, including short-term holder cost basis, true market mean, and option implied volatility range. Source: Bitfinex, Checkonchain, Deribit Metrics.
This also makes the current correction clearly different from previous normal pullbacks. From July to early October, each Bitcoin pullback did not exceed 9%, while this decline has not only lasted longer but has also been much larger in magnitude.
Bitfinex believes that even if the market can stabilize above the late-July bottom range, it may not immediately start a new round of gains. Referring to similar declines in the past, repairing the price structure often takes several weeks, so Bitcoin may continue to fluctuate until the end of the year.
On-chain coin distribution further explains the importance of the $61,300 to $67,000 range.
According to Checkonchain data, about 1.4 million Bitcoins have a cost between $60,000 and $65,000, making it the largest concentration of coins in the current holding cost distribution.
By comparison, only about 305,000 Bitcoins have a cost between $55,000 and $60,000.
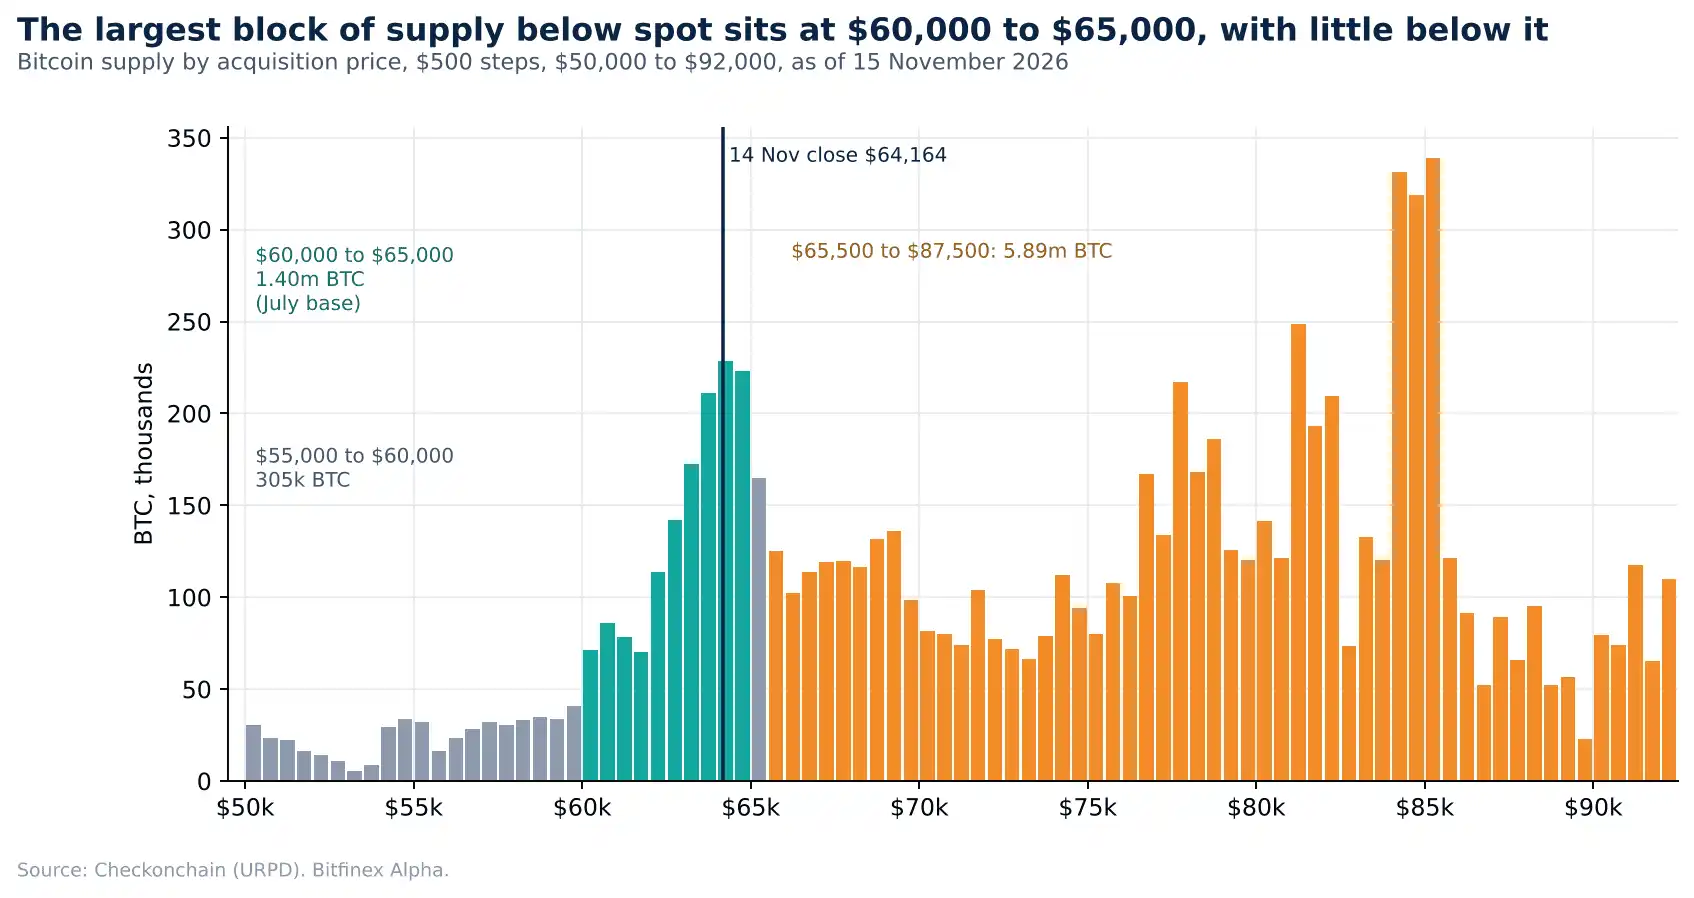
Chart note: Bitcoin's cost basis distribution between $50,000 and $92,000, in $500 intervals. Source: Checkonchain.
This means that once Bitcoin falls below the current dense chip concentration zone, the potential support formed by historical transactions below is significantly reduced. Bitfinex therefore judges that if the July bottom range is lost, the price could quickly move toward the lower bound of the $55,000 to $60,000 range.
At the same time, the cost basis lines that previously supported the price have now turned into rebound resistance.
As of the report's publication, Bitcoin's Short-Term Holder Cost Basis (STH-CB) stood at $74,712. This metric reflects the average holding cost of Bitcoin transferred within the most recent 155 days.
Another metric, the "True Market Mean" (TMM), stood at $77,112, measuring the average cost of the active trading supply.
On November 15, Bitcoin's weekly closing price was 12.5% and 15.2% below these two levels, respectively.
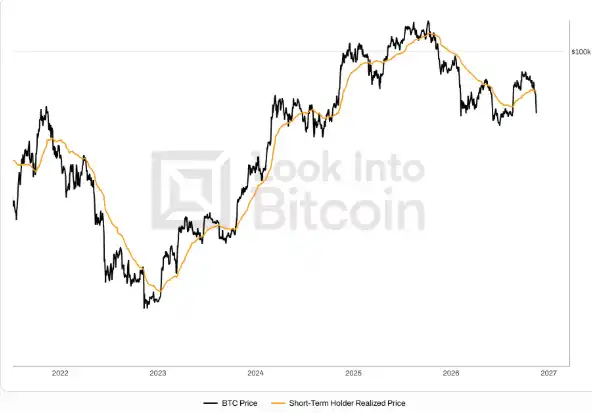
According to Bitfinex's statistics on market conditions since 2016, of the past 14 instances where Bitcoin fell below the short-term holder cost basis, 11 recovered that level within two weeks.
But the remaining three behaved very differently: the price continued to decline for about 90 days, with the ultimate low coming in 17% to 35% below the short-term holder cost basis.
Based on the November 15 closing price, Bitcoin would need to rise about 14% to reclaim the short-term holder cost basis before November 22.
Bitfinex believes this means the current cycle is more likely to enter a scenario with a longer repair period. However, since there are only three similar cases in history, these data are not yet sufficient to constitute a reliable predictive model.
What matters most right now is not whether Bitcoin can rebound immediately, but whether the bottom structure formed in July can be preserved.
II. Three types of sellers have not yet exited: $2 billion in liquidations, short-term holder stop-losses, and continuous ETF outflows
Unlike some crashes triggered by major negative news, this round of Bitcoin's decline has no single, clear event catalyst.
Bitfinex believes the market is facing three types of selling pressure simultaneously: futures traders deleveraging, short-term holders stopping losses, and spot ETF investors withdrawing funds.
Only when this selling pressure gradually fades can the July bottom range form stable support.
Futures leverage begins to clear, but is not yet complete
During most of the previous decline, Bitcoin futures open interest (OI) remained at around 700,000 BTC. This means that although some leveraged positions were liquidated, new positions quickly filled the gap, and the overall market leverage scale did not significantly decrease.
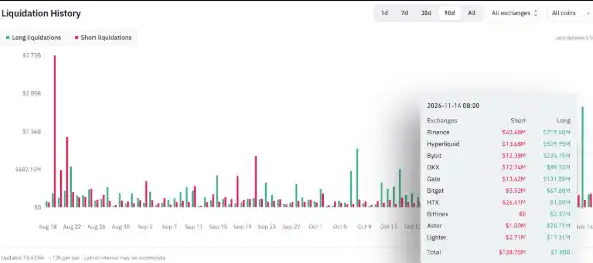
It was not until November 14-15 that the situation changed. Bitcoin futures open interest fell to 645,750 BTC, a decrease of about 8% from November 11. During the same period, the crypto market saw about $2.01 billion in forced liquidations within 24 hours, of which 83% came from longs.
However, Bitfinex believes this is still not enough to prove that leverage has been completely cleared.
An important reason is that the rebound after Bitcoin touched $62,029 on November 15 was mainly driven not by new buying, but by active short covering.
While prices rebounded, open interest continued to decline. Within 12 hours after the bottom, short liquidations reached $228 million, higher than $122 million in long liquidations during the same period.
This is more consistent with the characteristics of a "short-covering rebound" rather than a new round of gains driven by investors actively building long positions.
From the perspective of funding rates, the market is approaching a state of leverage reset. On November 10, Bitcoin's composite annualized funding rate was about 11%. Since then, funding rates on major trading platforms have fallen to between slightly negative and 5%.
Bitfinex points out that historically, a more complete leverage clearing is usually accompanied by a continued decline in BTC-denominated open interest, while funding rates on major trading platforms generally fall to zero or negative. The market is currently approaching this state, but has not yet fully reached it.
It is worth noting that CME Bitcoin futures open interest instead increased from 98,820 BTC on November 11 to 102,100 BTC on November 13.
This indicates that the recent decline in open interest occurred primarily on offshore trading platforms, while institutional positions in the CME market did not decrease in tandem. Of course, CME's current position size itself is already near historic lows.
Short-term holders are capitulating en masse
Bitcoin on-chain data is also beginning to show stress approaching the July lows.
The Short-Term Holder Spent Output Profit Ratio (STH-SOPR) fell to 0.971 on November 15, the lowest since June 5.
STH-SOPR measures the relationship between the price at which short-term holders sell Bitcoin and their acquisition cost. When the metric is below 1, it means these investors are on average selling at a loss; the lower the value, the greater the realized loss. Previously in June and July, similar levels appeared mainly on the trading days when market capitulation was most concentrated.
Meanwhile, on November 15, the net realized loss for all holders reached approximately 76,500 BTC denominated in BTC, the highest level since July 1, compared with only about 18,700 BTC on November 10.
The unrealized loss situation is equally noteworthy.
On November 14, the share of Bitcoin supply in profit across the network fell to 48.5%, the same level as the July 1 low.
On November 15, as prices rebounded, this ratio recovered to 51.4%.
This means that even though the current Bitcoin price is still about 11% above the July 1 low, the unrealized loss pressure borne by holders is already close to that time.
Bitfinex noted that such large-scale losses and capitulation are often one of the necessary conditions for the market to form a durable bottom, but this cannot be used to judge that the bottom has already appeared. For example, in June this year, STH-SOPR fell to a similar level about four weeks early, and the market did not truly bottom until July.
Therefore, what is more worth watching going forward is whether STH-SOPR can approach 1 again. If this metric continues to recover, it will mean that loss-driven selling by short-term holders is weakening.
ETFs see seven consecutive trading days of outflows, institutional demand still has not recovered
If leverage deleveraging and retail capitulation are the market's internal de-risking process, then the continued outflows from spot ETFs reflect insufficient new demand.
According to Farside Investors data, U.S. spot Bitcoin ETFs recorded a total net outflow of $1.07 billion last week, the second-largest weekly outflow since June 22, trailing only the $1.28 billion in the prior week.
More importantly, the ETFs have posted net outflows for seven consecutive trading days, the longest streak since July 1.
Of the 11 trading days since October 30, only one saw net inflows, with cumulative net outflows reaching $2.99 billion.
Caption: Daily net inflows and outflows of U.S. spot Bitcoin ETFs. Source: Farside Investors.
Bitfinex believes ETF fund flows will be a key indicator for judging whether the market can stabilize.
Institutional demand cannot be confirmed as recovered until there are three consecutive trading days of net inflows, with inflow volumes sufficient to offset a considerable portion of recent outflows.
Corporate treasury demand has likewise failed to effectively offset selling pressure.
As of November 9, Strategy's average cost basis for its Bitcoin holdings was $75,456. Based on the closing price on November 15, its Bitcoin holdings were sitting on an unrealized loss of approximately 13%.
Meanwhile, after reports emerged that Strategy could be removed from the MSCI index, its stock price fell 13.4% last week.
This means that the two important sources of spot demand that previously drove Bitcoin's rally—ETFs and corporate treasuries—are currently failing to provide sufficient support for the market.
III. Bitcoin and Gold Falling in Tandem, with the Real Pressure Coming from the Dollar and Treasury Yields
Compared with the crypto asset correction two weeks ago that was driven by equity market declines, the macro backdrop for this round of Bitcoin's decline has changed.
Bitfinex believes the main factors driving the recent decline are rising U.S. real yields and a persistently strong dollar.
From November 6 to 13, the U.S. 10-year real yield rose from 2.63% to 2.91%. Over the same five trading days, the Nasdaq 100 index rose 3.5%, while Bitcoin fell 9.9%.
This divergence indicates that Bitcoin is not simply following tech stocks downward.
Gold's performance further supports this judgment. Last week, gold fell more than 4.8% cumulatively, marking its largest weekly decline since June. Neither Bitcoin nor gold generates interest income. When U.S. Treasury yields rise, the opportunity cost of holding these assets increases accordingly, and a stronger dollar further suppresses the prices of dollar-denominated assets.
Inflation shows no significant improvement for three consecutive months
The U.S. October Consumer Price Index (CPI) released on November 10 showed that core CPI rose 0.3% month-over-month, maintaining this pace for the third consecutive month.
Overall CPI rose 0.4% month-over-month. Although lower than September's 0.6%, it was still above the market expectation of 0.3%.
The core CPI increase was also above the market expectation of 0.2%.
Because the U.S. federal government shutdown in October 2025 prevented the collection of corresponding price data, the Bureau of Labor Statistics did not publish year-over-year growth rates for overall and core CPI this time.
Therefore, the month-over-month core CPI data for three consecutive months has become an important basis for observing recent inflation trends.
And these data do not show that consumer price pressures are easing significantly.
The production side is equally discouraging.
The October Producer Price Index (PPI) rose 6.5% year-over-year, the highest level since November 2022. Although diesel prices fell 7.9% that month, transportation and warehousing services prices rose 2%, contributing about three-quarters of the increase in services prices.
This indicates that falling energy costs may not immediately pass through to corporate pricing. Transportation costs often adjust with a lag, so inflationary pressure may persist for longer.
The market begins betting on a Fed rate hike in December
Hours before the October CPI release, Federal Reserve Governor Christopher Waller said that even if inflation improves somewhat, he still leans toward considering a 25 basis point rate hike.
If core CPI month-over-month reaches 0.3% or higher, a 50 basis point hike should be considered.
The subsequently released data恰好 met this threshold. As of November 15, CME FedWatch showed that the market expected about a 92% probability of a 25 basis point rate hike at the Fed's December meeting and about an 8% probability of a 50 basis point hike.
However, Bitfinex emphasized that Waller's stance does not represent the entire Federal Open Market Committee (FOMC).
At the October meeting where rates were held steady, only two officials voted against the decision, and both supported a 25 basis point rate hike. No other voting officials have explicitly supported a 50 basis point rate hike at once.
Therefore, although the market highly expects a December rate hike, a large rate hike is still not the baseline scenario. The key next steps are the October FOMC meeting minutes to be released on November 18 and the October Personal Consumption Expenditures Price Index (PCE) to be released on November 25.
If core PCE rises 0.2% or less month-over-month, the likelihood of a 50 basis point rate hike will weaken; if it reaches 0.3% or higher, the case for a large rate hike will strengthen.
The Federal Reserve's next policy meeting is scheduled for December 8-9, when new CPI data will not yet have been released.
Dollar Index Hits 19-Month High
As rate hike expectations heat up, the U.S. two-year Treasury yield rose from 4.51% on November 6 to 4.88% on November 13. On November 16, the dollar index closed at 103.4, reaching its highest level since April 2025.
Higher U.S. short-term rates increase the yield appeal of dollar assets relative to other markets, driving capital flows into the dollar.
For Bitcoin, a stronger dollar exerts pressure mainly through two channels.
First, Bitcoin is denominated in dollars. Dollar appreciation means investors using other currencies must pay higher local-currency costs to buy the same amount of Bitcoin.
Second, rising dollar funding costs will compress leveraged traders' funding space and increase holding pressure.
CoinGlass data shows that in the 12 hours to 12:00 UTC on November 13, Bitcoin futures liquidations amounted to approximately $756 million, with longs accounting for 92%.
Bitfinex therefore believes that as long as the dollar index remains above 103, Bitcoin's macro environment will be difficult to significantly improve. If the dollar further breaks above 103.4 after the November 25 PCE data release, Bitcoin may come under greater pressure.
IV. Options Market Bets on Short-Term Volatility: $61,800 to $69,400 Is the Key Range This Week
Beyond spot and on-chain indicators, the options market also reflects that traders are paying higher costs for short-term downside risk. As of November 15, the implied volatility of Bitcoin options expiring on November 20 reached 46.8%, higher than the 40.2% for options expiring on December 25.
Typically, longer-dated options carry higher volatility pricing. Now that short-term options have higher implied volatility instead, it shows traders are especially wary of price changes in the coming week.
Bitfinex believes this may be related to several upcoming major events, including Nvidia's earnings report, the Federal Reserve meeting minutes, and the Anthropic listing expected on November 19.
Based on the implied volatility of options expiring on November 20, Bitcoin's implied price range this week is $61,800 to $69,400.
Options positioning distribution also shows the market is concentrating on hedging downside risk.
For put options expiring on November 27, the largest concentration of open interest is near the $63,000 strike; for put options expiring on December 25, it is concentrated at $60,000.
These two levels fall within and below the late-July bottom range, respectively.
Caption: As of November 15, 2026, strike price open interest distribution and implied price ranges for Bitcoin options with different expiry dates. Source: Deribit Metrics.
Meanwhile, for put options expiring on November 20 with a strike about 8% below the current price, implied volatility is about 25 volatility points higher than for call options equally far from the current price.
By comparison, the corresponding options spread for December 25 expiry is only about 8 volatility points.
This pricing structure, clearly skewed toward put options, shows traders are willing to pay a higher premium for near-term downside protection. Bitfinex believes the message from the options market and on-chain holdings distribution is basically consistent: the $61,300 to $67,000 bottom range is key to determining Bitcoin's next phase direction.
V. Where Exactly Is the Bottom? Bitfinex Outlines Three Scenarios
For this week's price action, Bitfinex's baseline assessment remains cautious.
With spot ETFs continuing to see outflows, the dollar at a 19-month high, and futures leverage not yet fully flushed out, institutions expect Bitcoin may trade between $61,800 and $69,400, with downside risk leaning toward a retest of the Nov. 15 low of $62,029.
Next, three scenarios could play out in the market.
Scenario One: July bottom range holds, but the market enters a prolonged consolidation
This is the scenario that warrants key attention right now.
If ETFs still see net outflows of $100 million to $300 million per day, futures open interest continues to decline, and funding rates hover near zero, it would indicate the market remains in a deleveraging and risk-reduction phase.
If the short-term holder SOPR gradually climbs back toward 1, it would mean loss-driven selling is weakening.
On the macro side, if the dollar index holds above 103 and the U.S. two-year Treasury yield stays at 4.88% or higher, it would indicate the dollar's rate advantage persists.
In this case, even if Bitcoin holds the July bottom range, it may struggle to quickly resume an uptrend.
Bitfinex believes the repair of the price structure could last several weeks, or even extend to year-end.
Scenario Two: Reclaiming $72,700, confirming the formation of a阶段性 bottom
To overturn the current bearish short-term view, Bitfinex wants to see multiple positive signals appear simultaneously.
First, Bitcoin's price needs to reclaim $72,700.
Second, U.S. spot Bitcoin ETFs need to record net inflows for three consecutive trading days, indicating genuine spot demand is recovering.
Finally, the U.S. 10-year real yield needs to fall back below 2.8%, easing macro rate pressure.
If these conditions are met simultaneously, it would mean Bitcoin may have formed a higher interim low.
At that point, the approximately $75,000 area, where the short-term holder cost basis lies, would become the next price target worth watching.
In addition, the dollar index closing back below 103, or the market-implied probability of a 50-basis-point Fed rate hike falling below 5%, would also weaken the current macro bearish logic.
However, if dollar and interest rate pressures have already eased and Bitcoin still cannot rise, it means the main factor limiting price recovery may no longer be the macroeconomic environment, but rather insufficient spot buying.
Scenario Three: Breaking below $61,300, retesting $57,803
This is the downside scenario Bitfinex is most concerned about.
If Bitcoin effectively breaks below $61,300, the lower edge of the late-July bottom range, while ETF daily net outflows exceed $300 million, it would signal that the market still lacks sufficient spot absorption capacity.
Considering that the $60,000 to $65,000 range has accumulated a large amount of positions, while the $55,000 to $60,000 range below has significantly fewer historical traded positions, once the former is breached, the price could move relatively quickly toward the July 1 cycle low of $57,803.
If even this low is broken, the higher-low structure formed since July would be destroyed.
Bitfinex believes this would be stronger evidence that the previous rally was a bear market bounce rather than a new bull market.
VI. What events in the coming week could determine Bitcoin's direction?
Beyond price itself, Bitfinex recommends investors closely monitor ETF fund flows, the dollar index, real yields, and changes in market leverage.
ETF fund flows from November 16 to 18 will first reflect whether institutional buying is beginning to recover. Three consecutive trading days of net inflows is an important threshold for Bitfinex to judge demand improvement.
On the macro side, a dollar index of 103 and a U.S. 10-year real yield of 2.8% are two key levels to watch. If the dollar continues to strengthen and real yields remain elevated, non-yielding assets may still face pressure.
In addition, the market will see a series of密集 events:
November 17: U.S. October retail sales data, and Nvidia's earnings report after U.S. market close.
November 18: The Federal Reserve releases the minutes of its October 27-28 policy meeting.
November 19: Anthropic is expected to go public.
November 20: Bitcoin options expire, and the market's demand for hedging short-term risk faces adjustment.
November 25: The U.S. releases the October PCE price index, providing an important basis for the Federal Reserve's December interest rate decision.
At the same time, futures open interest, funding rates, and the short-term holder SOPR still need to be continuously tracked.
Only when leverage is further cleared, loss-driven selling weakens, ETF inflows recover, and pressure from U.S. dollar interest rates eases somewhat will the market have more reason to believe that a new bottom is forming.
Bitfinex ultimately emphasized that Bitcoin has returned to the starting point of this rally, but the market has not yet completed its risk release.
Holding the late-July bottom range only means the uptrend still has a chance to be preserved; if it falls below $57,803, the gains of the previous months may need to be redefined as a bear market rebound.
Even if the market is already close to the bottom, it does not mean a sustained reversal will occur immediately. Before macro pressure eases and spot demand recovers, Bitcoin may still experience a prolonged period of volatility and repair.
Welcome to join the official BlockBeats community:
Telegram Subscription Group: https://t.me/theblockbeats
Telegram Discussion Group: https://t.me/BlockBeats_App
Official Twitter Account: https://twitter.com/BlockBeatsAsia
 Related Articles