
Seagate's quarterly revenue surges 60%, profitability hits record high

On October 27, hard drive manufacturer Seagate released its financial results for the first quarter of fiscal year 2027, ended October 2. The company's quarterly revenue reached $4.233 billion, up about 60% year-over-year.
Profits were even more striking. Of every extra dollar of revenue, a considerable portion ultimately stayed on the income statement. Seagate's net income reached $1.761 billion, 3.2 times the year-ago period. The company said profitability hit a record for the quarter, and free cash flow also reached an all-time high.
In discussions about AI data centers, compute chips usually stand in the spotlight. Seagate's earnings report offers another angle: when data needs to be stored and repeatedly accessed, what happens to the revenue structure of storage device manufacturers?
Revenue rose 60%, so why did profit grow more than threefold?
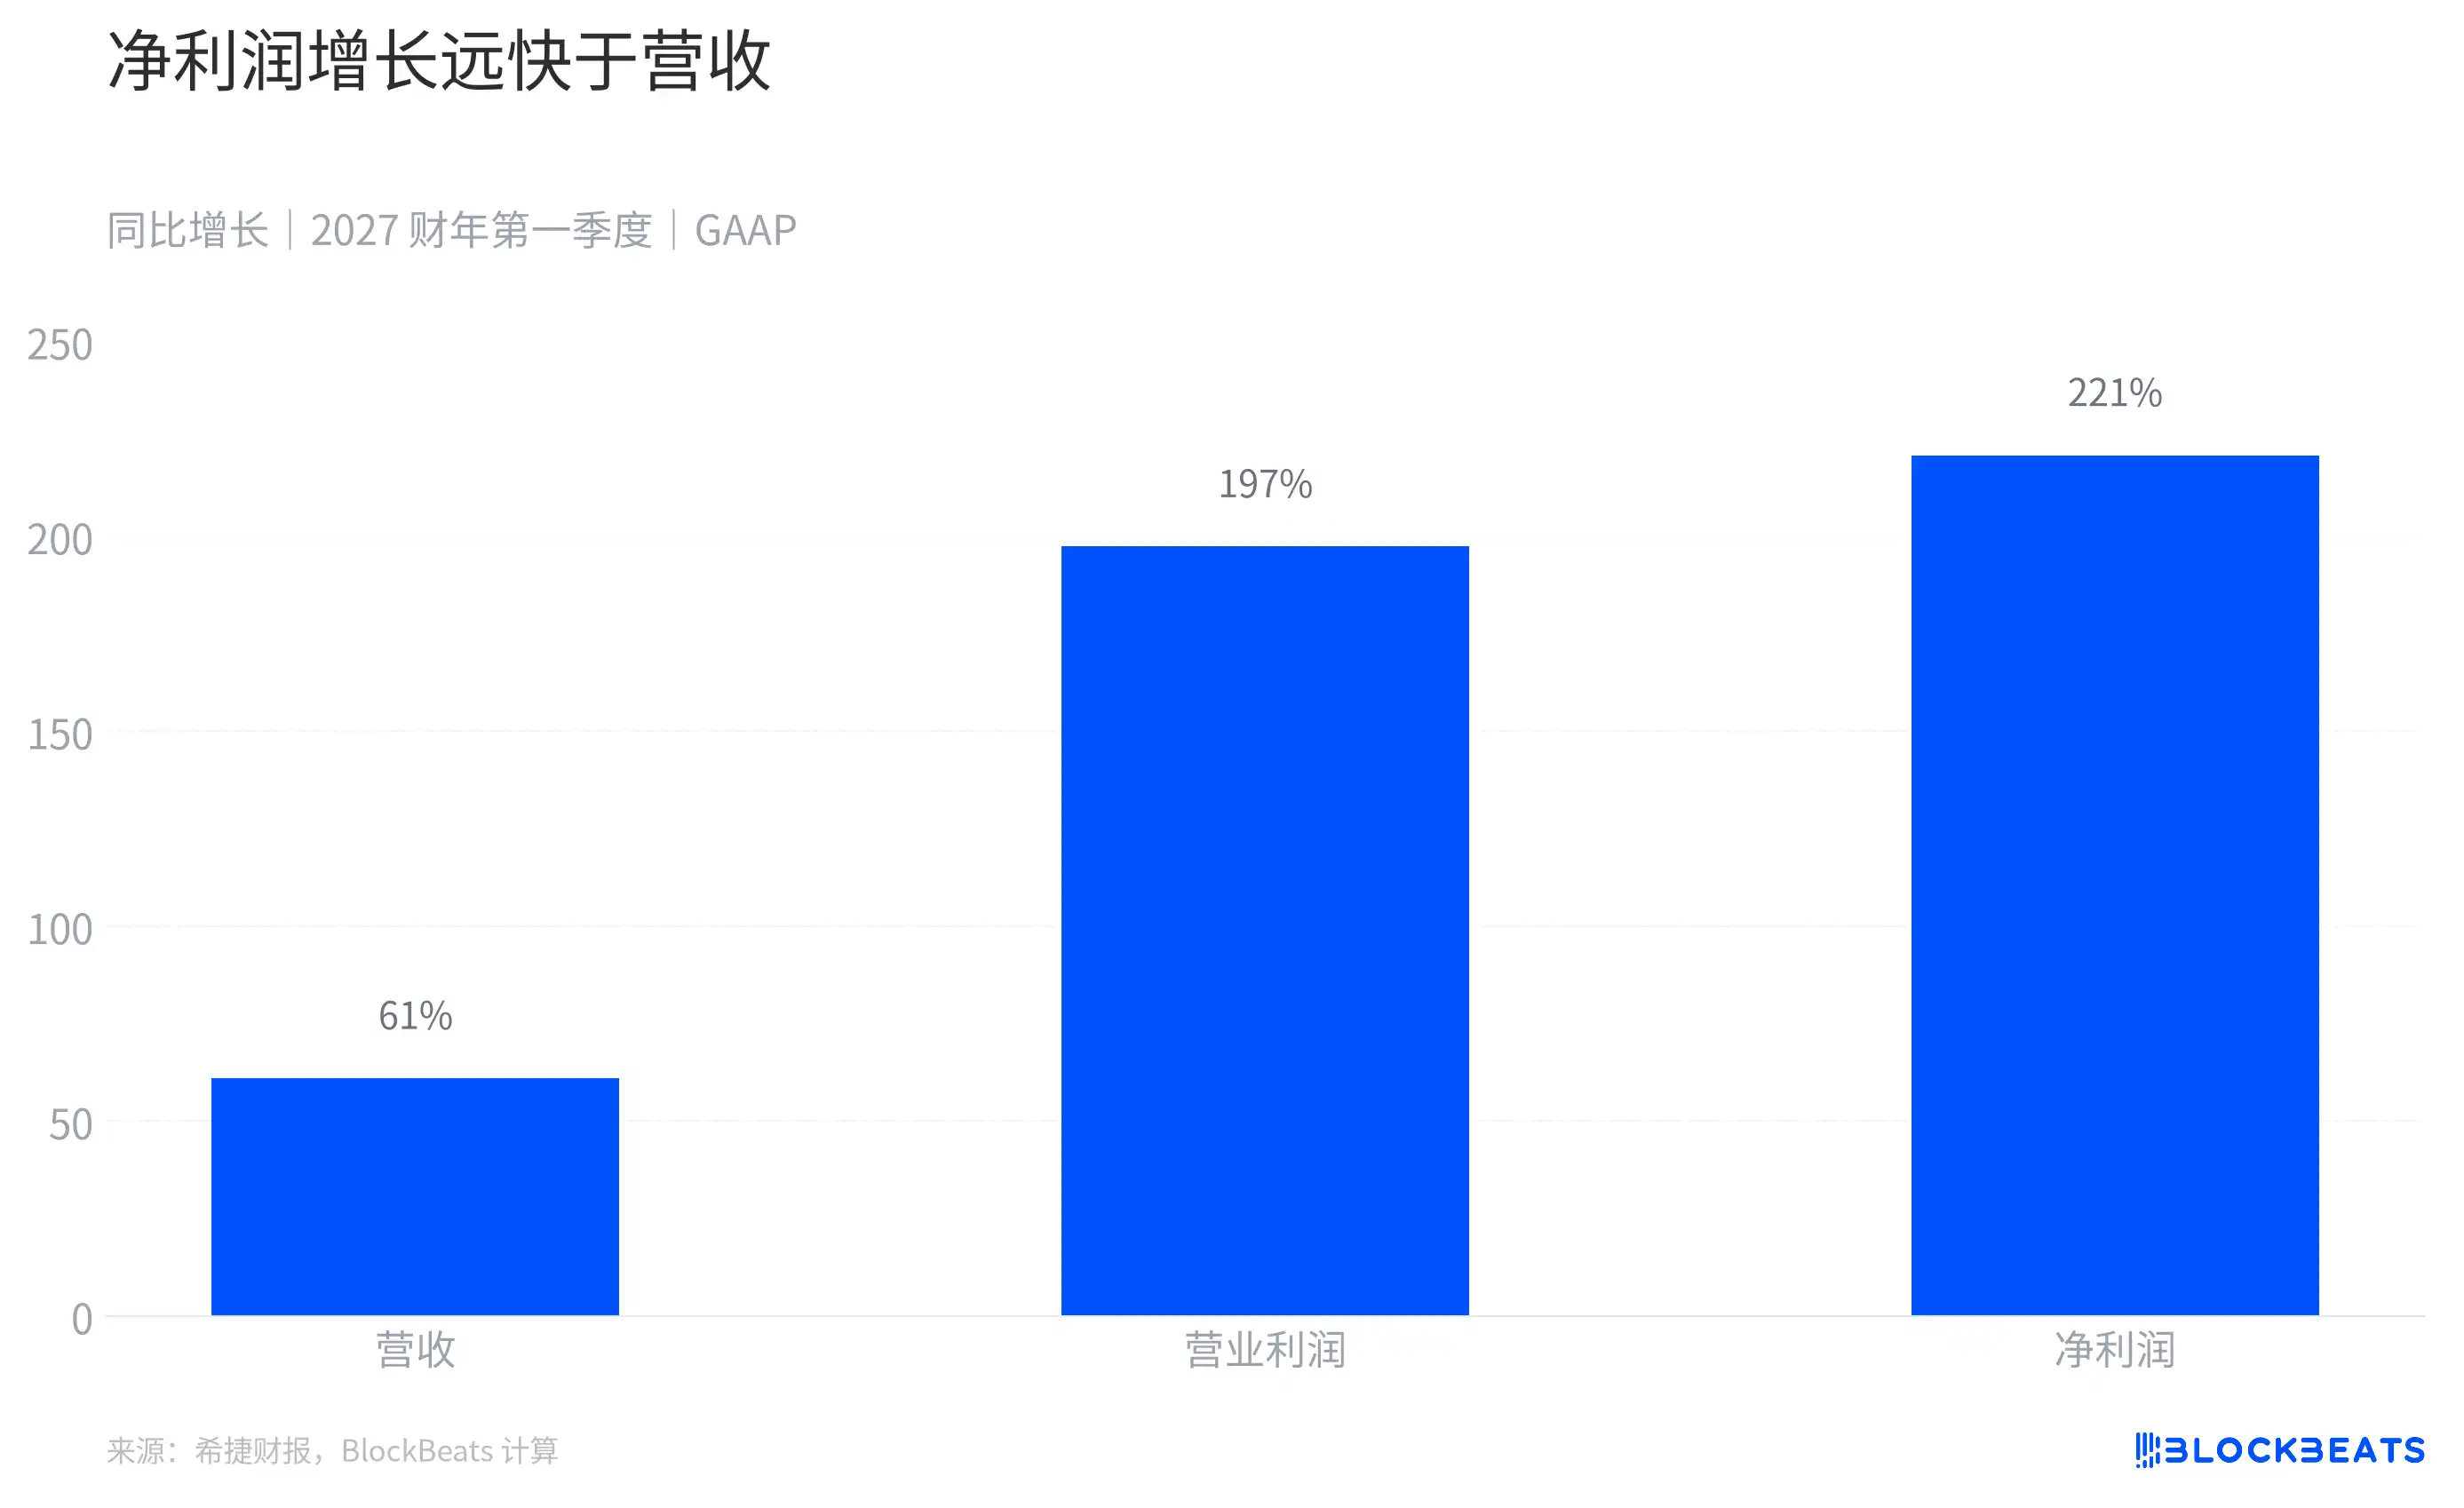
Revenue and profit growth rates
Seagate's quarterly revenue grew 61% year-over-year, operating income grew about 197%, and net income grew about 221%. The gap between these three figures shows that the company gained not just more orders, but also higher profit margins.
Breaking down the income statement makes the change more intuitive. According to Seagate's earnings report, revenue increased by $1.604 billion compared with the year-ago quarter, while cost of revenue rose by only $214 million. Subtracting the two, incremental gross profit was $1.390 billion, equivalent to about 87% of incremental revenue. This is an incremental ratio between two quarters, not the actual gross margin on each new order.
In other words, looking only at the change between these two quarters, about $87 of every $100 in incremental revenue showed up as incremental gross profit. It has not yet deducted R&D, sales and administrative expenses, and it is not the final net profit. This calculation alone cannot prove whether volume, price, or product mix drove the change, but it does show that revenue growth and cost growth were not synchronized.
Changes in operating expenses also affected final profit. Seagate's listed operating expenses—including R&D, marketing and administrative, and restructuring—rose in total from $343 million to $363 million, an increase clearly smaller than gross profit. A considerable portion of incremental gross profit therefore flowed through to operating income.
This also explains why, in the same earnings report, revenue growth and net income growth look like two different stories. The former describes how much the company sold; the latter also includes changes in product costs, expenses, interest, and taxes.
Shipment capacity barely changed, so why can revenue still grow?
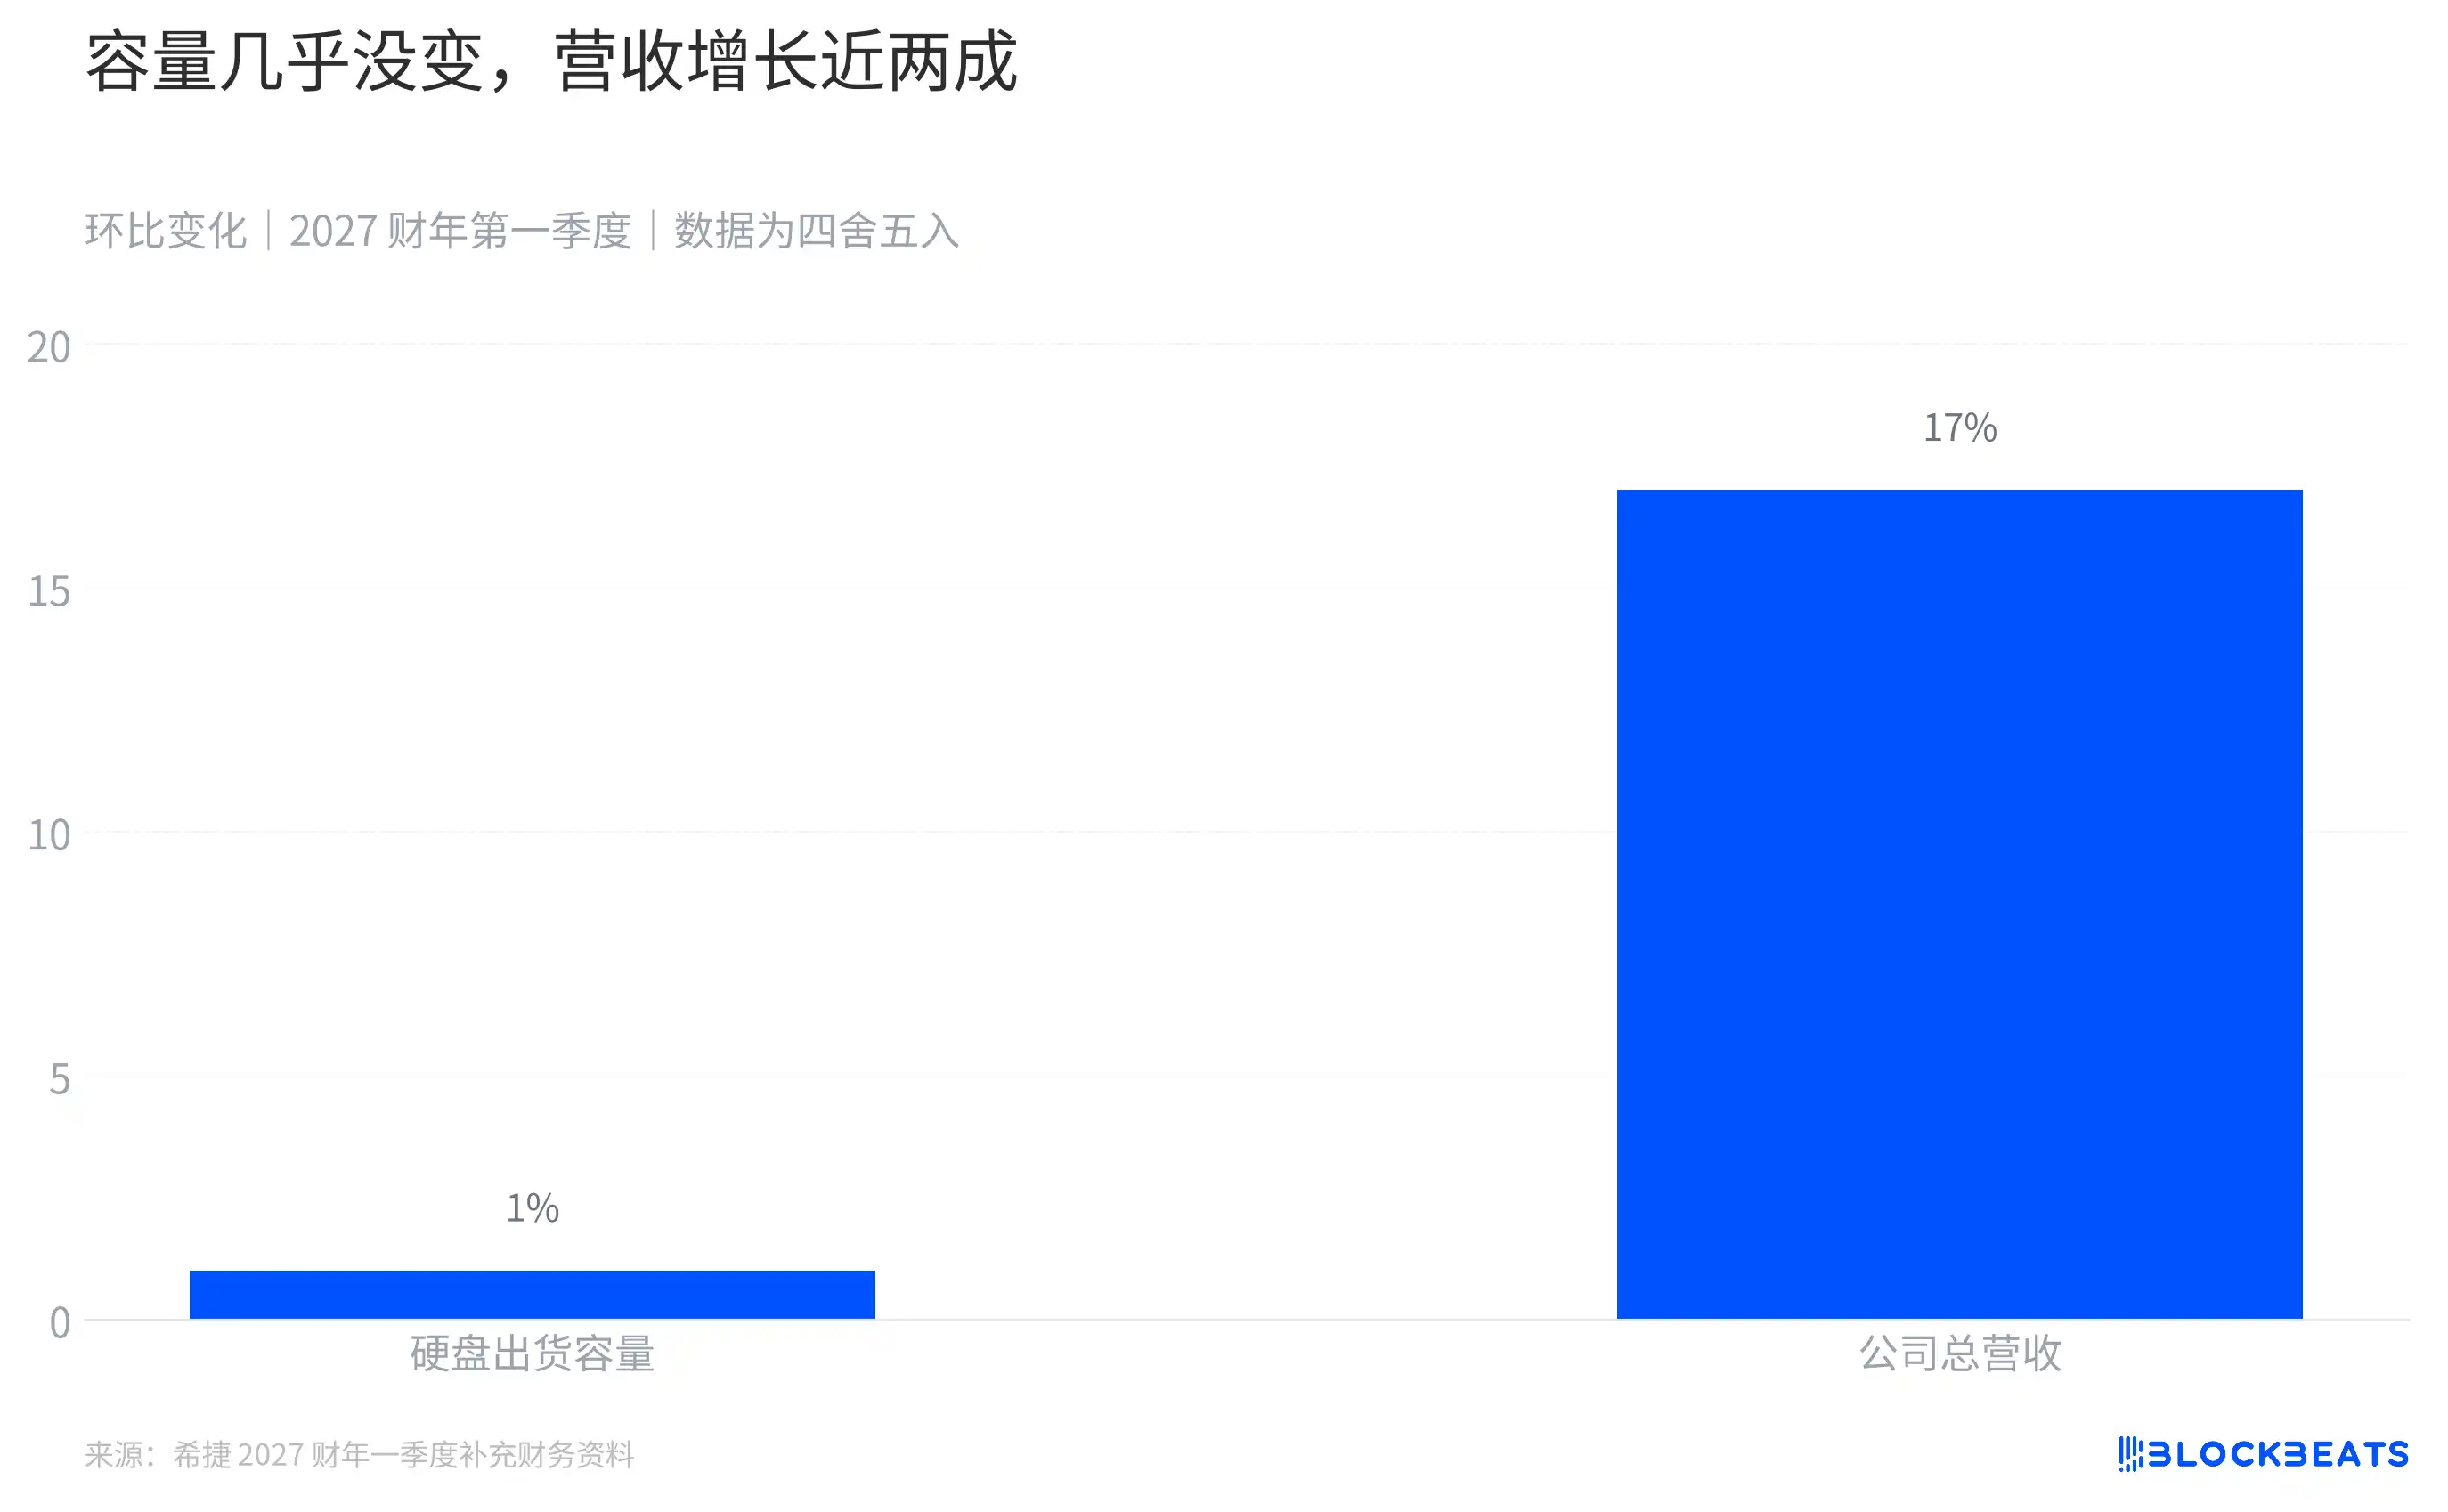
Quarter-over-quarter growth in HDD shipment capacity and revenue
Seagate's published supplemental financial materials provide a new comparison. HDD shipment capacity for the quarter was 220 EB, versus 218 EB in the prior quarter, up only about 1% quarter over quarter. Over the same period, total company revenue grew about 17% quarter over quarter.
The two figures cover different scopes. Shipment capacity counts only HDDs, while total company revenue also includes other product and system revenue. They therefore show that revenue and capacity changed at different rates, and one cannot directly infer the price increase of any particular HDD from them.
Narrowing to the data center business, the financial report shows its revenue rose from $2.933 billion to $3.449 billion quarter over quarter, while nearline HDD shipment capacity rose from 195 EB to 198 EB. Dividing data center revenue by nearline shipment capacity gives an estimated revenue per TB rising from about $15.04 to $17.42, an increase of about 16% quarter over quarter.
This ratio is also not the selling price of a single product. Data center revenue includes nearline products and systems, the revenue and capacity classifications do not fully overlap, and changes in product mix also affect the result. It is better suited as a rough indicator of the relationship between revenue and capacity.
Seagate's chief financial officer said on the earnings call that better pricing execution and a higher mix of Mozaic 4 products drove the quarter-over-quarter improvement in non-GAAP gross margin while offsetting some cost pressure from purchased components. This is management's explanation of the quarter-over-quarter change, not a quantified breakdown of each factor's contribution.
Why is gross margin so critical?
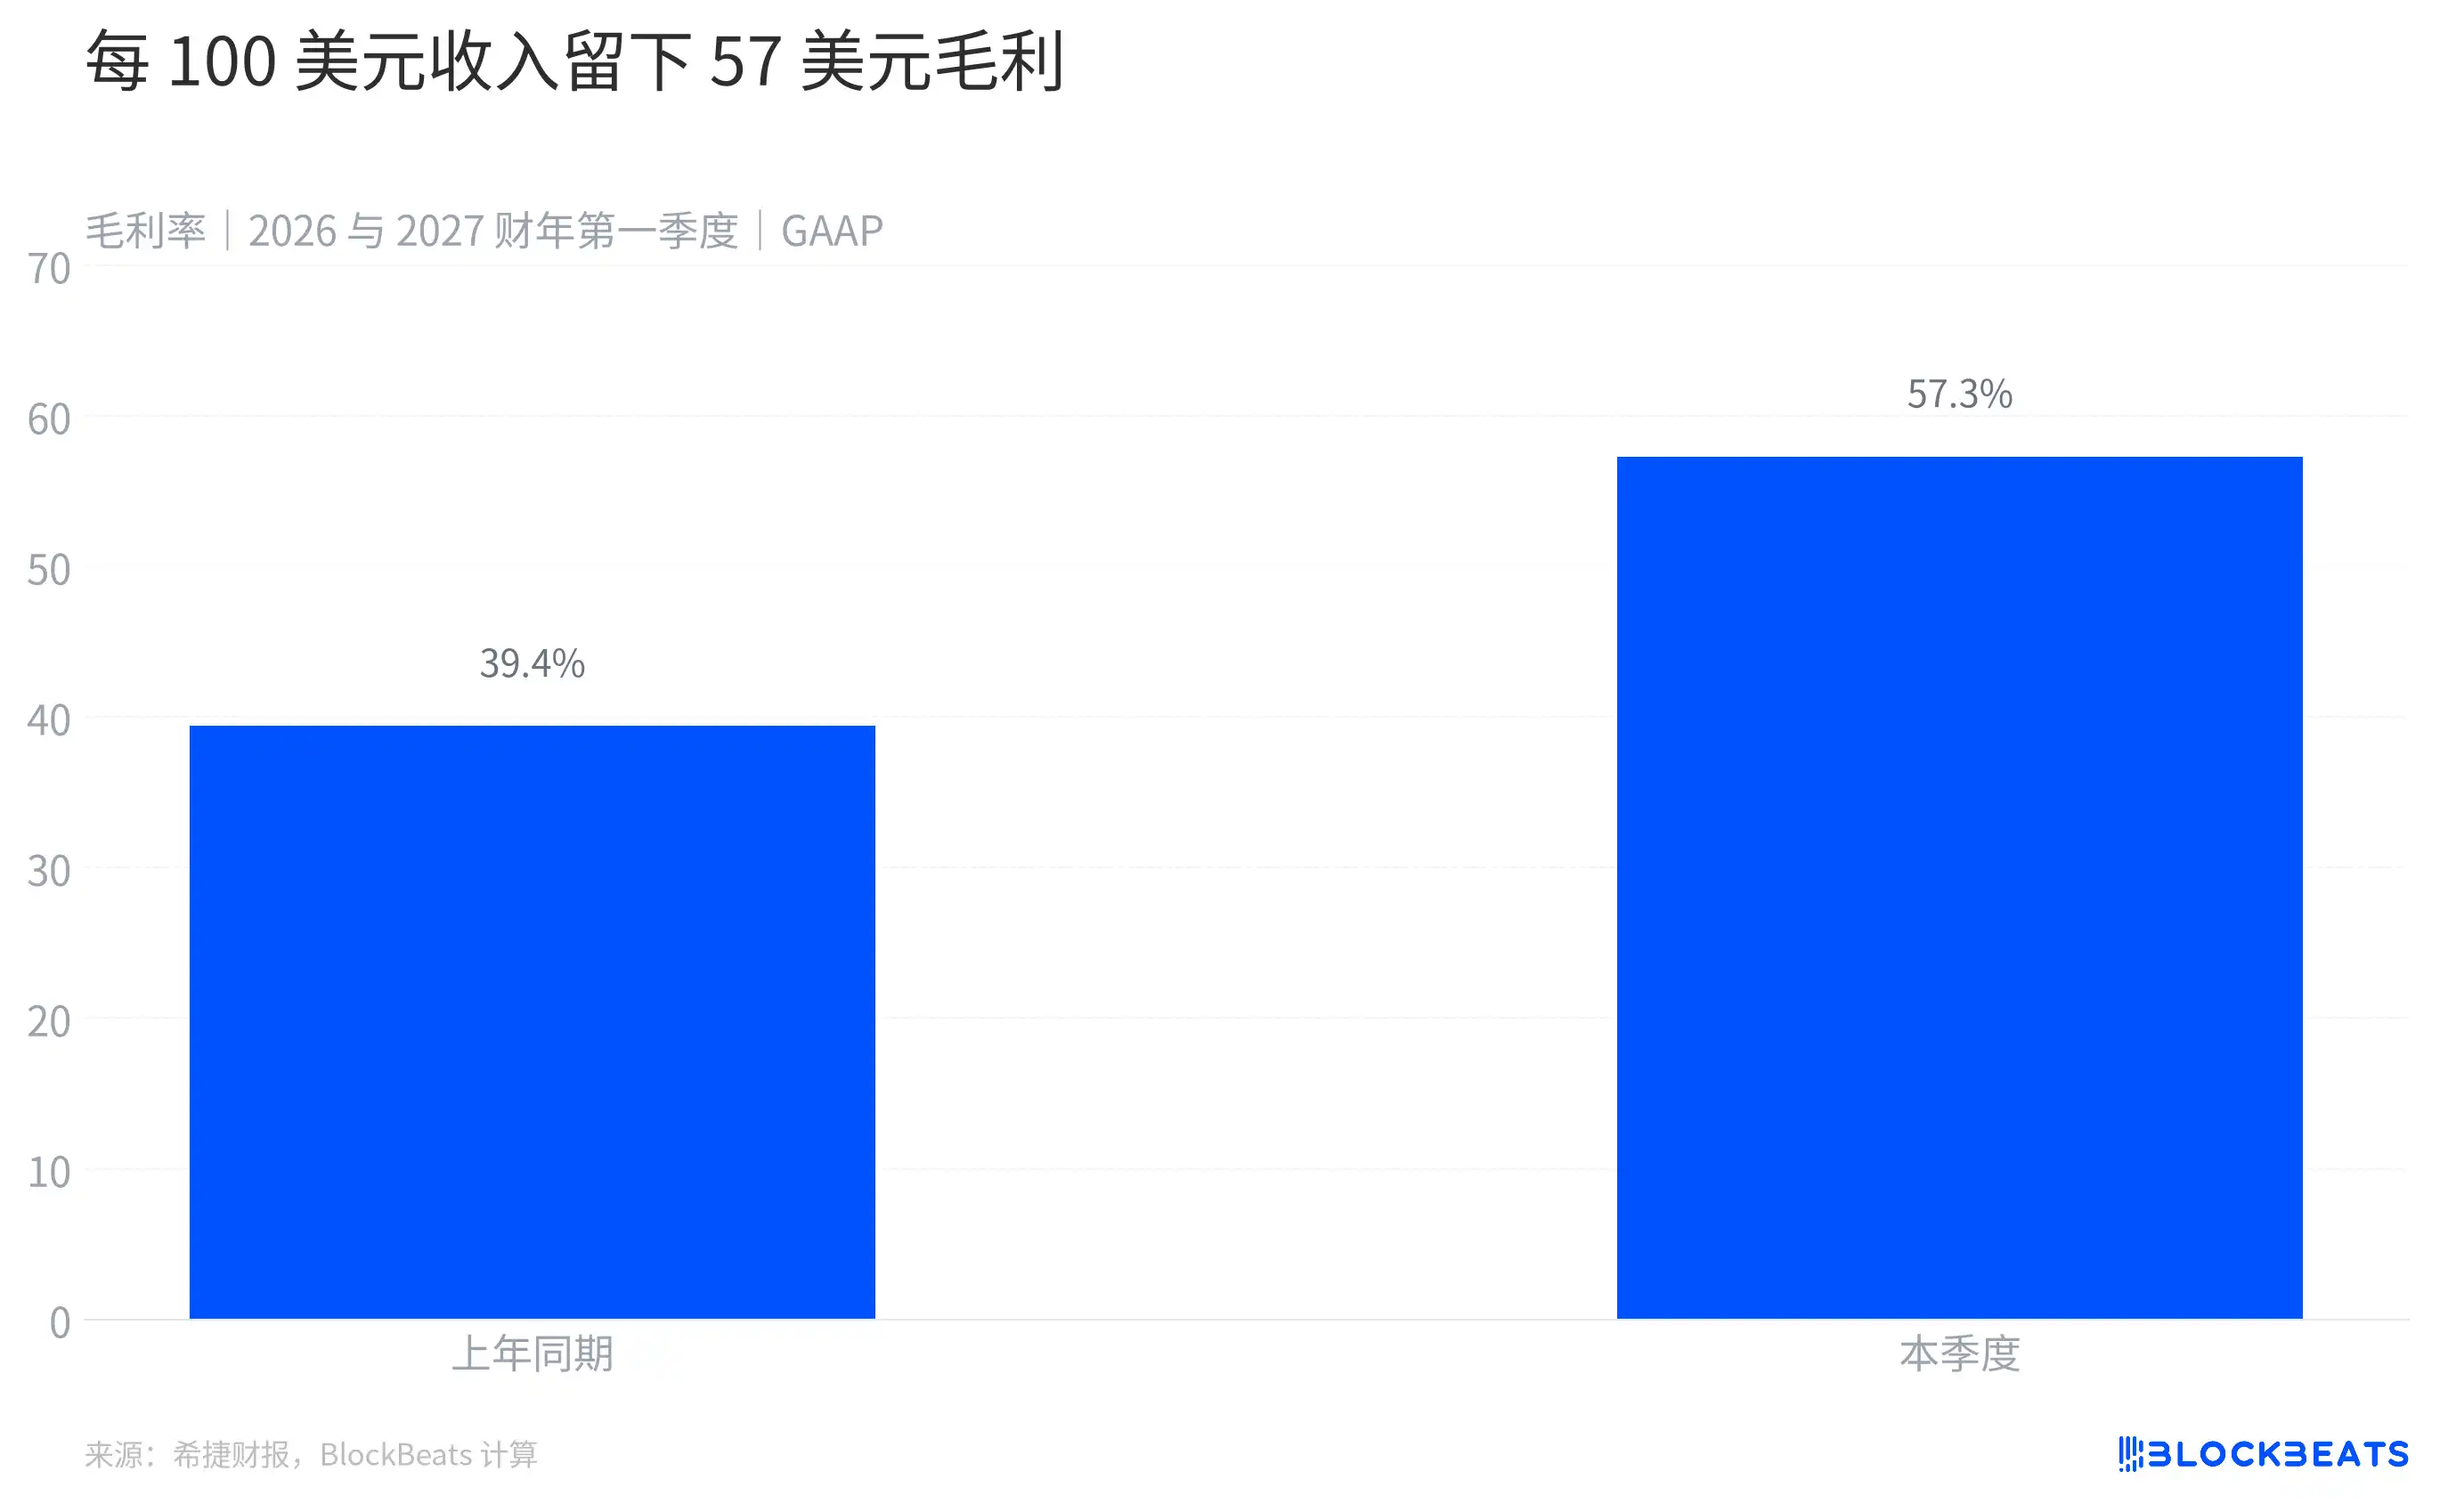
Seagate gross margin
Seagate's GAAP gross margin this quarter was 57.3%, up 17.9 percentage points from 39.4% a year earlier. Understood in these terms, for every $100 of revenue received, about $57 remains after deducting cost of revenue to cover other expenses and generate profit.
Higher gross margins do not automatically mean that every hard drive purchased by every customer rose by the same magnitude. Seagate simultaneously sells products of different capacities and uses, and changes in price, product mix, manufacturing costs, and scale can all affect overall gross margin. Based on the summary data in this press release alone, it is impossible to precisely attribute this quarter's change to any single one of these factors.
However, the company has previously disclosed where demand comes from. Seagate said in the fourth quarter of fiscal year 2026 that results were driven by strong demand from cloud data centers. In its latest earnings report, the company also mentioned that data generation, retention, and reuse are driving storage demand, and said it will meet capacity demand by increasing hard drive areal density while maintaining supply discipline and a value-based pricing strategy.
"Capacity" here is not entirely the same thing as "number of hard drives." Seagate uses heat-assisted magnetic recording technology, or HAMR, to increase disk areal density so that a single hard drive can store more data. For data centers, the focus is not just how many hard drives are purchased, but also how much data can be accommodated within limited space and infrastructure.
Demand, pricing, and the technology roadmap together form the operating backdrop. Although the supplementary materials show that capacity and revenue change at different rates, existing disclosures are still insufficient to precisely break down the price, volume, and mix contributions of each product.
Did profit really turn into cash?
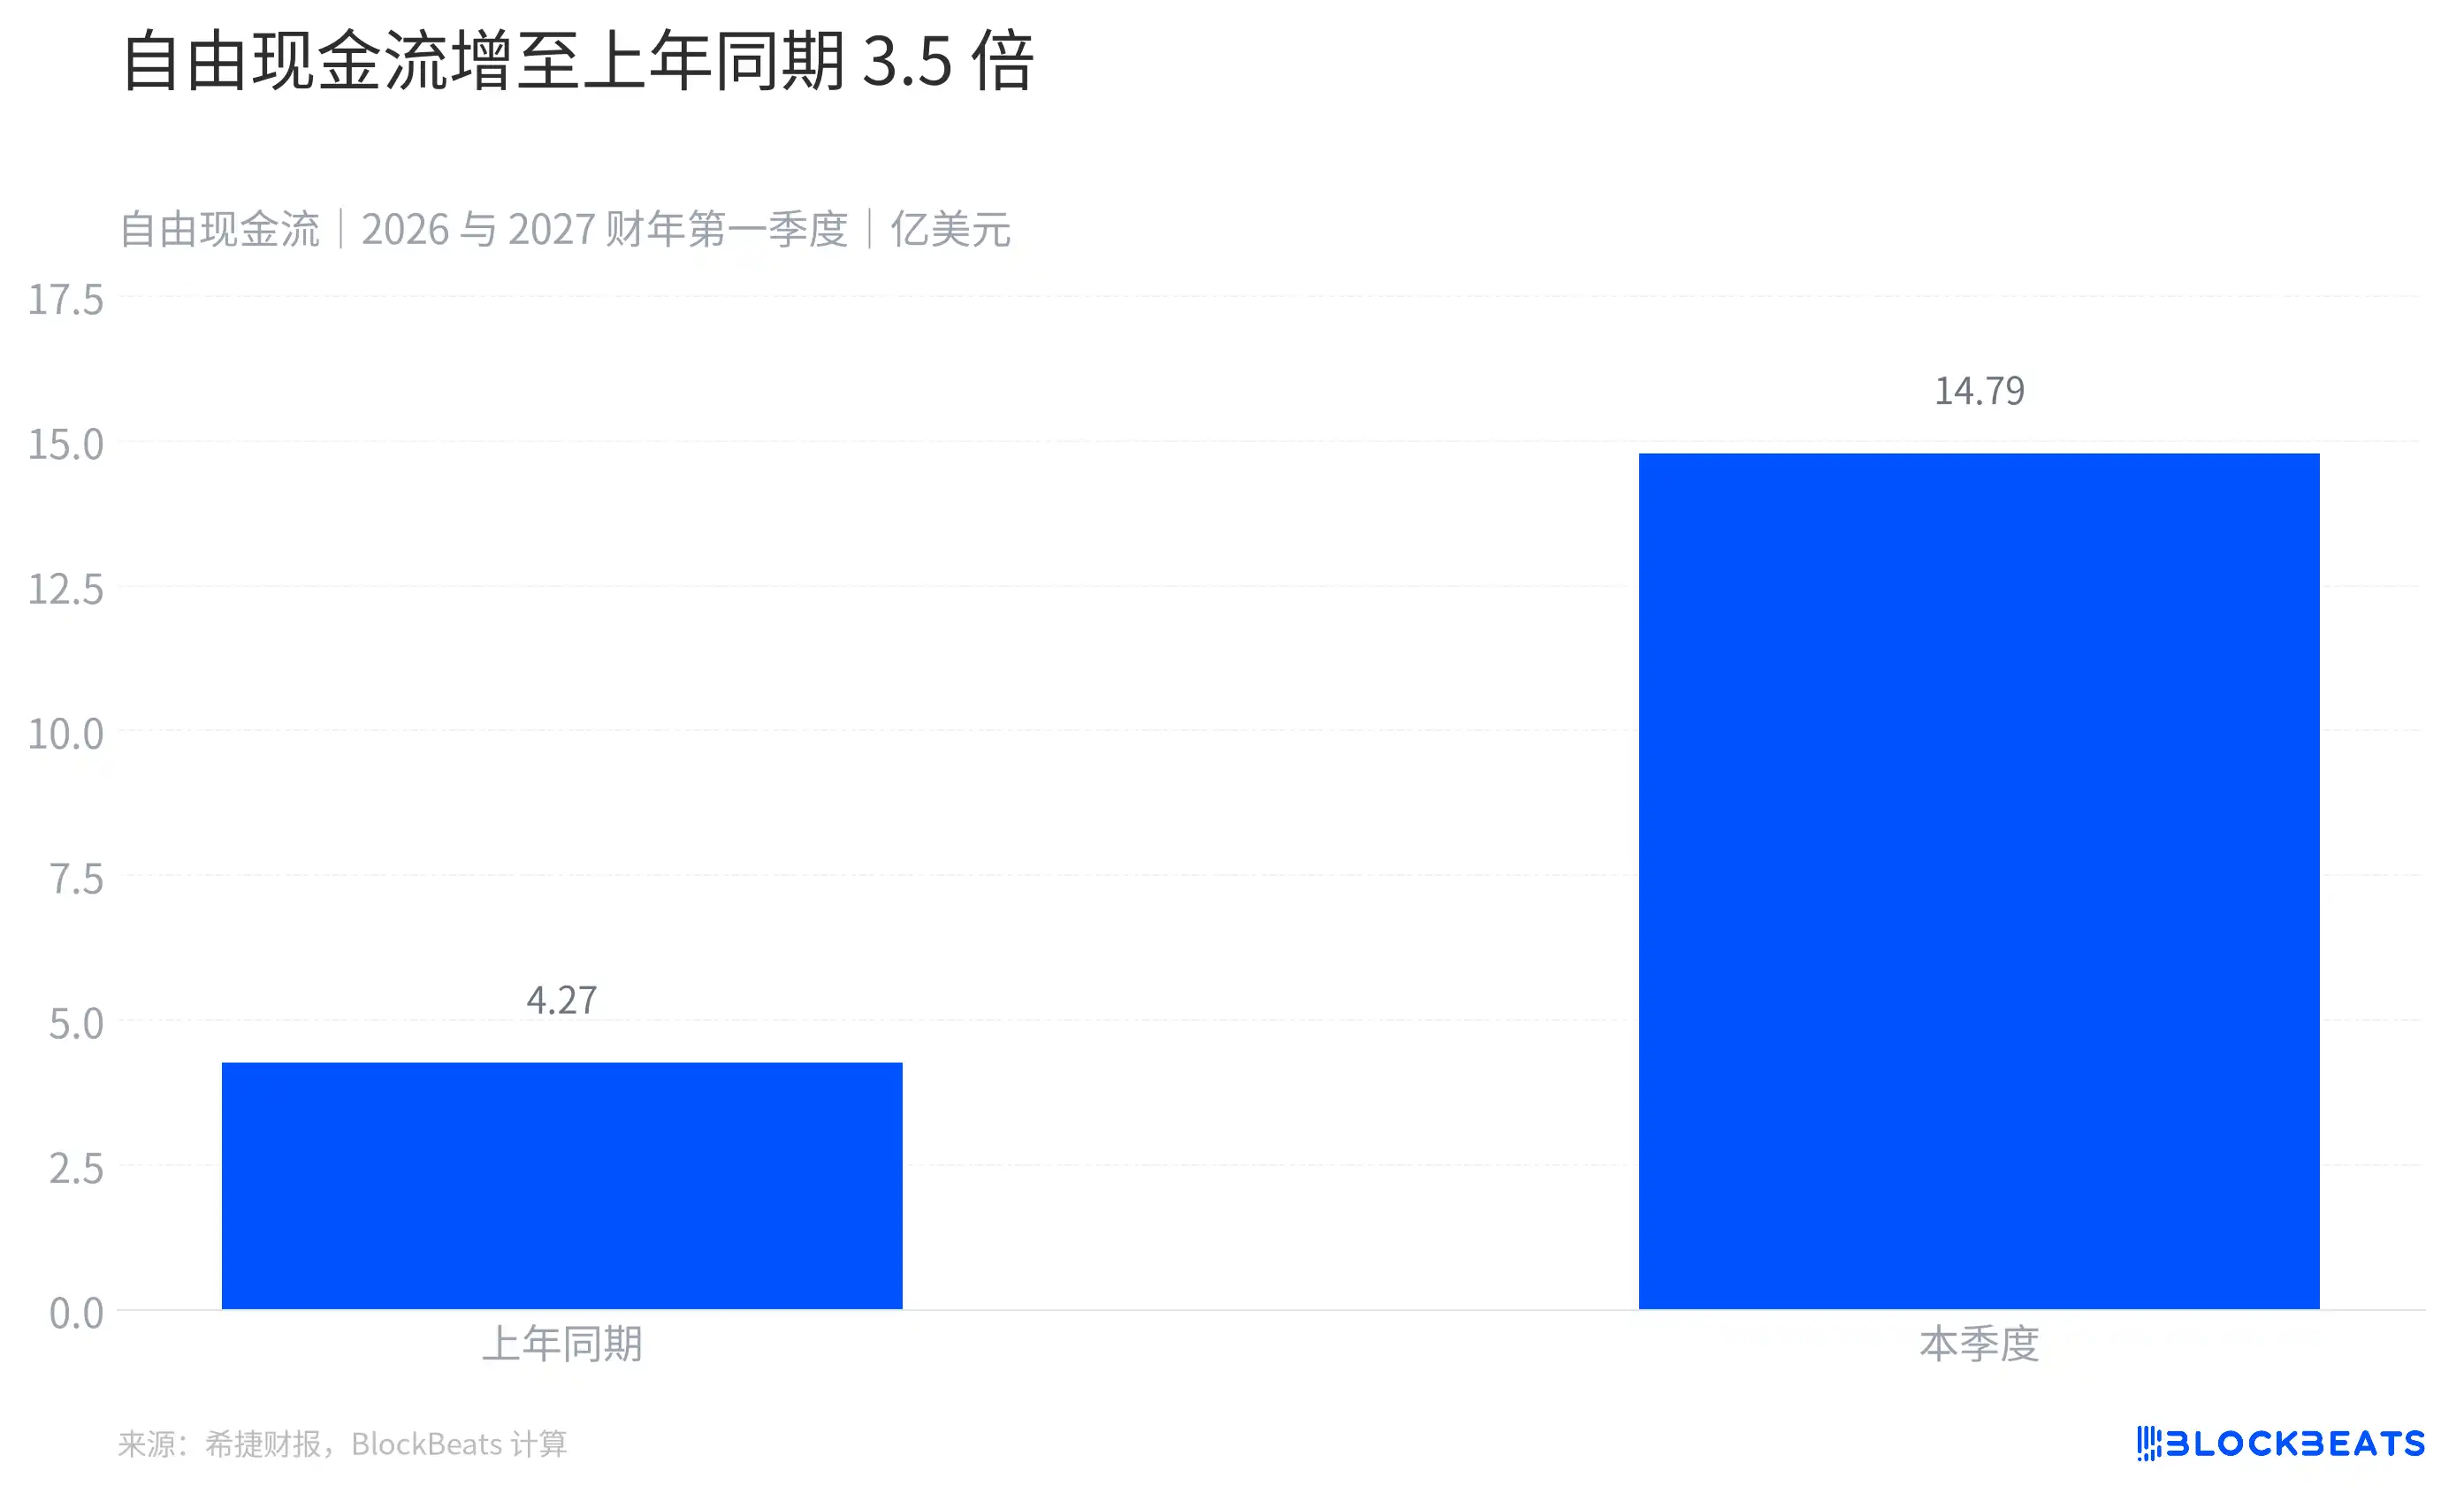
Seagate free cash flow
Beyond the income statement, Seagate's cash flow from operating activities this quarter was $1.69 billion. After deducting expenditures such as purchases of property and equipment, free cash flow was $1.479 billion, about 3.5 times the year-ago period.
Free cash flow is a non-GAAP measure used by the company, calculated as operating cash flow minus related capital expenditures. It can help observers see what remains of cash generated by operations after investing in equipment, but it does not equal money that can all be distributed to shareholders.
Where the cash went is also written in the earnings report. The company said that during the quarter it repaid about $1.2 billion in debt principal and returned $568 million to shareholders through dividends and share repurchases. Debt redemption and repurchase expenditures in the cash flow statement were $1.262 billion, which is a different basis from the repaid principal.
This set of accounts also reminds readers that stronger cash generation does not necessarily mean the cash balance will increase. Seagate's cash and cash equivalents at period-end were $1.258 billion, lower than $1.704 billion at the end of the previous quarter. In the same quarter, the company both repaid debt and repurchased shares, and also made capital expenditures. Inflows and outflows of funds together determined the ending balance.
After the quarter ended, the company also repaid an additional $750 million in debt principal, bringing total debt down to approximately $1.6 billion. This figure occurred after the reporting period and should not be treated as the quarter-end balance.
What does the company expect for the next quarter?
Seagate expects revenue of $4.8 billion for the second quarter of fiscal 2027, plus or minus $100 million. At the midpoint of guidance, that is about 13% higher than the just-reported quarter. The company also expects non-GAAP diluted earnings per share of $9.20, plus or minus $0.20.
This is only management's forecast for the next quarter, not realized revenue. The EPS guidance uses a non-GAAP basis and is not the same metric as the GAAP net income discussed earlier in this article.
This earnings report most clearly demonstrates one change: when revenue grows faster than costs, a hard drive manufacturer's profit and cash flow can expand faster than revenue.
Welcome to join the official BlockBeats community:
Telegram Subscription Group: https://t.me/theblockbeats
Telegram Discussion Group: https://t.me/BlockBeats_App
Official Twitter Account: https://twitter.com/BlockBeatsAsia
 Related Articles