The US Treasury Department Steps In to Support the Market, but Zero-dollar Repos Appear Ineffective

On the afternoon of August 19, the U.S. Treasury Department changed a number on its official website.
The single transaction limit for long-term Treasury bond repurchase was raised from $20 billion to $40 billion.
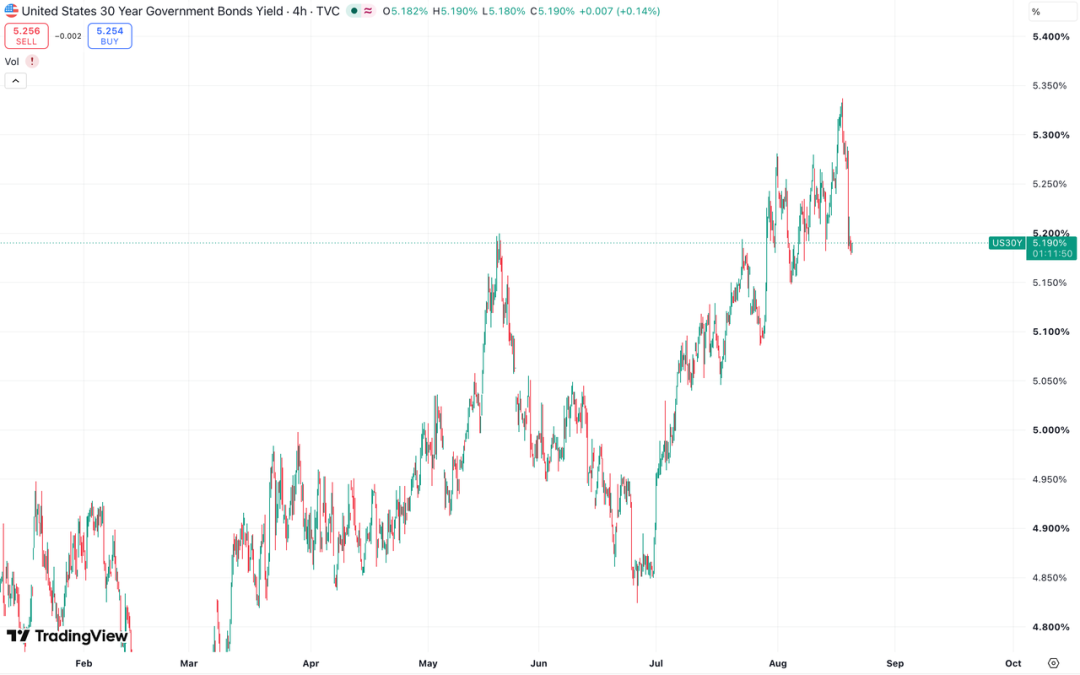
No new repurchase transactions took place that day. The Treasury Department did not spend an extra dollar. However, the 30-year Treasury yield quickly fell by about 9 basis points.
Here, a basis point is the second decimal place of an interest rate. An increase of 9 basis points is equal to 0.09%. The Treasury yield is the interest rate offered by the U.S. for borrowing, and an increase in yield indicates that borrowing has become more expensive.
This interest rate had already been stretched tight. On August 18, the 30-year Treasury yield hit a high not seen in 19 years. The U.S. government is the largest borrower in this market, holding around $30 trillion in marketable Treasury securities. If all these securities were refinanced at a rate 1 basis point higher at the same time, the annual interest cost would increase by about $30 billion. This wouldn't happen all at once; instead, the old debts mature gradually, and the cost increase would also come in gradually. But the direction is clear.
It is not only setting prices for the U.S. Treasury Department. Mortgage rates for Americans, interest rates for corporate borrowing, and the compensation investors demand when other countries issue bonds often take a reference from this curve. The long end refers to the segment where borrowing is for a longer term, including the 10-year and 30-year periods. If the long end suddenly becomes more expensive, the market won't see it as just a problem for bond traders.
This time, the Treasury Department adjusted the amount for repurchasing long-term Treasury bonds.
Repurchase might sound like getting a promissory note back, reducing debt. But it's not that straightforward. The Treasury Department usually uses the cash raised from new issuances to repurchase older, less liquid securities in the market, and then continues to issue new Treasury bonds. The total debt does not disappear magically. What changes is which batch of bonds the market holds more of and which batch is harder to sell. For a trader holding a particular segment of long-term bonds, this difference is significant.
Upon the announcement, the long-term yield fell. Even before the money went out, the market had already priced in the money that might go out in the future.
On the same day, gold rose by about 4%, the U.S. Dollar Index dropped to its lowest level since mid-May, and the S&P 500 closed up 0.34%. Superficially, this looks like a familiar trade. As yields fall, risk assets breathe a sigh of relief.
But upon closer inspection, things are not so neat.
The day before, the Treasury Department actually bought $20 billion
In the regular repurchase on August 18, traders wanted to sell about $200 billion in Treasury bonds to the Treasury Department, but the Department only bought $20 billion.
This money was not sitting idle. It provided a buyer for some old notes and signaled to the market which notes the Treasury Department was willing to touch. However, after the operation, long-end yields still moved higher.
A day later, the Treasury Department did not buy any bonds but only increased the limit on the schedule, yet prices moved.
Here lies the true significance of this event. The market was not just trading today's $20 billion but was also trading on a schedule for the upcoming weeks. The schedule informed everyone how much the Treasury Department was willing to take if long-dated bonds continued to have poor demand. No one needed to wait for their move; positions could be adjusted beforehand in that direction.
Yellen has always known that the role he plays here is not quite like a traditional Treasury Secretary. He has referred to himself as the United States' "Chief Bond Salesman" multiple times and openly set a goal of pushing the 10-year Treasury yield below 4%.
The most challenging moment for a salesman is not when they have no inventory, but when everyone is asking the same question: how much of a discount should we apply to this batch of inventory?
On August 18, the Treasury Department used $20 billion without changing the answer. On August 19, it doubled the potential purchase amount, prompting the market to reevaluate this discount.
The extra $140 billion from seven operations is small in the new bond
According to the tentative schedule released by the Treasury Department, between September 9 and November 4, there are a total of seven buybacks for the long-end. The limit for each operation has been raised from $20 billion to $40 billion, making the total amount bought back in the seven operations increase from $140 billion to $280 billion.
What has actually increased is the additional $140 billion.
During the same quarter, the Treasury Department plans to issue over $230 billion in new bonds from the 10-year to the 30-year maturity. Comparing $140 billion to this amount, it only corresponds to approximately 5.9%. Furthermore, this is a favorable ratio for buybacks. The buybacks target existing old notes, while the new bonds represent a different set of securities. The market is truly facing the entire yield curve and the constantly rolling outstanding securities.
From an interest rate risk perspective, this money does appear significant compared to face value. The longer the borrowing, the more sensitive the bond prices are to interest rates. The bond market refers to this sensitivity as duration. If the Treasury Department buys notes around the 30-year maturity, the $140 billion taken would represent approximately 30% of the duration of a 30-year auction.
But a 30% auction is not a 30% market.
Using the duration estimate commonly seen in quantitative easing studies to mechanically extrapolate, this incremental amount would have a less than 1 basis point direct impact on yields. This algorithm is not the final verdict. Quantitative easing involves continuous central bank purchases, while Treasury buybacks are a finite number of security management. The buyers, expectations, and funding sources are different. However, it does indicate one thing: it is challenging to attribute the 9 to 11 basis point fluctuations at the long end solely to the $140 billion cash flow on that day.
The remaining part, no one can accurately disaggregate. The market will not explicitly delineate at each basis point which belongs to actual supply, which belongs to traders unwinding positions in advance, and which comes from speculation on the Treasury Department's next steps.
Some people were reminded of the 1961 "Operation Twist." That year, the Fed and the Treasury Department tried to push down long-term interest rates by selling short-term debt and buying long-term debt. The two actions are not the same. The action back then involved a true maturity transformation. This time, it involved a change in upper limits. However, they both encountered the same problem: if the government does not want the price of long-term borrowing to continue to rise, how much debt can they take out of the market's hands.
On August 19, the market answered a part of that question on behalf of the Treasury Department.
The Bond Market Only Pressured the Long End, Inflation Was Unmoved
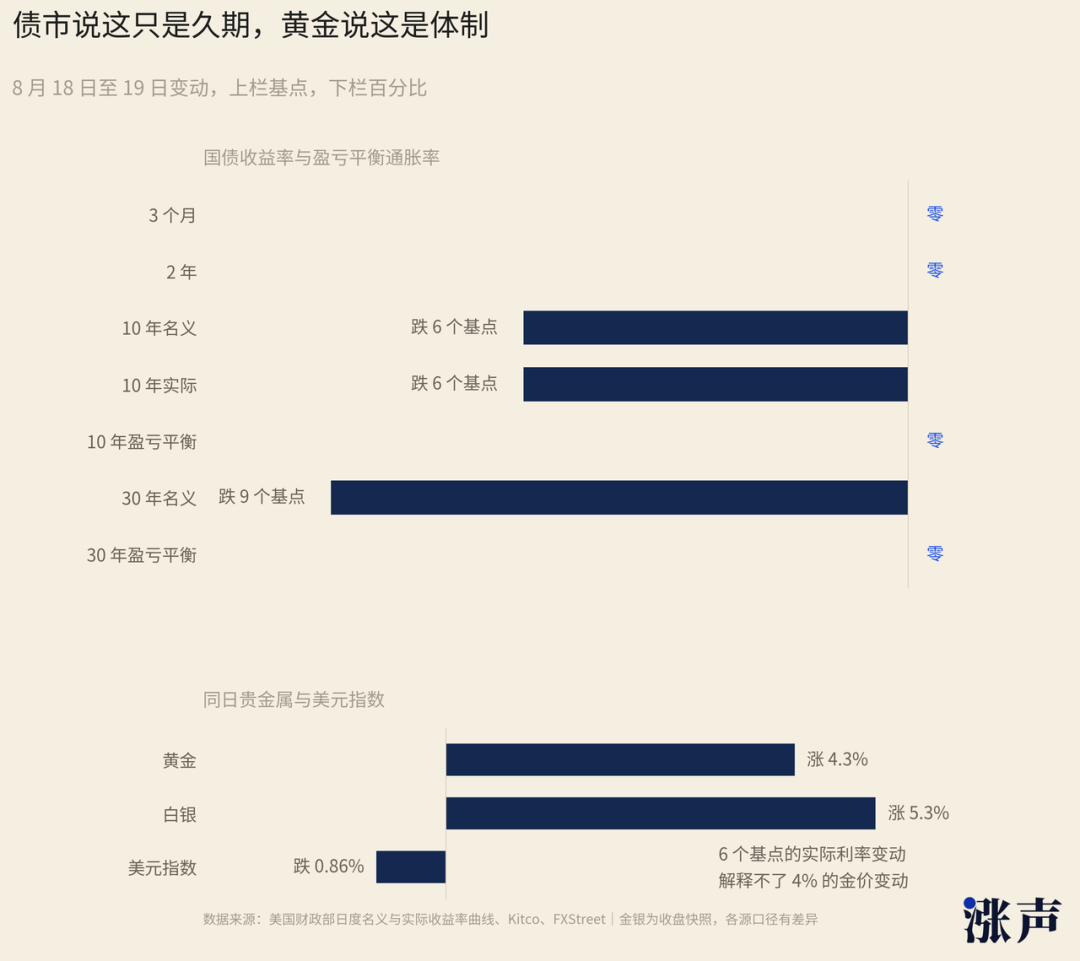
Looking at August 18 and 19 together, the 10-year nominal yield fell by 6 basis points. The nominal yield is the market return corresponding to the bond's face value.
During the same period, the real yield on 10-year Treasury Inflation-Protected Securities (TIPS) also fell by 6 basis points. It subtracts the market's compensation for inflation, getting closer to the purchasing power that investors can truly obtain.
Both lines moved downward together, and the 10-year breakeven inflation rate sandwiched in the middle remained unchanged. The same applied to the 30-year breakeven rate.
The breakeven inflation rate is not a crystal ball; it also involves liquidity and risk premiums. But with both sides moving down by the same magnitude and the difference unchanged, at least it indicates that the bond market did not bet on raising long-term inflation expectations following this news. The 2-year and 3-month yields hardly reacted, indicating that traders did not interpret it as the Fed changing its interest rate hike or cut trajectory.
The minutes of the Fed's July meeting released that evening had a slightly hawkish tone. Three members at the meeting advocated for an immediate 25-basis-point rate hike. Normally, such documents would nudge rates in the other direction. After the bond market reviewed it, the short end remained calm. After reviewing the Treasury Department's schedule, the long end moved first.
On the same day, two documents. One discussed how expensive money should be borrowed, and the other discussed how many IOUs for borrowing long should be removed from the market's hands.
Bond traders temporarily treated it as the latter.
Gold Doesn't Believe This Is Just a Yield Curve Control
Gold and the U.S. Dollar received a different message.
Gold rose by around 4% that day, while silver saw an even larger increase. The U.S. Dollar Index fell by 0.86%, breaking below the 200-day moving average to its lowest level since mid-May. The 200-day moving average is just the average price over the past 200 trading days, but many algorithms and funds treat it as a significant line. When the price crosses it, some positions will not ask for reasons and will begin unwinding directly.
During the Asian and European sessions on August 20th, the price of gold dropped back below $4,500, erasing most of the gains from the previous day.
Deutsche Bank's foreign exchange research head, George Saravelos, referred to this phenomenon as "soft financial repression." This term is not mysterious. The government is unwilling to let interest rates rise to the levels that the market would naturally dictate, so it uses debt issuance arrangements, bond buybacks, and policy signals to push down the price of long-term borrowing. No one is mandated to lend at low rates, hence it is soft. The losing end, however, remains clear — those receiving interest get a little less, and those borrowing pay a little less.
Saravelos places this in the context of "twisted operations." Gennadiy Goldberg from TD Securities used a shorter phrase, suggesting that the Treasury is engaging in "verbal intervention." Wil Stith from Wilmington Trust sees another layer to it, noting that the Federal Reserve and the Treasury are pushing in not entirely the same direction.
The bond market may only witness a change in the supply of long-term bonds. Gold cannot forget that those issuing bonds are also the ones setting the rules.
If long-term interest rates are being capped on a schedule while the Fed's meeting minutes still hint at tightening, adjustments need to be found elsewhere. The foreign exchange market is the most vulnerable to catching this unease first.
The S&P Only Rose 0.34%, But Changes Are Underneath the Surface
At the close of the U.S. stock market, the easiest sentence to write was that a decline in yields led to a return of risk appetite, and the S&P 500 rose by 0.34%.
However, the number of rising stocks far exceeded the number of falling ones that day. The NYSE advance/decline ratio was about 1.56 to 1, and the Nasdaq ratio was about 2.16 to 1. For every falling stock, there were more than one rising stock.
Despite this, the Nasdaq 100 ended the day in the red, and the Philadelphia Semiconductor Index fell by nearly 2%.
What weighed on the index were the heaviest-weighted tech stocks. Conversely, what supported the index was the healthcare sector, which surged over 3% that day, hitting a new all-time high. Moderna jumped by about 177% in a single day after its personalized mRNA cancer vaccine received positive Phase 3 data. Phase 3 trials are one of the largest hurdles before a drug is approved for market, and when a company successfully clears this stage, its stock price can react as if it suddenly adopts a new valuation system.
Therefore, that day was not a case of "all stocks rising." Funds were simultaneously pouring into healthcare and small-cap stocks while exiting from the most expensive, future cash flow-dependent tech stocks.
This divergence has been brewing for a while now. In market-cap-weighted indexes, the big companies hold the most sway. Equal-weighted indexes give each company an equal say. The equal-weighted index of the Fab Seven has only seen single-digit gains this year. Excluding these seven, the remaining 493 companies in the S&P 500 have actually performed better. The Russell 2000 has also seen its best year in 23 years.
Index investors have seen a steady upward trend. Those who bought the most popular stocks, however, have received a different report card.
$30 Trillion Still Outstanding, but Interest Rates Are Already Knocking
The sell-off in tech stocks does not equate to a sudden disappearance in AI demand.
What the market is more concerned about is the money these companies have promised to pay in the future.
Long-term contracts for data center leases. Commitments to buy computing power. Power, server, and supply agreements. Some of these items may be classified as liabilities, while others are only disclosed in footnotes in financial reports and cannot all be labeled as debt. The common thread is that the payment due date hasn't arrived yet, but the cash flow for the next few years is already spoken for.
In a recent analysis by The Wall Street Journal of nine large tech firms, these future commitments add up to around $30 trillion. Their publicly disclosed annual capital spending totals about $600 billion.
When you put the numbers together, the shape of the problem becomes apparent. The money companies are spending each year is one layer, while the money they've committed to but haven't paid yet is a much larger layer.
As long-term interest rates rise, this larger layer starts to look less attractive. When refinancing is needed, money becomes more expensive. Trying to justify today's investments with profits further into the future faces higher discount rates. With reports of slower-than-expected revenue growth from Anthropic and OpenAI, the market naturally starts to question whether the same batch of future cash flows will be enough to cover those commitments made long ago.
On August 18, investors weren't selling the idea of AI. What they were reassessing was a very long schedule of payments.
The Korean market took a more direct approach to this issue. On August 18, the KOSPI fell by 5.8%, with SK Hynix dropping nearly 10%. As a major memory chip manufacturer and a supplier to NVIDIA, on the morning of August 20, SK Hynix announced a $28.6 billion buyback plan, leading to a 6% rebound in the index.
The buyback here and the one by the U.S. Treasury are not the same. When a company buys back its own stock, it returns money to its shareholders and signals to the market that it is willing to stand at a certain price with its cash. The Treasury buying old bonds, on the other hand, deals with how the IOUs stack up between maturities and securities.
Word is just a word, and account is not the same ledger.
On August 19, the U.S. Treasury made a move, simply adjusting the upper limit on the repurchase schedule.
The bond market interpreted it as the possibility of slightly fewer long bonds in the market in the coming weeks. Gold saw it as borrowers trying to constrain the price of borrowing. The stock market initially breathed a sigh of relief for the lower yields, but then turned around to calculate how much those distant payment promises were really worth.
On that day, the Treasury did not spend a single dollar for this change.
Yet in a market where a commitment lasts 30 years, an unredeemed promise already has a price.


Original Article Link
Welcome to join the official BlockBeats community:
Telegram Subscription Group: https://t.me/theblockbeats
Telegram Discussion Group: https://t.me/BlockBeats_App
Official Twitter Account: https://twitter.com/BlockBeatsAsia