Coherent's $2 Billion Quarter: Revenue, Profit Margin, and Capex

On August 12, U.S. photonics device manufacturer Coherent announced its FY2026 Q4 and full-year performance as of June 30. According to the company's performance report, the quarterly revenue was $20.46 billion, a 33.8% year-over-year increase. The figures in this latest quarterly report are marked as unaudited.
The company's management framed the demand in the context of AI data center connectivity transitioning from copper to optics, manufacturing capacity expansion, and ramping up growth platforms. However, if this financial report is directly translated as "AI Optical Interconnects Selling More," it would be too narrow a depiction. The company's current segment reporting is based on "Data Center & Communications" and "Industrial," with no detailed breakdown of quarterly revenue for AI data centers, traditional communications, and other specific products.
What truly deserves attention are the four tables in the same disclosure. The revenue trajectory for FY2026 has been consistently upward, with significant concentration in the year-over-year changes in segment revenue, and the non-GAAP operating profit margin outpacing the gross profit margin. There have also been significant changes in fixed asset additions, inventory, and cash flow within the same fiscal year.
What Kind of Curve is $20 Billion?
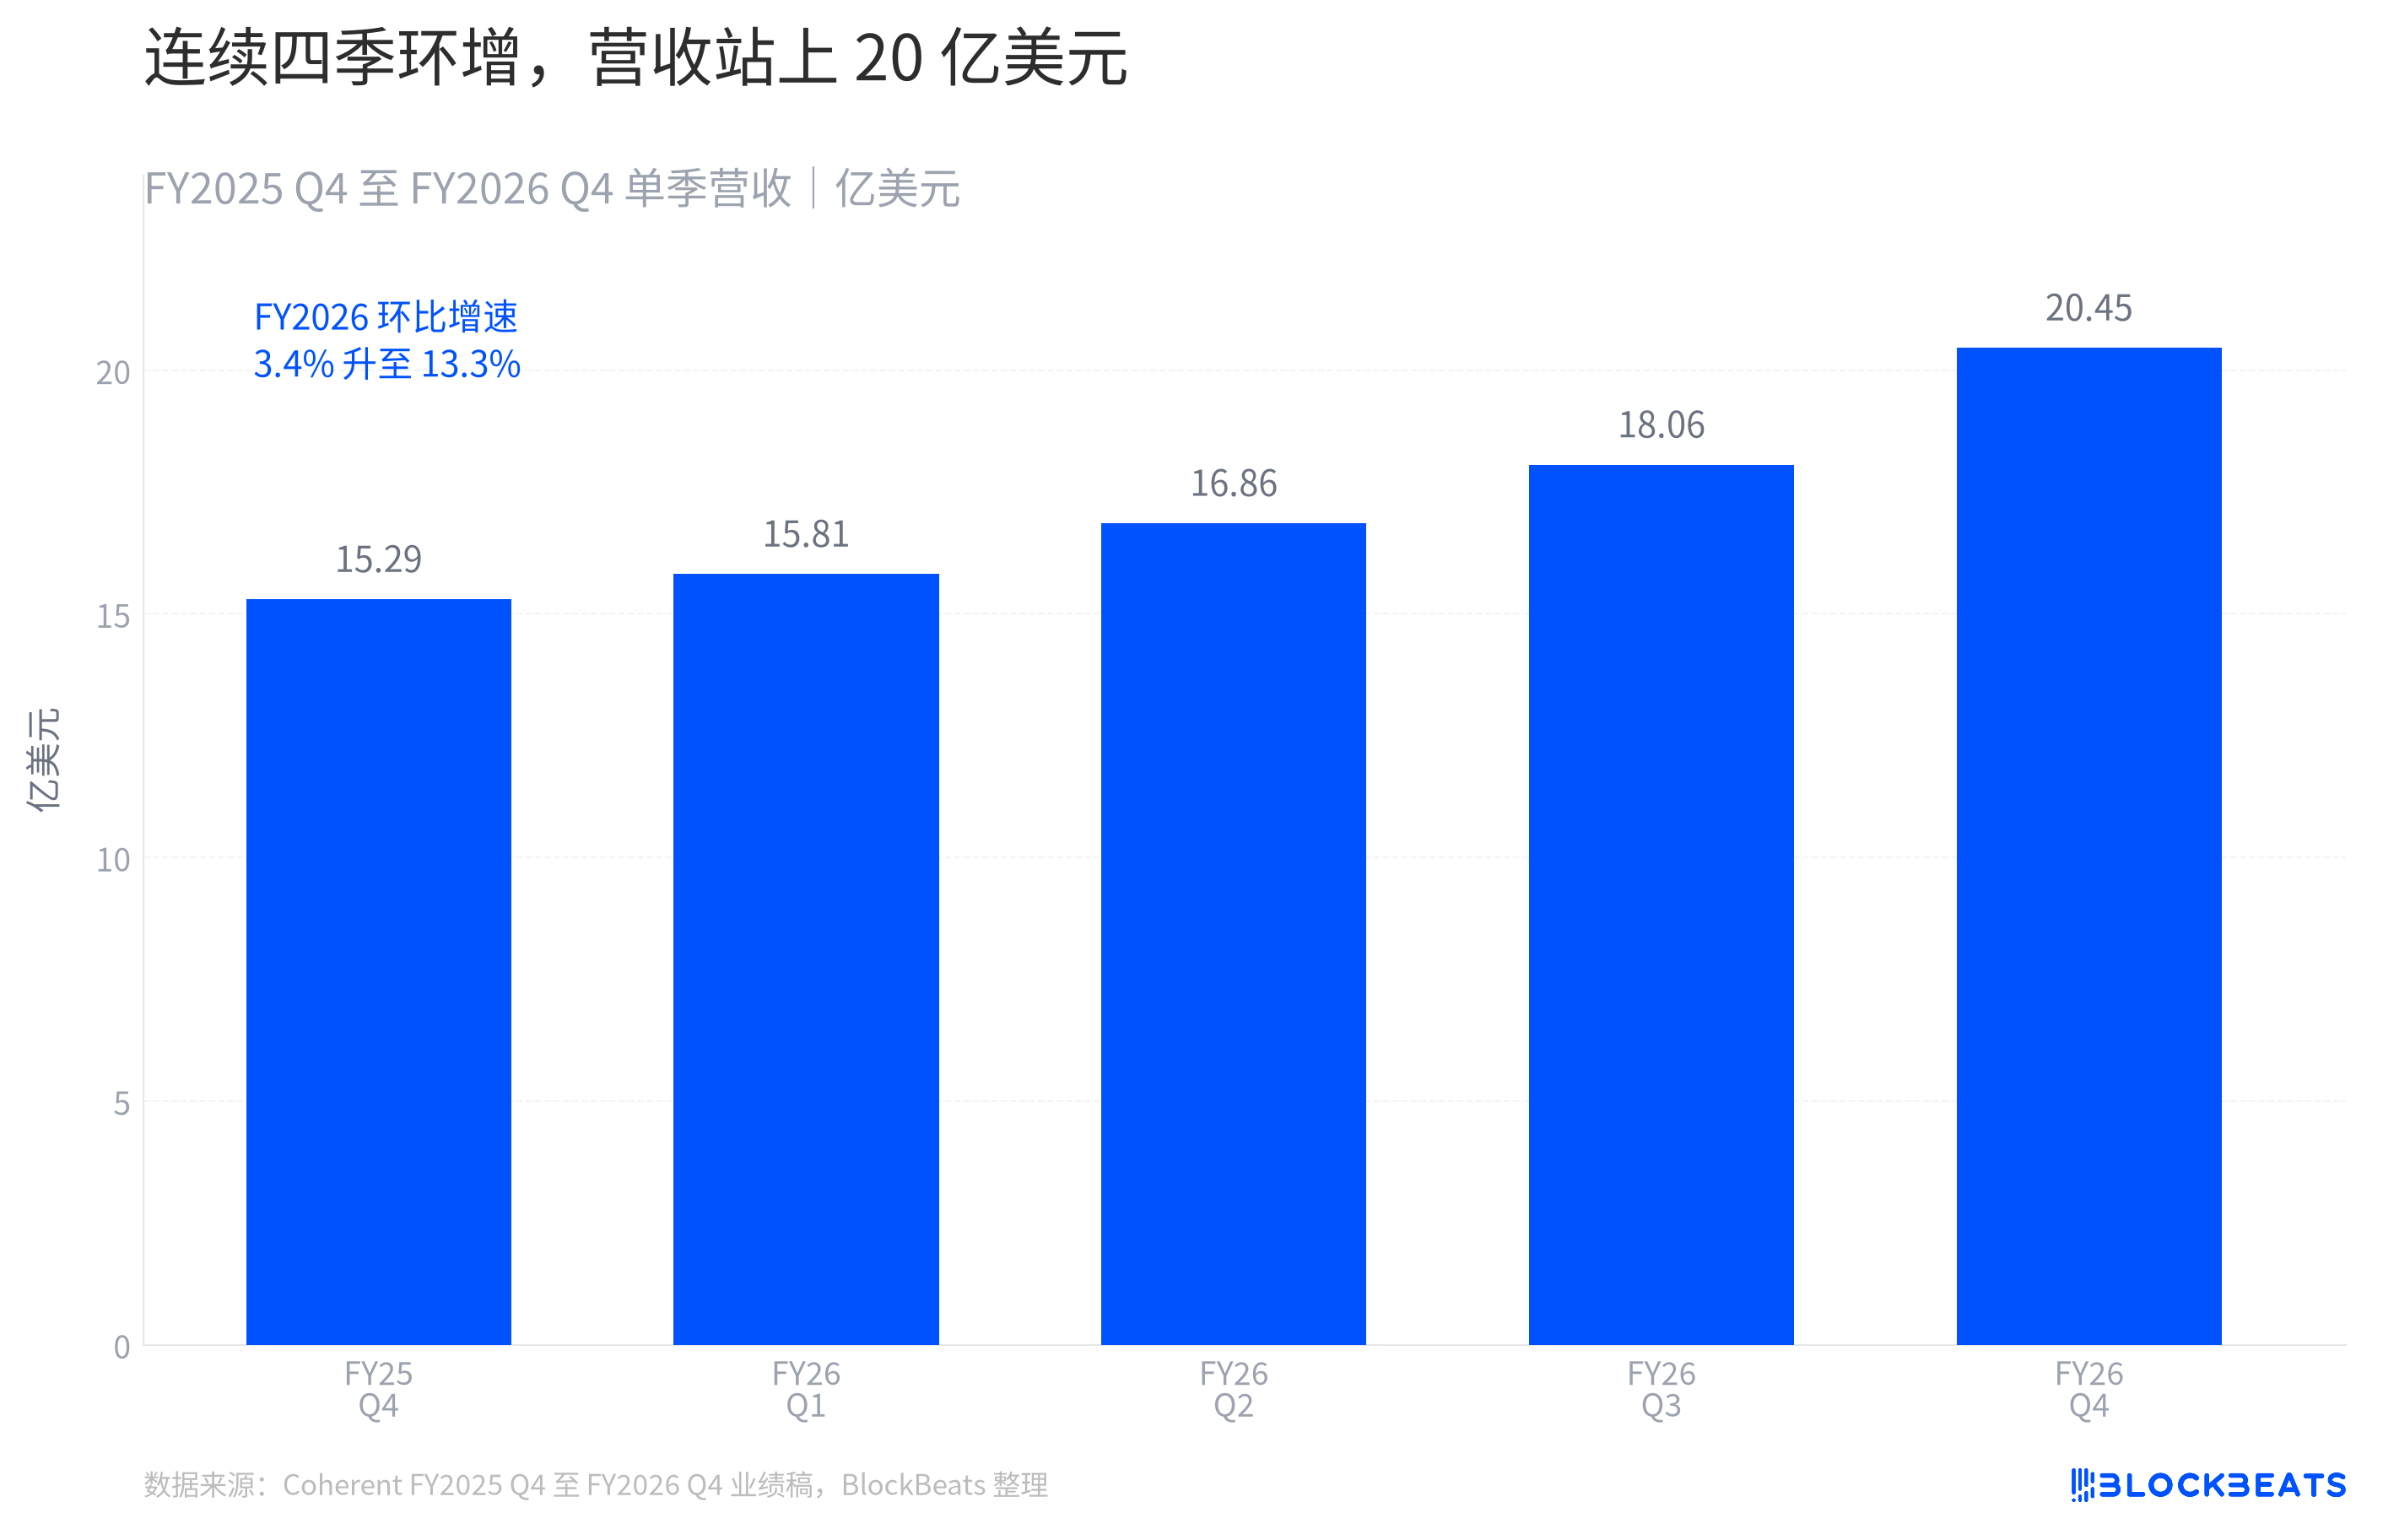
The focus of the first chart is not on the highest single bar. According to Coherent's quarterly performance announcements, the revenue for each quarter of this fiscal year has shown a sequential increase, reaching $20.46 billion in the final quarter with a 13.3% quarterly growth rate. The continuous upward trend in the chart implies more than just "crossing the $20 billion mark"; the latest quarter is part of a continuous growth trend.
According to the company's FY2026 Q4 performance report, the latest quarter's statutory year-over-year growth rate is 33.8%. The company has also disclosed the pro forma year-over-year growth rate excluding divested businesses. These two figures serve different purposes and should not be used interchangeably as the same growth rate.
The company has provided a revenue guidance of $22 billion to $24 billion for FY2027 Q1. As per the company's announcement, this is a forward-looking estimate for the next quarter, should be presented separately from realized quarterly revenue, and should not be construed as orders or revenue recognition.
Where Did the Additional Revenue Go?
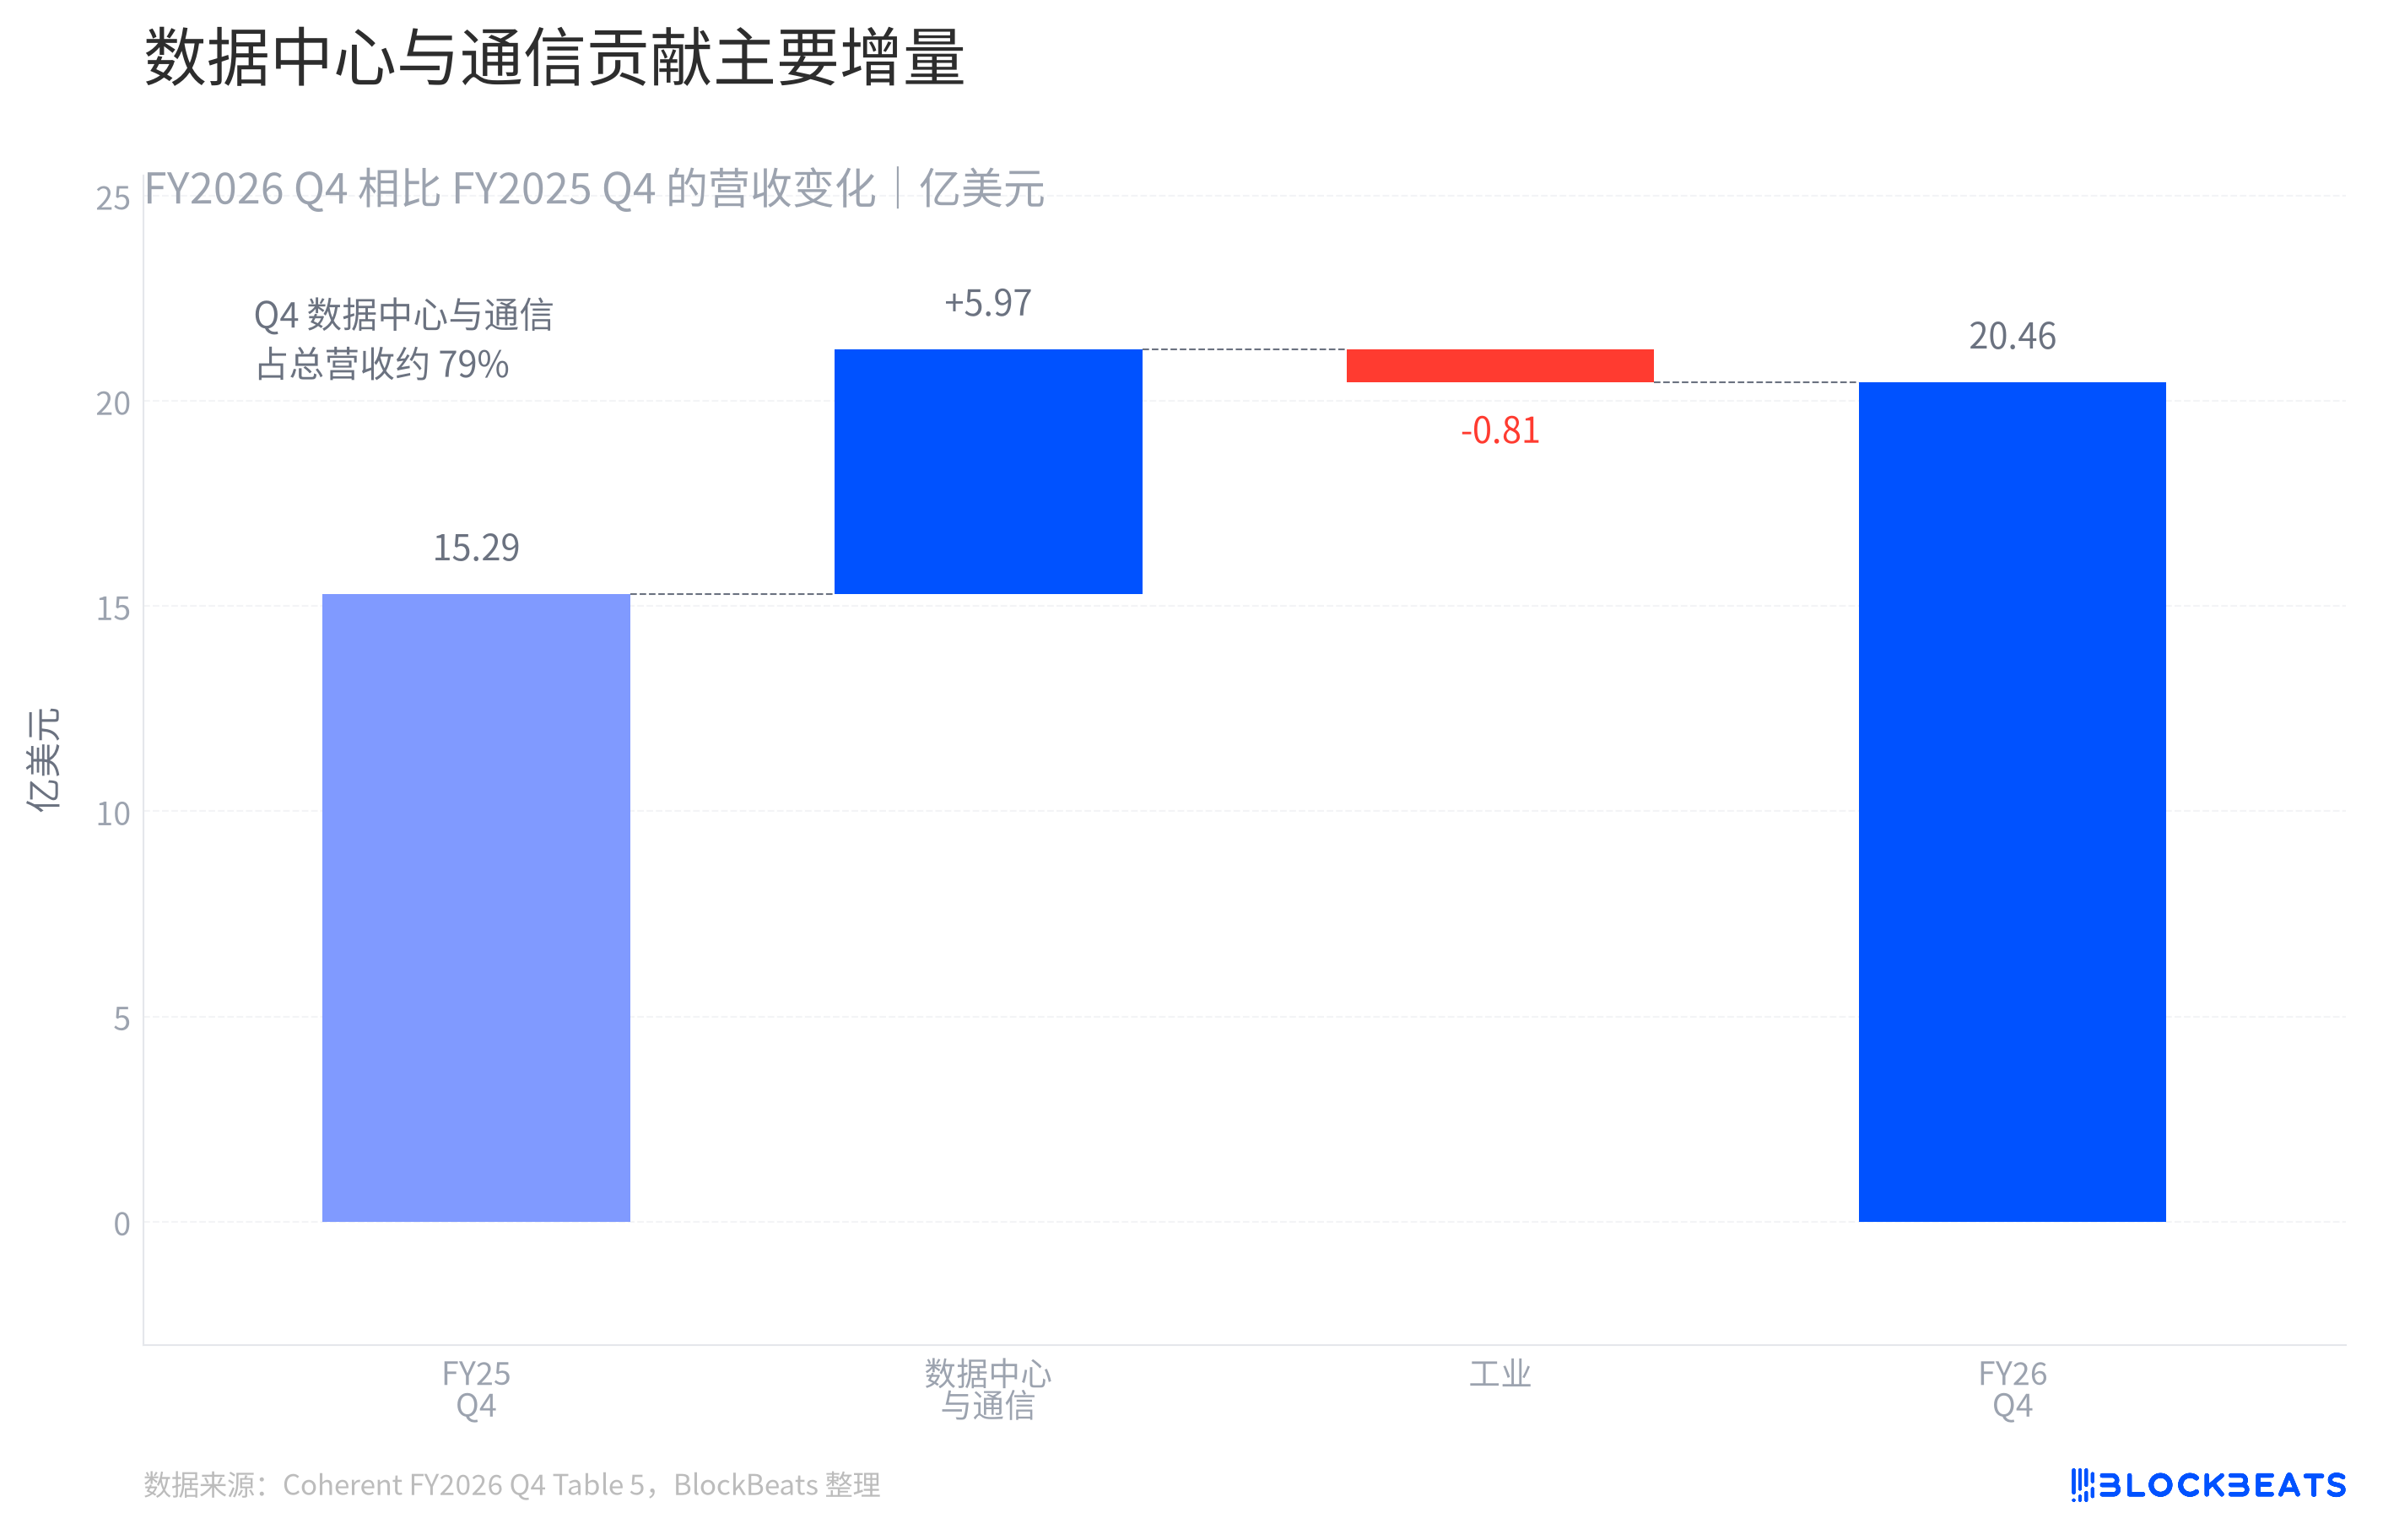
The second chart breaks down the year-over-year revenue change into two opposing forces. According to the company's FY2026 Q4 segment revenue table, the Data Center & Communications segment increased by $597 million compared to the same period last year.
On the other hand, the Industrial segment decreased by $81 million year-over-year, resulting in a net increase in company revenue of $516 million. In other words, the increase in the Data Center & Communications segment exceeded the net revenue increase for the entire company, while the decline in the Industrial segment offset some of this growth.
According to the same Income Statement, the Data Center and Communications segment's Q4 revenue was $16.15 billion, accounting for approximately 79% of the company's quarterly revenue. This proportion indicates a heavier focus on this segment's revenue and does not necessarily mean that 79% of it is from AI Optical Interconnect. The financial report did not provide a breakdown at the product, customer, or order level, making it impossible to infer the specific contribution of a certain type of product from the segment name.
The value of this chart lies in its ability to draw two distinct lines simultaneously. The company disclosed where the growth mainly came from, but the report did not address which products and customers within that segment are driving it. These two aspects should not be conflated.
Why Operating Profit Margin Is Accelerating
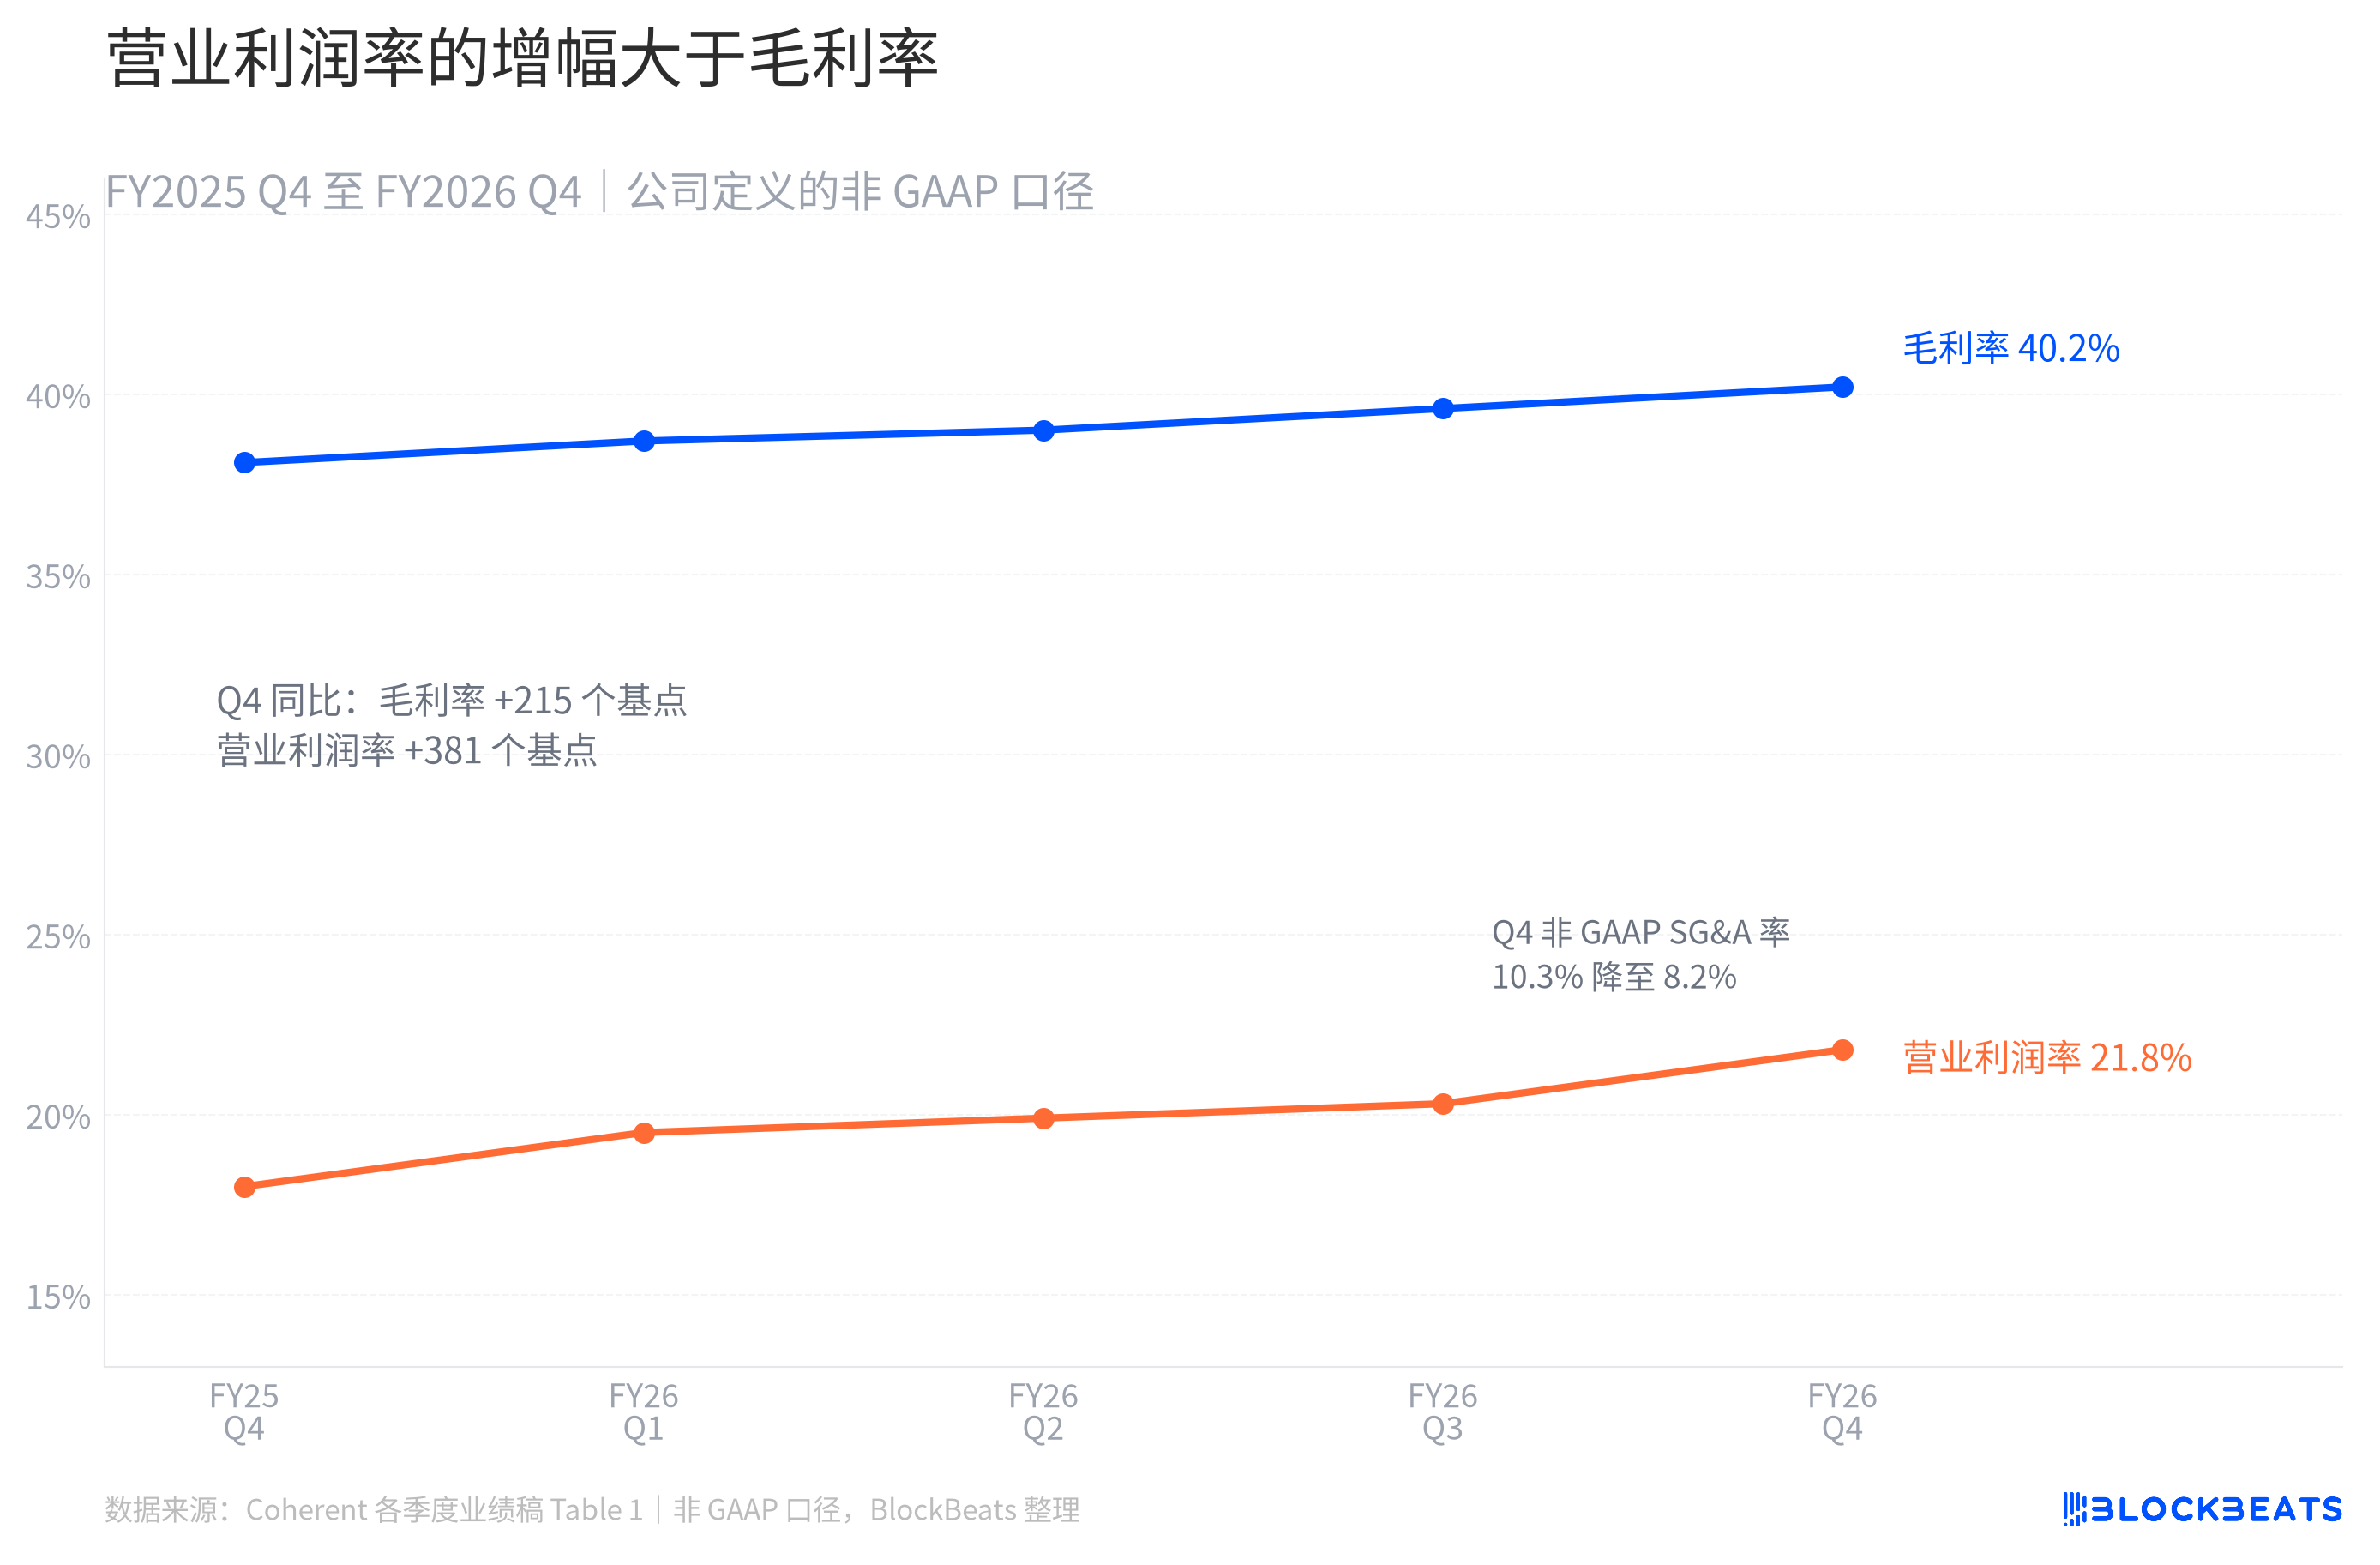
An increase in revenue does not automatically mean improved profitability. According to the company's performance announcement, Coherent's non-GAAP gross margin increased from 38.1% in FY2025 Q4 to 40.2% in FY2026 Q4. For every dollar of revenue after deducting direct costs, there was more margin left.
During the same period, the non-GAAP operating profit margin rose from 18.0% to 21.8%. As per the company's performance announcement, the Q4 operating margin increase year-over-year exceeded the gross margin, with specific details shown in the accompanying chart.
Concurrently, the non-GAAP Selling, General, and Administrative Expense (SG&A) ratio decreased, while the Research and Development (R&D) expense ratio saw a slight uptick. The company's performance announcement stated that these expense ratio changes, along with the gross margin movement, occurred simultaneously during the margin improvement period but were not sufficient to individually prove that a specific cost action resulted in all the improvement.
One should also consider the chart's scope. Non-GAAP metrics exclude equity incentives, amortization of acquisition-related intangible assets, restructuring, and other items. According to the company's disclosure, it is a supplementary measure used by management to assess ongoing operational performance and cannot substitute for GAAP reporting.
Translating these changes into plain language, Coherent not only sold more products during the same period. The shifts in revenue, gross margin, and some expense ratios jointly contributed to the operating profit margin increase, but the public report did not attribute this change to a single business line or cost item.
Pursuing Growth: How Far Does the Cash Stretch?
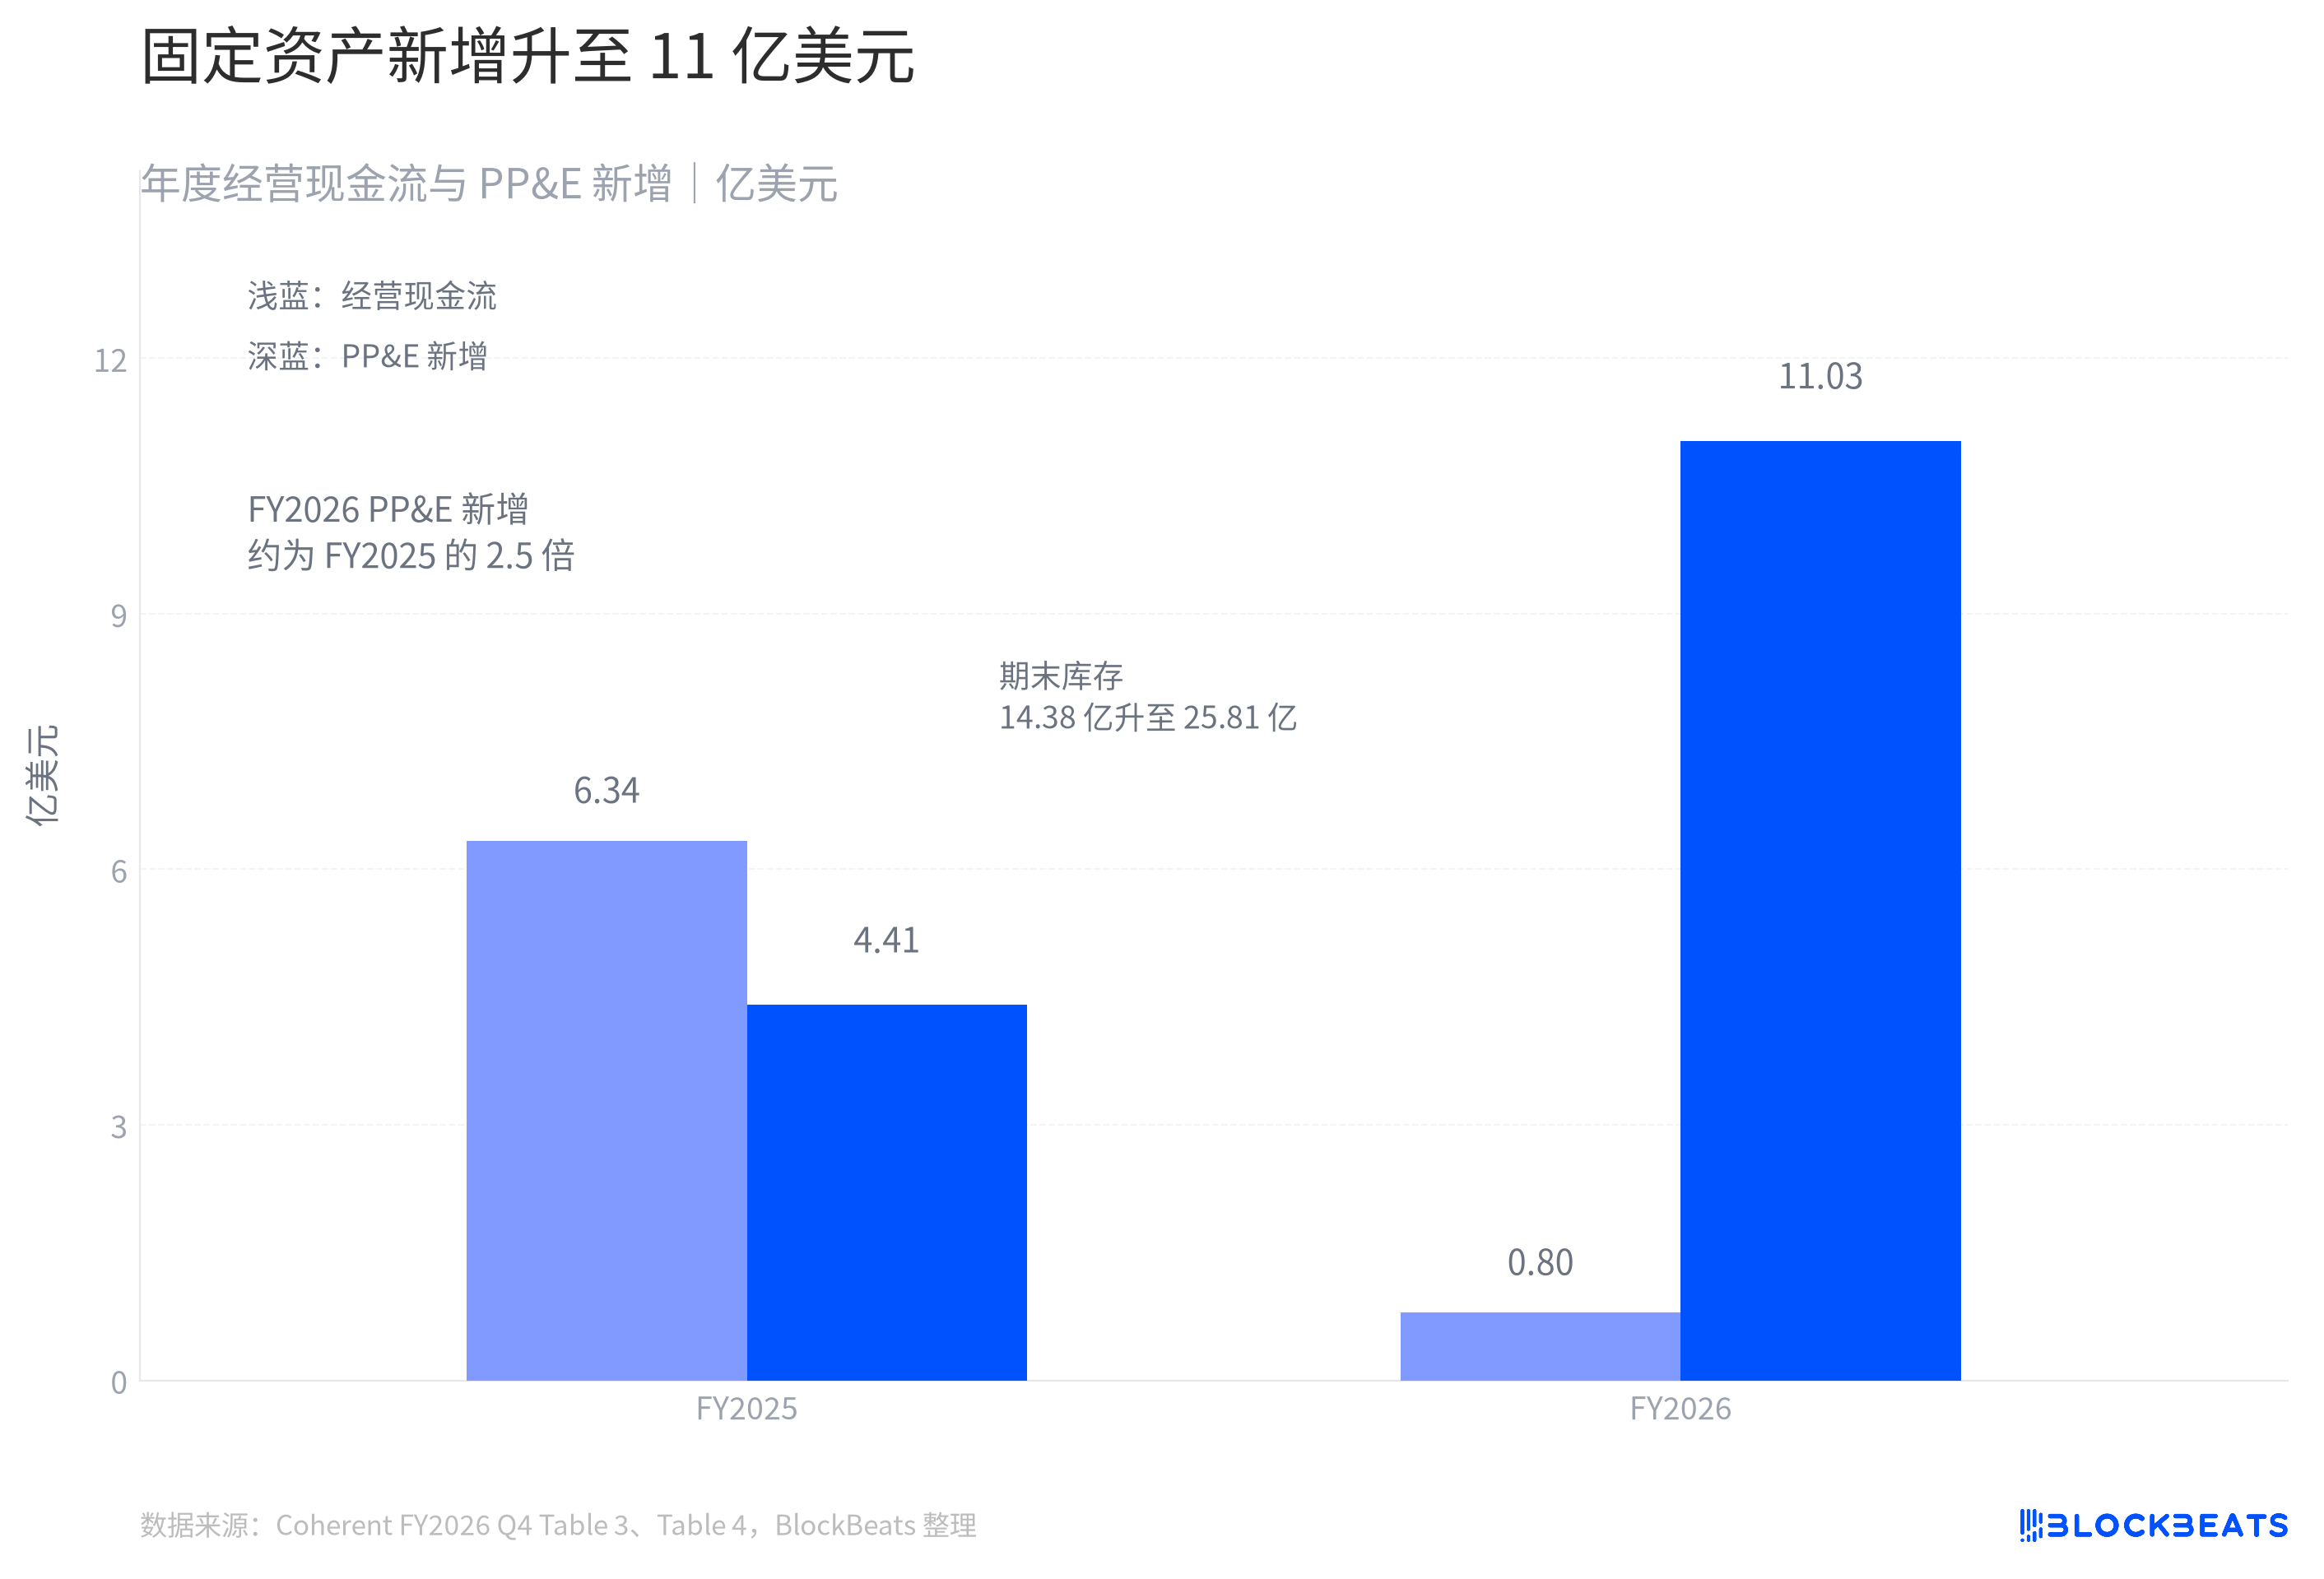
The final chart shifts the focus from the income statement to the cash flow statement. According to the company's FY2026 cash flow statement, additions to Property, Plant, and Equipment (PP&E) totaled $11.03 billion, about 2.5 times the previous fiscal year. Management stated that capital allocation is primarily used to expand manufacturing capacity, but this investment cannot be directly linked to the expansion spending of a specific product line or customer.
In the same fiscal year, operating cash flow decreased from $634 million to $80 million. According to the company's balance sheet, year-end inventory also increased from $1.438 billion to $2.581 billion.
These three changes occurred in the same fiscal year, and the public disclosure did not provide a single causal breakdown between them.
According to the company's statement of cash flows, the FY2026 financing activities net cash flow was $1.477 billion, which includes various cash flows such as equity issuance, borrowing, and debt repayment. This is a fund allocation table different from the income statement and cannot be solely explained by quarterly revenue growth.
The focus of this financial report is not to directly equate "Data Center and Communications" to AI revenue. Changes in revenue emphasis, profit margins, and additions to fixed assets in the cash flow statement, as well as inventory variations, all occurred simultaneously in the FY2026 report.
Welcome to join the official BlockBeats community:
Telegram Subscription Group: https://t.me/theblockbeats
Telegram Discussion Group: https://t.me/BlockBeats_App
Official Twitter Account: https://twitter.com/BlockBeatsAsia