
Goldman Sachs Provides Ten Signals to Determine Where China's AI Emotion Stands

TL;DR
· Goldman Sachs outlined ten signals to assess the progress of the Chinese AI hard tech correction from various dimensions such as price, valuation, leverage, investor positioning, policy, and fundamentals.
· Style reversal, retail investor cooling, increased buybacks, and the "national team" switching to net buying indicate that some overheated sentiment has been released.
· However, A-share technology trading volume, financing, and institution positioning remain highly concentrated, the upward momentum of hard tech profit forecasts is also starting to slow, and a correction does not directly equate to a bottom.
After experiencing a rapid rise in the first half of the year, Chinese AI hard tech is now undergoing a round of emotional reassessment.
According to Goldman Sachs' China strategy report released on August 9, in its defined Chinese AI stock universe, AI hard tech stocks saw an average increase of 33% in the first half of the year. As global AI hardware transactions reversed, the Sci-Tech Innovation 50, ChiNext Index, and CSI 1000 have retraced over 20% from recent highs.
The question is, is this pullback merely profit-taking in the short term, or does it signify a deeper change in AI trading?
Goldman Sachs did not merely look at the index decline but evaluated the sentiment and pullback cycle of Chinese AI hard tech from ten dimensions including return differentiation, market concentration, valuation, leverage, retail investor sentiment, institution positioning, listed company behavior, policy, "national team" funds, and profit forecasts.
The ten signals collectively point to a less extreme answer: a considerable portion of the previously accumulated speculative positions, overvaluation, and leverage have been unwound, but the concentration risk of some positions still exists, and the momentum of fundamental improvement is slowing down. The most crowded phase of the market may have passed, but the completion of the adjustment is not yet confirmed.
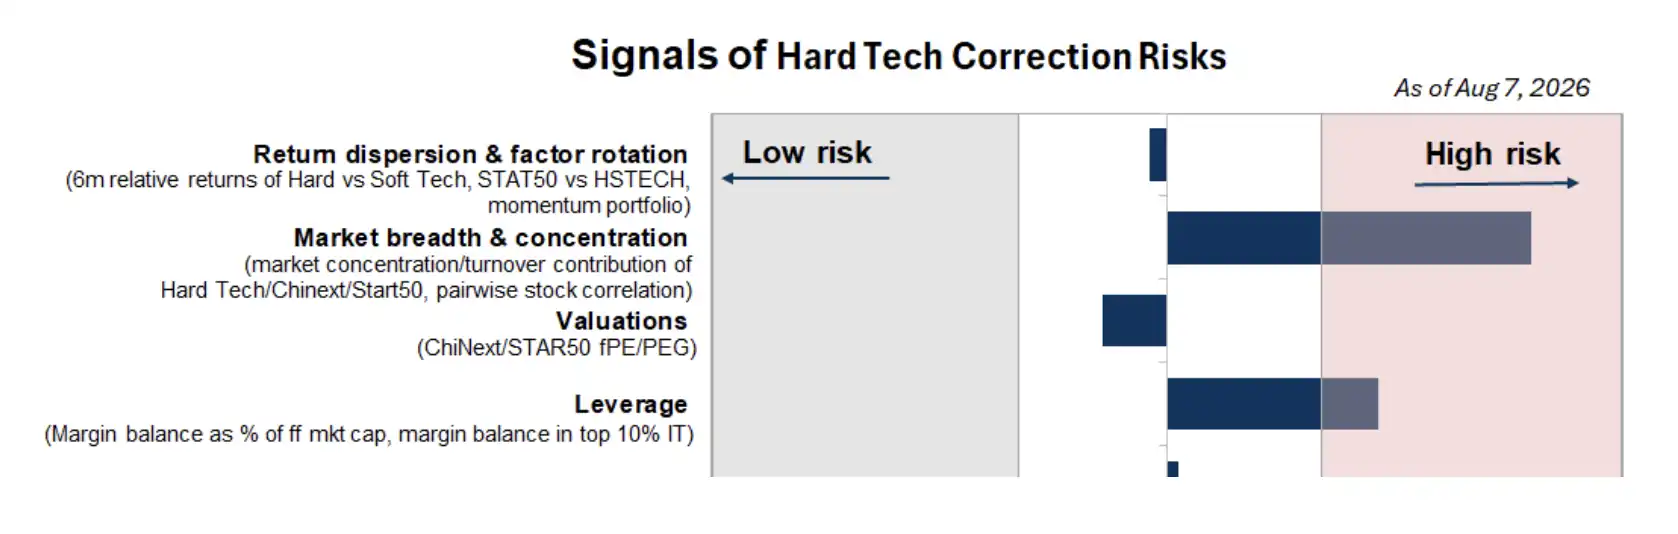
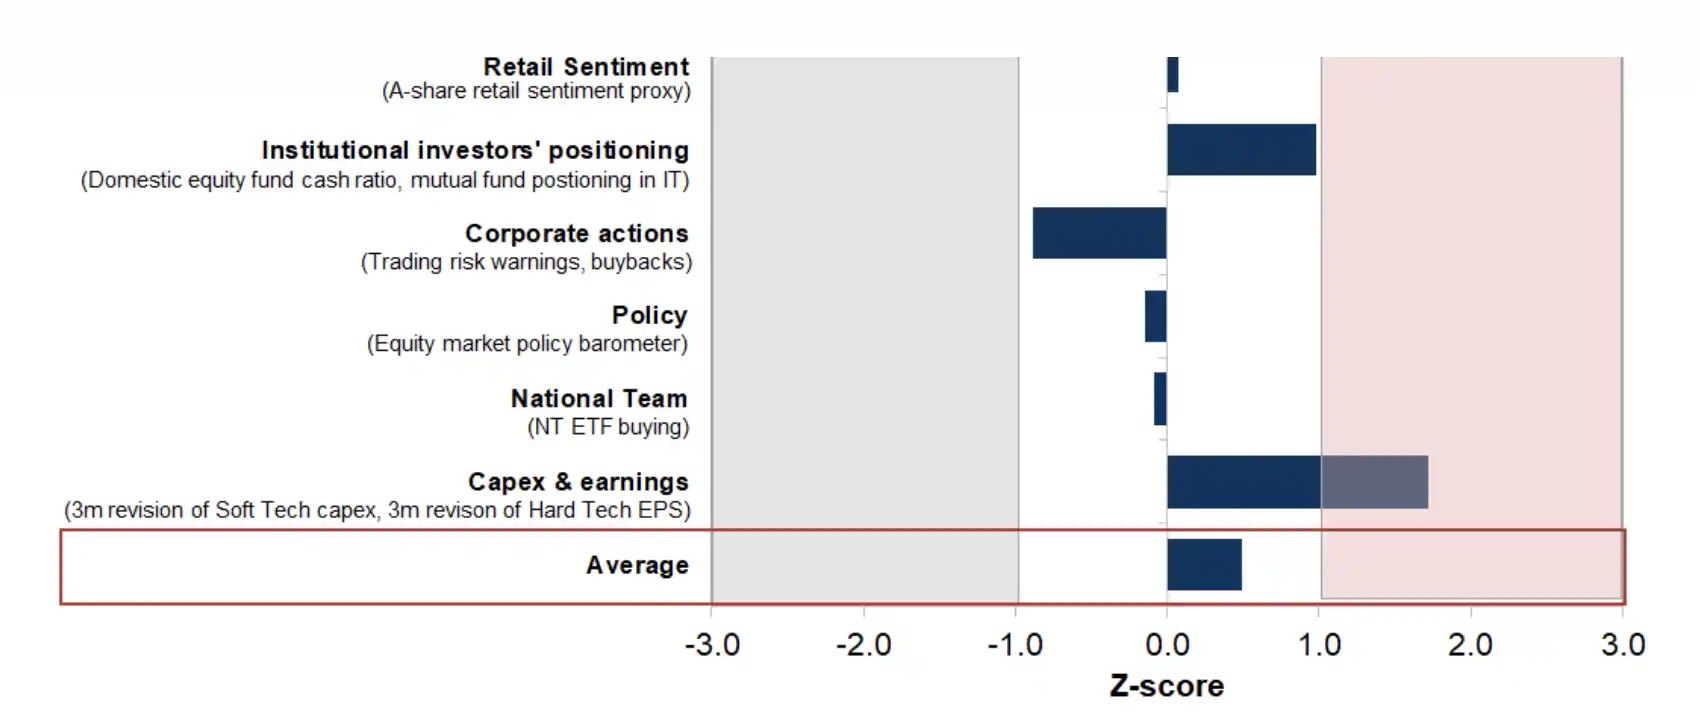
Goldman Sachs' summary of the ten indicators indicates that the market breadth and concentration risk of Chinese AI hard tech are most prominent, leverage, institution positioning, and profit revisions remain in high ranges; valuation, retail sentiment, corporate behavior, and policy signals have significantly cooled off. Data as of August 7, 2026.
Price Signal: Prices are starting to cool down, but concentration remains high
Signal 1: Rapid Narrowing of the Performance Gap between Software and Hard Tech
In the first half of the year, the most significant feature of Chinese AI trading was not the universal rise of all AI assets but the high concentration of funds in hard tech.
Goldman Sachs' data shows that in the first six months of this year, the performance gap between the Sci-Tech Innovation 50 and the Hang Seng Tech Index exceeded 100 percentage points at one point, similar to the peak during the market dispersion surge in early 2021. Small-cap, high-growth, and momentum styles also became the primary drivers of the market at that time.
After entering July, these trends quickly reversed. With the global AI hardware transaction cooling down, the excess returns of hard technology, small-cap, and momentum factors saw a significant retracement, and the performance gap between soft technology and hard technology has returned to around the long-term average level.
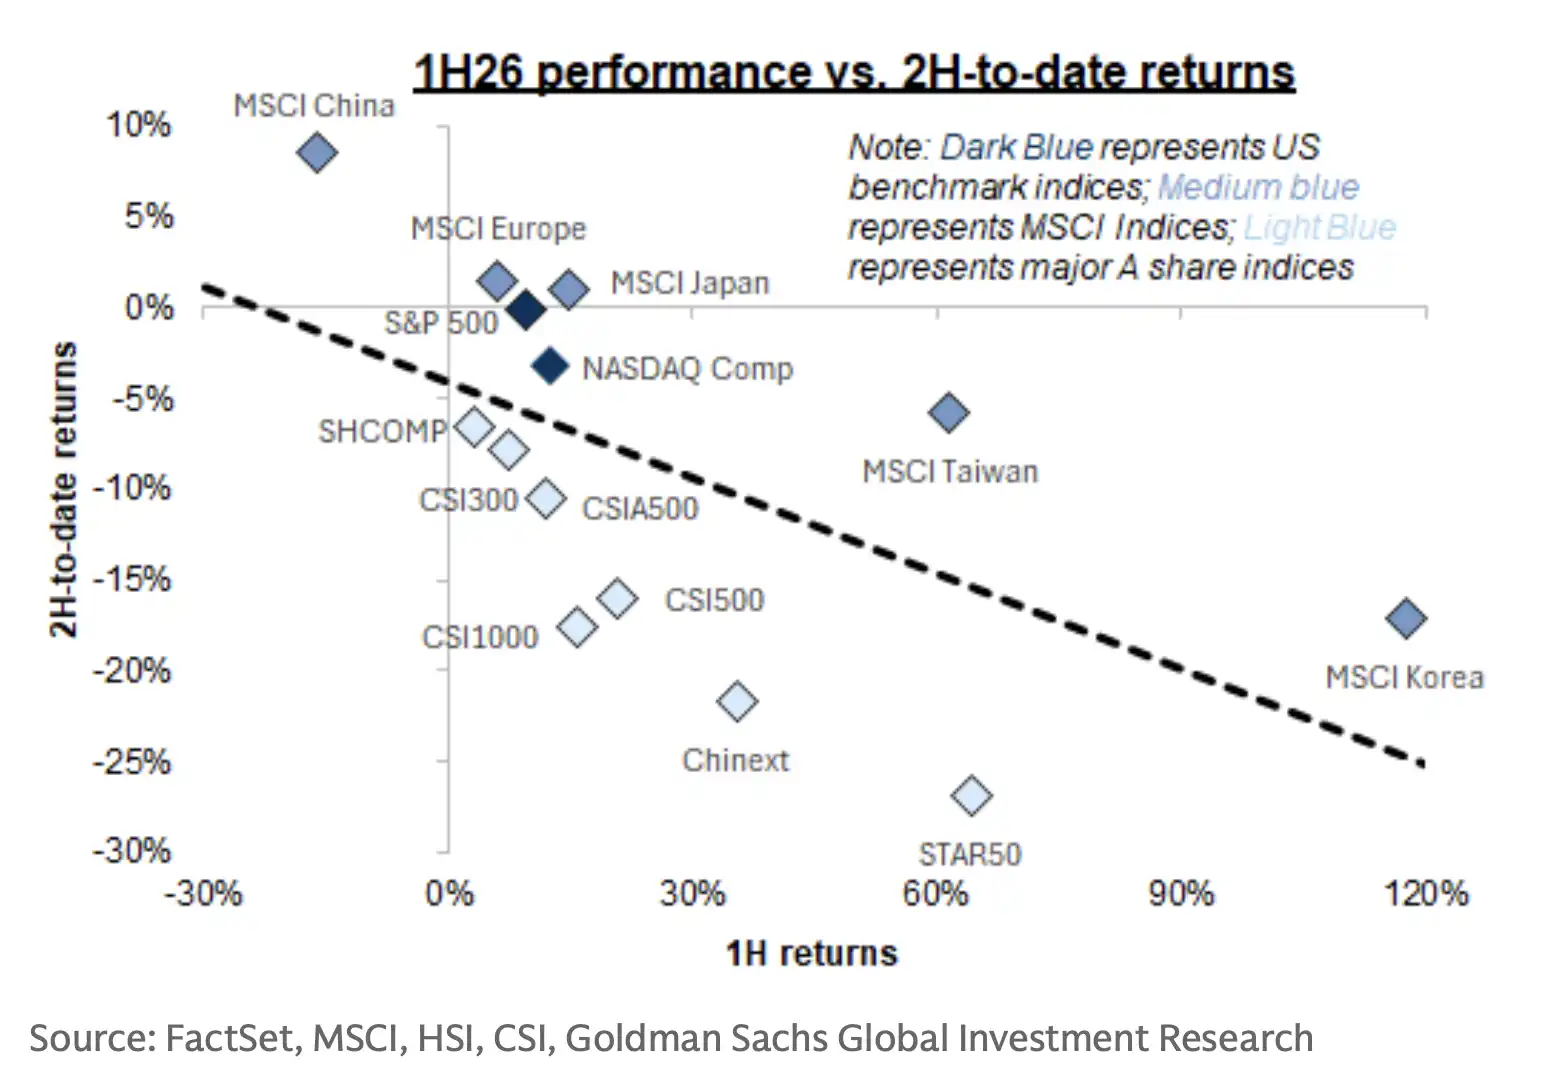
Previous leaders have retraced most of their gains from the first half of the year since July.
The adjustments in momentum and size factors have even entered a more extreme range. Goldman Sachs believes that based on price momentum, the fastest stage of pullback and style reversal may be starting to moderate.
This signal tends to be positive: the direction with the largest early gains and the most crowded positions has already experienced a significant cooldown. However, a slowdown in price decline does not mean that the related stocks have completed liquidation.
Signal Two: The gains of the ChiNext 50 Index are still driven by a few stocks
The second signal comes from market breadth.
Goldman Sachs estimates that 90% of the ChiNext 50 Index's gains this year have been contributed by the top 10 best-performing stocks. By comparison, this proportion was 23% at the beginning of 2021 and 46% in mid-2015 for the ChiNext Index.
Trading volume is also concentrating in a few directions. The technology sector, the ChiNext Index, and the ChiNext 50 Index currently account for 26%, 14%, and 6% of A-share cash turnover, respectively, all at relatively high levels in recent years.
At the same time, the correlation between individual stock returns of A-shares remains at near multi-year lows. Low correlation means that the market is not mainly trading in a broad-based manner based on macro factors but continues to chase a few micro themes such as AI and technology.
This indicates that although the prices of hard technology stocks have retraced, AI remains the most important pricing clue in the market, and returns and trading have not truly diffused. While sentiment has cooled down, the trading structure remains concentrated.
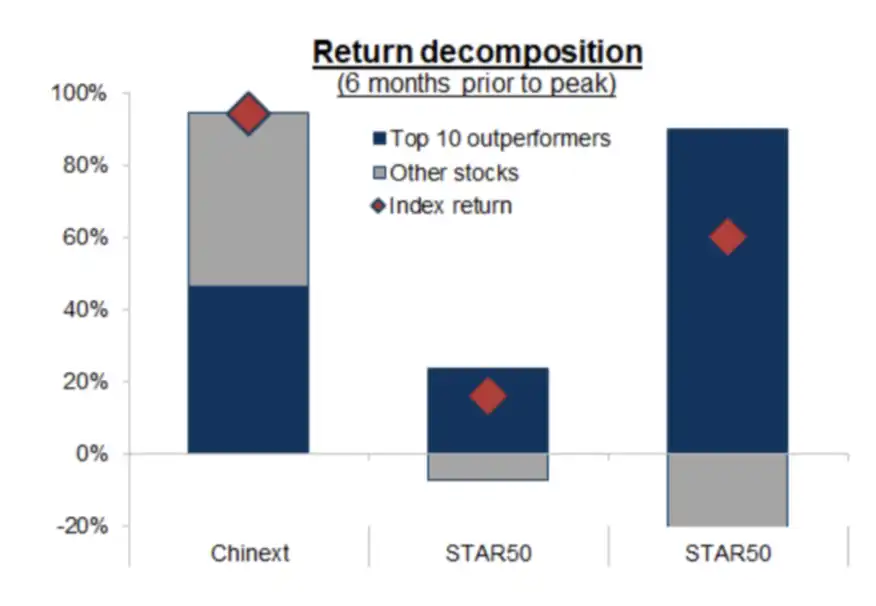
Around 90% of the ChiNext 50 Index's gains this year have been contributed by the top 10 best-performing stocks, significantly higher than the 23% at the beginning of 2021 and 46% for the ChiNext Index in mid-2015. The dominance of a few stocks in the index's rise indicates that the market breadth of AI hard technology transactions is still insufficient.
Signal Three: Valuations have returned to the mean, but absolute prices remain elevated
Valuation is the third signal to judge whether sentiment has been fully released.
At the June peak, the ChiNext Index's forward P/E ratio, calculated by market capitalization, was around 26 times, while the median forward P/E ratio of the ChiNext 50 index stocks was around 50 times. Following the subsequent stock price decline, the valuation multiples of A-share high-tech companies have fallen to near or below long-term average levels.
When considering earnings growth, the forward PEG ratios of the relevant companies are also at historical median or lower levels. This implies that, merely looking at valuation relative to historical levels, some of the overheating has been digested.
However, the absolute valuation of the ChiNext 50 index still remains high. After a global AI sector adjustment, the valuation discount of Chinese AI concept stocks compared to their overseas peers has significantly narrowed, and the previous safety cushion of "China's AI assets being cheaper despite being in the same AI field" has thinned out.
Therefore, the valuation signal does not indicate "already cheap," but rather "the most expensive time may have passed." The market going forward will rely more on earnings realization rather than continuing to rely solely on valuation expansion.
Capital Signal: Retail Investors Have Cooled Off, While Institutions and Leverage Have Not Fully Retreated
Signal Four: Financing Balance Declines, but Leverage Concentration Hits a New High
The financing balance is the most direct indicator to observe A-share leveraged trading.
According to Goldman Sachs data, A-share financing balance has decreased from around 30 trillion yuan to around 26 trillion yuan, and the proportion of this balance to free float market cap has also dropped from 6.0% to 5.5%. This indicates that some leveraged funds have exited.
However, whether it is the financing balance or the financing ratio, they are still higher than historical norms. Goldman Sachs believes that if deleveraging continues, compared to the more obvious deleveraging in the South Korean and Chinese Taiwan markets recently, the deleveraging cycle in the A-share market may still be in an earlier stage.
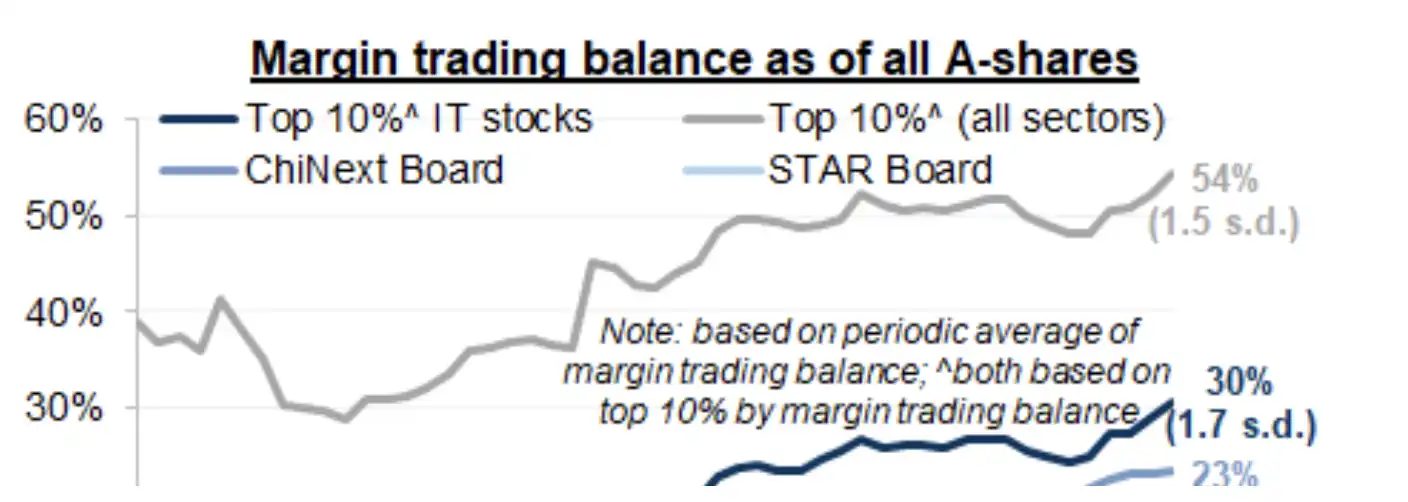
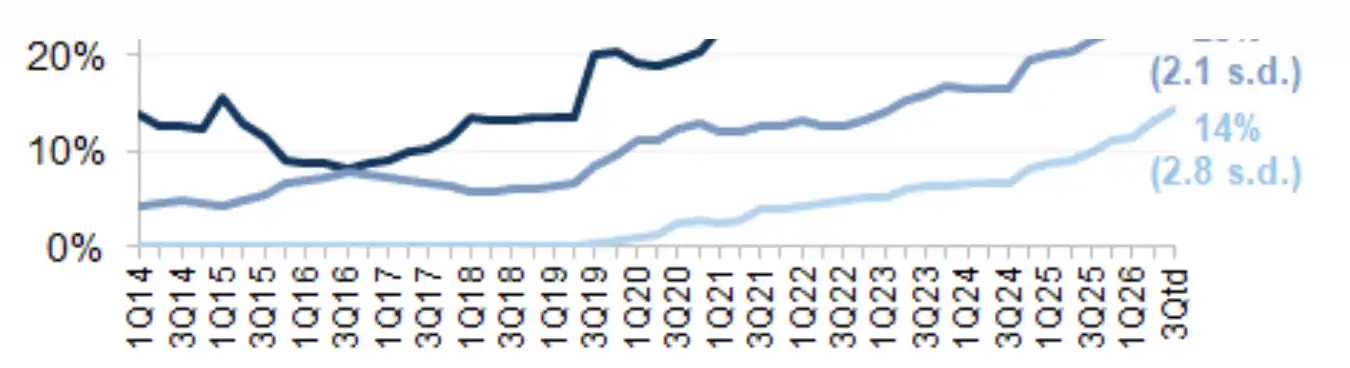
Although the A-share financing balance has fallen from its peak, leverage is still concentrated in the technology sector. According to Goldman Sachs, the top 10% of stocks with the most financing balance account for approximately 30% of the total market financing balance, reaching a historical high. When hard tech continues to decline, local fluctuations may still be amplified.
Also of note is the distribution of leverage. As per Goldman Sachs' calculations, the top 10% of stocks with the most financing balance currently account for about 30% of the total A-share financing balance, hitting a historical high, mainly concentrated in the AI hard tech sector.
This indicates that the overall market's leverage risk may be significantly lower than in 2015, but there is still structural pressure within AI hard tech. If the related stocks continue to decline, the concentrated financing positions may still amplify volatility.
Signal Five: Retail Investor Risk Appetite Cools from Overheated to Neutral
Goldman Sachs's fifth signal comes from retail investor sentiment.
Despite the increasing share of domestic mutual funds, pension funds, and insurance funds, retail investors still account for approximately 70% of the A-share daily trading volume. Therefore, changes in retail investor sentiment will still directly affect short-term market fluctuations.
Goldman Sachs's retail investor sentiment gauge covers high-frequency indicators such as margin financing data, new account openings, IPO subscriptions, turnover rate, and stock allocations. This indicator has now dropped from being about 1 standard deviation above the one-year average a month ago to around 0 standard deviations.
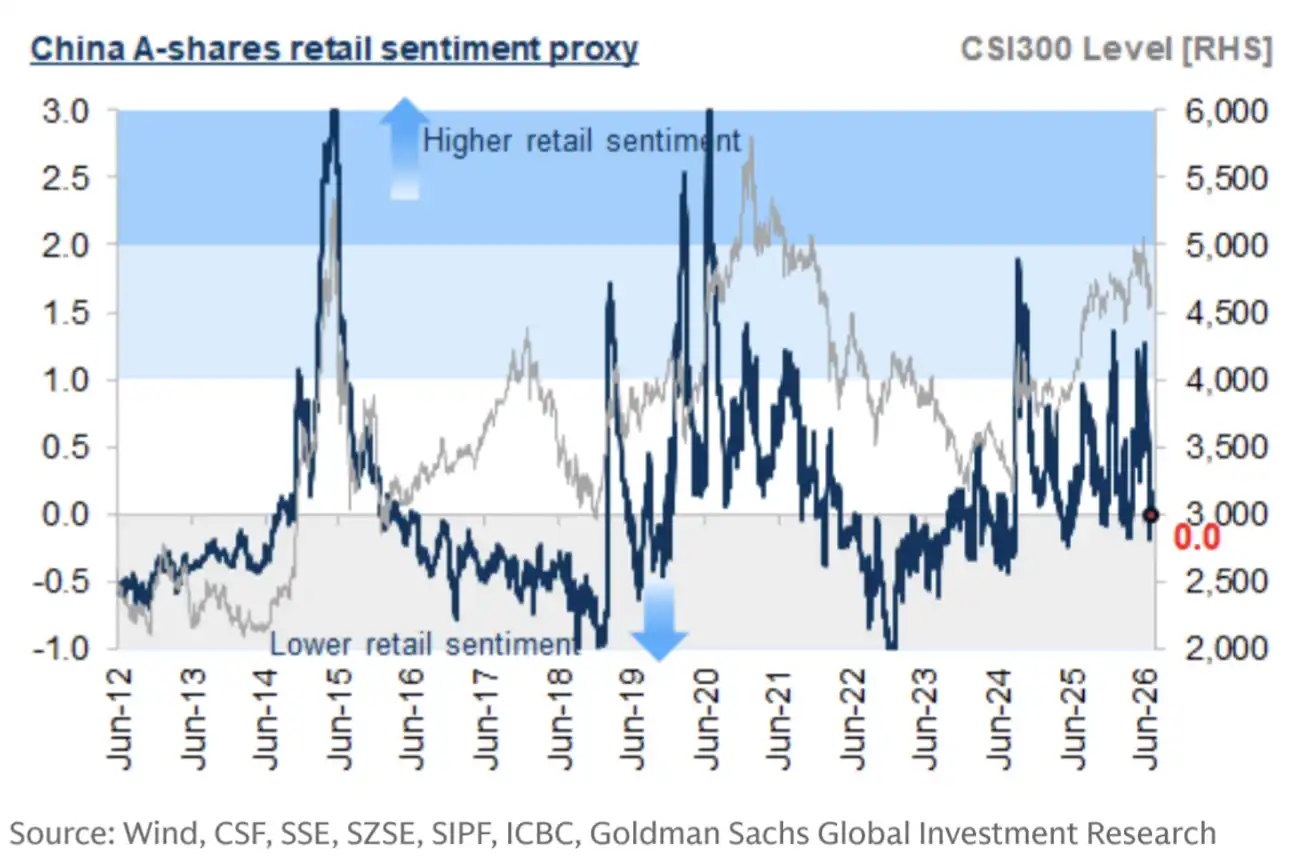
Goldman Sachs's A-share retail investor sentiment indicator has dropped from about 1 standard deviation above the average a month ago to around 0 standard deviations, indicating that the chasing momentum has quickly faded. However, the current risk appetite has only returned to neutral to slightly subdued levels and has not entered the extremely pessimistic zone.
This means that A-share retail investor risk appetite has fallen from an overheated state to neutral or even slightly subdued.
The rapid cooling of retail investor sentiment is evidence that some speculative pressure has been released in this round of correction. However, 0 standard deviations do not indicate extreme pessimism, nor is it a traditional "panic bottom." It only indicates that the chasing heat has dissipated and does not yet prove that the market has completed its final round of selling.
Signal Six: Mutual Funds Slightly Reduce Positions, Tech Allocations Remain at Historical Highs
Institutional investors' behavior is more complex than retail investors.
Goldman Sachs data shows that the scale of domestic mutual fund management has reached nearly 40 trillion yuan, of which about 7 trillion yuan is allocated to stocks, accounting for 6.6% of the total A-share market value and 15% of the free float market value.
During the market adjustment period, the cash proportion of equity mutual funds has slightly increased, indicating that fund managers have moderately reduced risks. However, their allocation to tech stocks such as semiconductors, hardware, and software, and the degree of over-allocation, remain at historical highs.
The risk reduction of systematic strategies may be more pronounced. The cash turnover of small and medium-cap stocks and the financing spread have decreased, indicating that the activity of systematic investors such as quantitative funds has weakened, possibly experiencing a deeper deleveraging.
There is a clear differentiation within this signal: quant and short-term funds have contracted, but the core positions of traditional institutions in tech stocks have not significantly eased. As long as institutional allocations remain high, AI hard tech is unlikely to be defined as a completely de-crowded trade.
Behavior and Policy Signals: Companies Begin Buybacks, National Team Funds Start to Support
Signal Seven: Increase in Buybacks, Decrease in Unusual Trading Alerts
The behavior of listed companies often reflects insiders' assessment of valuation and risk better than market slogans.
Goldman Sachs observes corporate behavior from three angles: buybacks, unusual trading alerts, and significant shareholder transactions. Calculated on a quarterly basis, A-share buybacks in the third quarter of 2026 have risen to a multi-year high, with the announced number and amount of buyback transactions increasing by 35% and 59% year-on-year, respectively.
An increase in buybacks usually means that management believes the company's stock price is below intrinsic value, or at least is willing to invest cash at the current price to support shareholder returns.
Another change is that the number of stock price volatility warnings and trading risk alerts issued by listed companies increased significantly in June, before the market correction, but has since dropped substantially. Significant shareholder and company executive transactions have also shifted from net selling for most of the first half of the year to a more balanced state.
This set of signals overall tends to be positive: insiders of companies are no longer inclined to sell and signal overheating in the late stages of a rally, but are gradually turning to buybacks and reducing net sales.
Signal Eight: Policy Tightening Risk Returns from Peak to Neutral
The emotional cycle of the Chinese stock market is often influenced by policy changes.
The deleveraging in 2015 and the regulatory tightening that began at the end of 2020 have been important reasons for market reversals; conversely, clear policy support has repeatedly driven strong rebounds in Chinese stocks.
Goldman Sachs uses a large language model to analyze public statements from regulatory agencies and policymakers. It measures the policy support and tightening risks the stock market faces based on the frequency and intensity of the wording used.
The model shows that policymakers' concerns about market overheating and the resulting risks of policy tightening peaked in the first quarter of 2026 and have since fallen back to a more neutral range.
This means that policies are currently neither a clear emotional booster nor a major source of pressure for this round of adjustment. Compared to price, leverage, and earnings factors, policy signals are currently closer to neutral.
Signal Nine: National Team Shifts from Selling to Net Buying
The ninth signal comes from the National Team.
Goldman Sachs estimates that the broad "National Team" currently holds around 5 trillion yuan of A-share assets, equivalent to 5% of the total A-share market value. Historically, such funds usually buy against the market pressure and may sell against the trend when the market rises and valuations become less attractive.
Goldman Sachs' tracking data shows that after the "National Team" sold about 1.5 trillion yuan of A-shares in the previous 6 months, they have turned into net buyers in the past 3 weeks, purchasing over 140 billion yuan, including a small amount in the SSE 50 ETF.
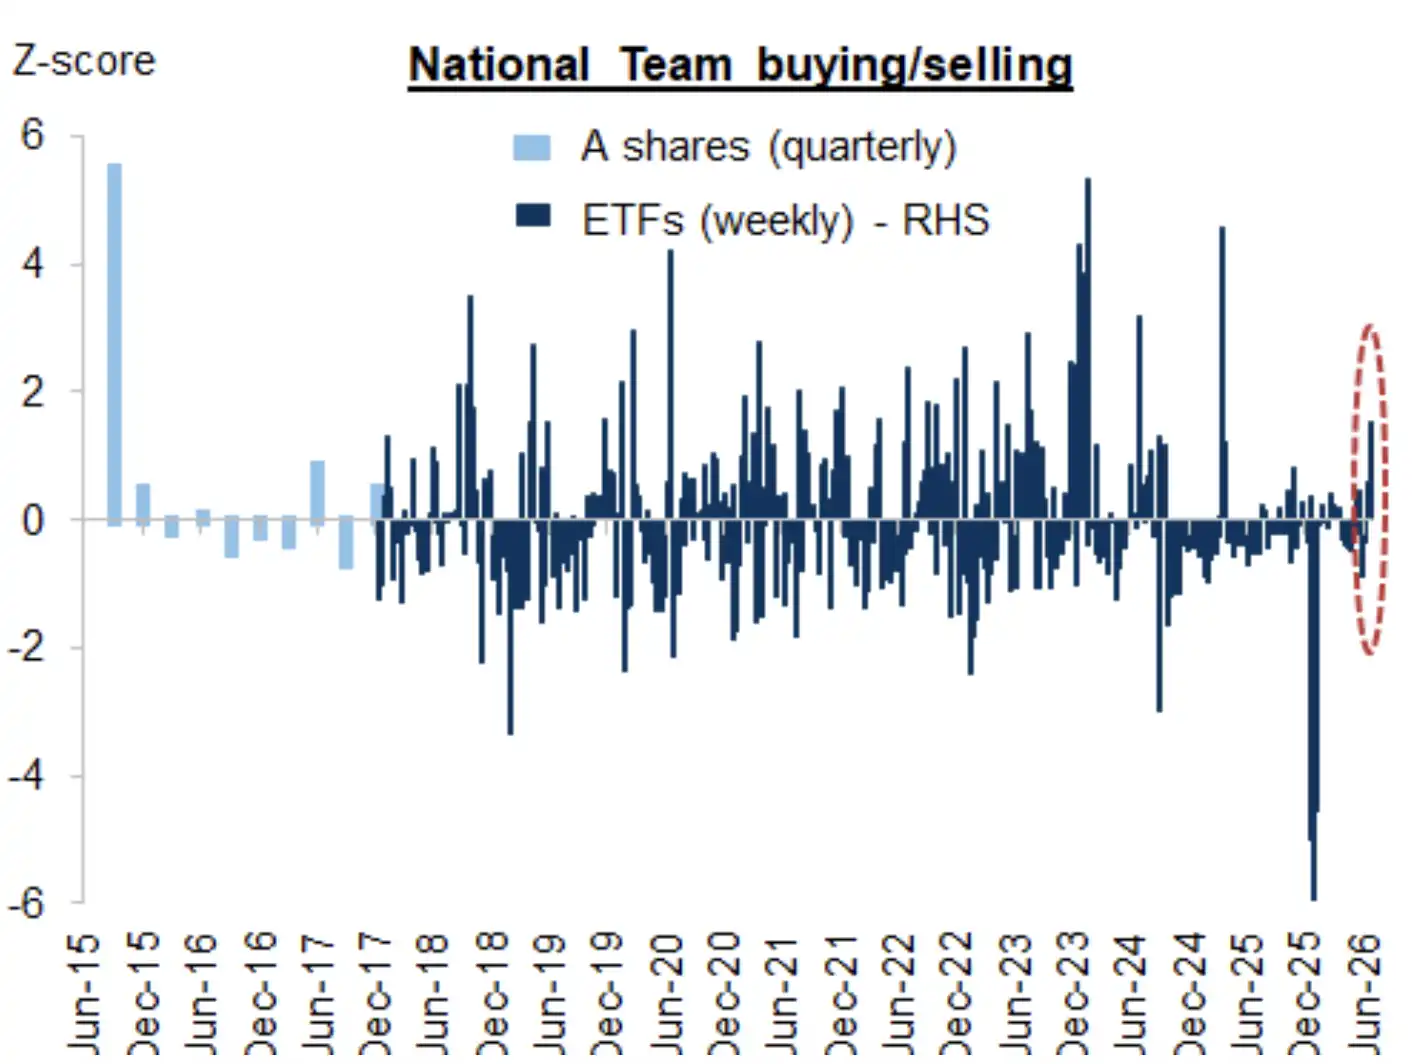
Goldman Sachs estimates that after the "National Team" sold about 1.5 trillion yuan of A-shares in the previous 6 months, they have turned into net buyers in the past 3 weeks, purchasing over 140 billion yuan, indicating a resurgence of market support. However, the report has not confirmed that the scale of this round of purchases has reached the historical threshold typically associated with a midterm bottom.
The shift of the "National Team" from selling to buying indicates a change in the policy fund's market risk assessment, providing some downside support for the broader market.
However, this still does not directly confirm a midterm bottom. Goldman Sachs' historical backtesting shows that only when the "National Team" weekly net buying scale exceeds 1.5 standard deviations, it is more likely to correspond to a midterm bottom of the market. The more definitive conclusion at present is that the support has reappeared, rather than the market has unconditionally found a bottom.
Fundamental Signal: Strong AI Investment Continues, Earnings Upside Momentum Starting to Peak
Signal Ten: Capital Expenditure Continues to Grow, but Marginal Change is No Longer Accelerating
The last and most critical signal determining how far the AI trend can go comes from capital expenditure and earnings forecasts.
Goldman Sachs expects that the AI spending of 9 major ultra-large-scale companies and cloud service providers in the U.S. and China may exceed $900 billion this year, further increasing to $1.3 trillion next year, equivalent to 1.7% and 2.3% of the total GDP of the U.S. and China, respectively.
These expenditures are transmitted along the global AI industry chain, covering Korean memory chips, Taiwanese semiconductor foundries, Japanese semiconductor materials and equipment, as well as Chinese power, infrastructure, and technology companies.
Since the beginning of this year, the 2026 and 2027 capital expenditure forecasts of 8 listed ultra-large-scale companies in the U.S. and China have been raised by 32% and 75%, driving the 2026 and 2027 earnings forecasts of the Chinese hard technology sector to increase by 12% and 22%, respectively.
This indicates that the rise in Chinese AI hard technology is not solely driven by sentiment and leverage but is indeed supported by capital expenditure and earnings growth.
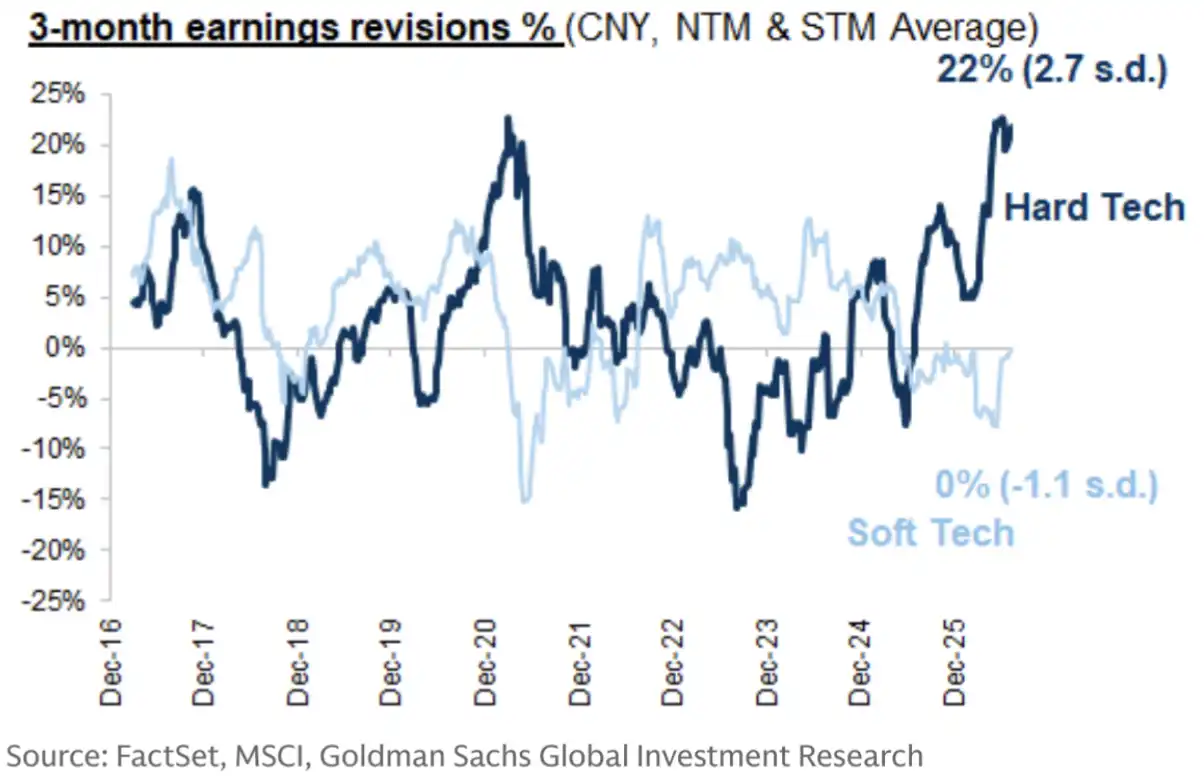
The upward revision of earnings forecasts for Chinese hard technology is still significantly higher than that of soft technology, indicating that the AI trend is not entirely sentiment-driven. However, Goldman Sachs believes that the earnings upside momentum in hard technology may have peaked in the short term, while the earnings revision for soft technology still has room for cyclical improvement.
The issue lies in the fact that the upward revision pace of capital expenditure forecasts has slowed from its peak, and the momentum of profit forecasts for Chinese hard-tech companies is showing signs of at least short-term topping out. In contrast, there is still room for periodic improvement in profit revision momentum for soft-tech.
Therefore, the key factors affecting AI sentiment in the coming months will no longer just be how large capital expenditures are, but whether capital expenditures can continue to exceed expectations, and whether cloud providers can provide a clearer path to monetizing AI.
Ten Signals Pointing Together: From Overheating to Cooling, Adjustment Not Fully Completed
Putting the ten signals together paints a clearer picture of where Chinese AI hard-tech currently stands.
Some positive signals include: the extreme earnings gap between hard-tech and soft-tech has narrowed, momentum and small-cap style have completed a rapid reversal, valuations have returned to near long-term averages, retail investor sentiment has fallen to neutral, public company buybacks have increased, major shareholder reductions have tended to balance out, and the "national team" has once again become net buyers.
These changes indicate that a significant portion of speculative positions, overheated valuations, and leverage pressure accumulated in the first half of the year has been released.
However, some cautious signals also exist: the absolute valuation of the ChiNext 50 remains high, A-share technology trading volume and earnings concentration are at high levels, margin balances remain above historical norms, leverage concentration has hit new highs, and mutual fund allocation to tech stocks is still at historically high levels.
The fundamentals lie somewhere in between. Global AI capital expenditures remain strong, hard-tech profit forecasts are also being revised upward, but the momentum of both capital expenditure and profit forecast revisions has begun to slow.
Therefore, Goldman Sachs continues to maintain an "overweight" stance on A-shares and remains structurally bullish on AI hard-tech in the long term, but emphasizes rotation and diversified allocation in the short term. Its recommendations include gradually increasing allocation to selected Hong Kong-listed soft-tech stocks, policy beneficiaries, and self-reliant and controllable directions, while focusing on profit upgrade stocks, IPOs, and cash returns from dividends and buybacks.
For investors, these ten signals do not simply indicate a straightforward "AI bottoming out" or "AI market ending," but rather serve as a sentiment thermometer: the hottest times may be behind us, the sharpest declines may be easing, but portfolio concentration and profit expectations still need to be digested.
In the next stage, whether Chinese AI trading can heat up again will depend more on corporate earnings and AI monetization, rather than relying once again on valuation, leverage, and chasing momentum.
Welcome to join the official BlockBeats community:
Telegram Subscription Group: https://t.me/theblockbeats
Telegram Discussion Group: https://t.me/BlockBeats_App
Official Twitter Account: https://twitter.com/BlockBeatsAsia
 Related Articles