AI is Rising, but Caution is Warranted? A 65-Year Indicator is Flashing a Warning
Original Title: Risk Aversion Gone Missing
Original Author: Jim Paulsen
Original Translation: DeepTech TechFlow
Abstract: The proportion of defensive stocks in the S&P 500 has dropped to 17%, approaching a historical low—what does this mean? Seasoned strategist Jim Paulsen, using over 60 years of data, will tell you: whenever investors throw "risk aversion" out the window, the market is often not far from trouble. If your portfolio is full of AI and tech stocks, this article is worth a serious read.
Sometimes in the stock market, investors will gather around a common theme or collectively avoid a significant part. This "herd" behavior often provides important information that should not be ignored, but it also does not necessarily need to be followed. Now may be one of those times.
Throughout most of this bull market, investment "herds" have been pouring into new-era stocks and have achieved tremendous success. This bull market has been consistently boosted by several star sectors, including the Mag7, quantum computing, mega-scale computing power, artificial intelligence, microcaps, IPOs, and cryptocurrency. Amid all this excitement, investors are increasingly letting the level of "risk aversion" in their portfolios fade, which is perhaps understandable.
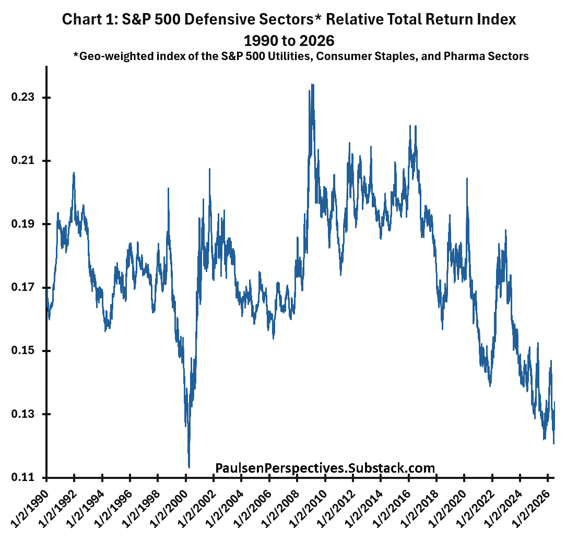
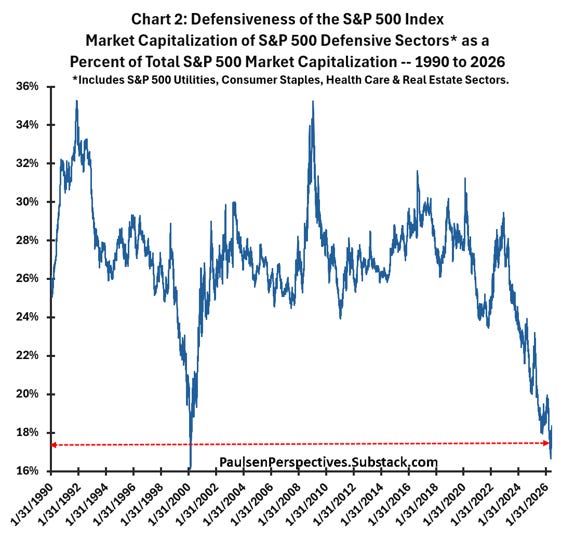
Chart 1 shows that "defensive stocks" have performed poorly throughout the current bull market and have consistently underperformed the market for most of the past decade. Chart 2 indicates that risk aversion within the S&P 500 index is slowly dissipating. The market capitalization of defensive stocks in the S&P 500 index has now dropped to about 17% of the total market value. This is close to a historical low, almost half of the peaks during the early 1990s and the 2009 stock market bottom—when defensive stocks accounted for nearly 36% of the overall market. No one knows how long the "current" tech boom will last, or how high the stock market will rise under the leadership of new-era stocks. No one knows!
Nevertheless, it is becoming increasingly clear that the S&P 500 index—and perhaps most portfolios—are becoming riskier. With "defense" now accounting for such a small share of market capitalization, it is expected that market volatility will intensify during the remaining time of this bull market. Operating solely on high octane without a defensive buffer may still succeed, but it could be much more nerve-wracking. Furthermore, as risk aversion continues to wane, the likelihood of disappointing outcomes is also increasing.
Stock Market Risk Aversion
One good indicator of stock market risk aversion may be the relative performance of low beta stocks compared to high beta stocks. Figure 3 shows the total return performance of the lowest quintile price beta stocks relative to the highest quintile price beta stocks since 1963. The data is sourced from the Kenneth R. French database, which includes all U.S. stocks listed on the NYSE, Nasdaq, and AMEX.
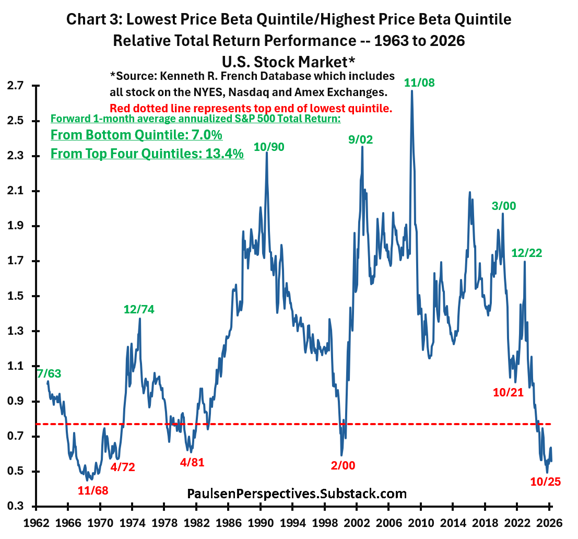
Over the past nearly 65 years, there has been a significant performance gap between the most defensive stocks and the most aggressive stocks. The relative total return index between low beta and high beta stocks has ranged from around 0.4 to 2.7. Periods of extreme defensiveness are indicated by the highest relative values, while extreme bullishness (or lack of defensiveness) is suggested by the lowest relative readings.
The dates shown on the chart clearly indicate that defensiveness is closely related to the future risk of the overall stock market. The major peaks in the relative performance of low beta versus high beta stocks (highlighted in green on the chart) — typically characterized by extreme pessimism and caution driving the outperformance of the most defensive stocks — often represent very good buying opportunities. For example, buying the market in July 1963 was after the Cuban Missile Crisis sell-off, and from July 1963 to the peak in 1968, the S&P 500 rose nearly 60%! December 1974 marked a nice 50% market low, October 1990 represented the "start" of the huge 1990s bull market, September 2002 marked the low of the dot-com bubble bear market, November 2008 was just a few months from the Great Recession bear market bottom at the beginning of 2009, March 2000 was the pandemic bear market low, and finally, December 2022 was very close to the bear market low of 2022.
The major lows of this relative total return index — when low beta stocks significantly underperform high beta for a period — usually indicate widespread optimism and very low defensiveness in the market (indicated by the red dates in Figure 3) and have historically proven to be times when investors should be cautious in the market. November 1968 marked the start of the 1969-70 bear market, April 1972 was a few months before the nice 50 market crash began, April 1981 signaled the start of the bear market after the Volcker tightening, February 2000 almost precisely hit the top of the dot-com bubble bull market, and October 2021 was just weeks before the beginning of the 2022 bear market.
In October last year, this defensive indicator approached its lowest level since 1963. While the S&P 500 did experience a nearly 10% pullback earlier this year — bottoming in March — it has since rebounded to new all-time highs. Nevertheless, the U.S. stock market's low/high beta relative performance remains severely depressed, still signaling potential difficulties for the overall stock market in the coming months.
The red dashed line represents the lowest quintile of this measure since 1963. As shown in the chart, when the low/high beta relative index is in the lowest quintile, the S&P 500's average annualized total return over the next 1 month is only 7% (below average), while the average future annualized total return during other times is 13.4%. In other words, historically, when defensiveness is in the lowest quintile, the S&P 500's future 1-month average annualized total return is about "half" of what the stock market provides at other times. When defensiveness diminishes, investors are best advised to "be cautious."
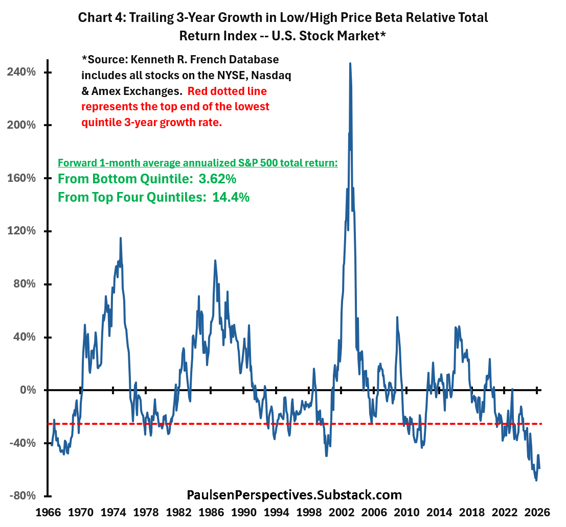
Chart 4 illustrates this more clearly, showing the past 3-year growth of the low/high price beta relative total return index (i.e., the past 3-year growth of the series shown in Chart 3). While the level of relative performance of low/high beta is important for future stock market returns, the extent of persistent underperformance is also crucial. Today, not only is the relative total return of low/high beta stocks nearing historical lows, but low beta stocks have also consistently underperformed at least over the past 3 years. As shown in Chart 4, historically, whenever the past 3-year relative total return of low/high beta stocks is in the lowest quintile since 1963 (i.e., below the red dashed line indicating severe and persistent underperformance of low beta stocks, as it is currently), the future 1-month average annualized S&P 500 total return has been very disappointing, at only 3.62%, while the average annualized total return during other times is 14.4%. The magnitude of underperformance of low beta stocks, especially in the recent long-term, indicating that investors have disregarded caution, suggests a challenging path ahead for the S&P 500 in the coming months. Historically, when this caution signal flashes red as it does today, the future 1-month average annualized S&P 500 total return is almost four times lower than at any other time since 1963.
Consider Overweighting Broad Market Exposure
While overall stock market downside volatility may affect all stocks, I doubt any sell-off would be concentrated in the highly popular (high beta) New Era stock sectors. Therefore, adjusting the portfolio to reduce holdings in these over-owned sectors and increase exposure to broader market targets such as small-cap stocks, value stocks, defensive and cyclical sectors, and international stocks may outperform the overall S&P 500 for the remainder of the year.
Chart 5 shows the relative total return index of the "broad market" proxy since 1950. Several points are worth noting. First, since around 2011, the broader market has mostly underperformed the overall S&P 500 index—similar to the sustained underperformance seen from 1983 to the end of the 1990s. In fact, since 2011, the relative total return of broad market targets has declined from the highest quintile to the lowest quintile. Using its relative total return index as a guide to attractiveness, it has shifted from massive over-allocation and being overly popular in 2011 to extremely underallocated and cheap today.
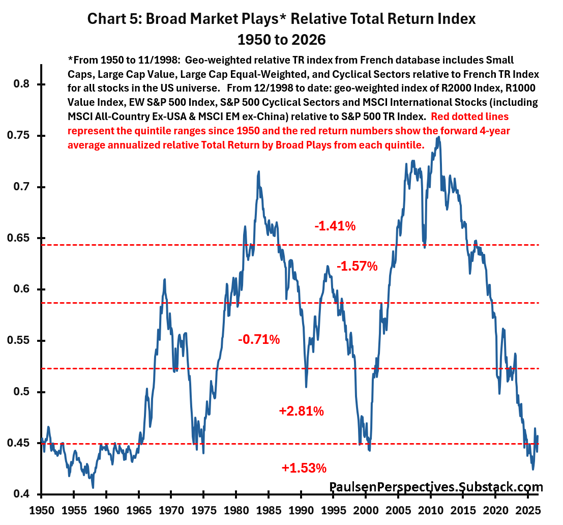
Second, historically, the relative performance of broad market benchmarks has often gone through 'long' cycles. It significantly outperformed from 1958 to 1969, underperformed from 1969 to 1975, led the stock market almost continuously for nearly a decade from 1975 to around 1984, suffered nearly 15 years of underperformance from 1985 to 2000, led again for the past decade prior to 2010, and has mostly underperformed in the last 15 years. Extended periods of relative performance are not uncommon. Crucial is whether the relative performance low point reached last October holds, this current period of broad market underperformance could represent one of the longest stretches of underperformance in the post-war era. The recent era of broad market underperformance has been both prolonged and pronounced, and importantly, a turning point seems overdue.
Third, since October 2025, broad market benchmarks have once again surpassed the overall stock market, marking the 'first' time during the current bull market era. Interestingly, while most are still focused on AI and other 'tech stocks' leading the market, the 'broad market benchmarks' have quietly outpaced the market by one of the largest margins in the past 15 years.
Finally, as shown in Chart 5, since 1950, when the relative broad market total return index has been in the lowest two quintiles (as it is today), the future 1-month annualized average return of broad market benchmarks has outperformed the overall S&P 500 index by 1.53% to 2.81%. If broad market benchmarks have indeed turned a corner, they may continue to outperform the overall S&P 500 for a period of time.
Final Remarks
I am concerned that the 'defensiveness' of the U.S. stock market seems to have vanished. Most investors are still more worried about 'missing out' on the next stage of this new era bull market—now purportedly led by AI stocks—than about any significant market setback.
An interim 'gut check' for investors may be on the horizon, led by the new era stocks, but not necessarily limited to just new era stocks. My guess is that even if the new era stocks do pull back by more than 20%, a bear market will be avoided. I'm not suggesting that investors should sell all tech stocks. I do not expect the upcoming potential volatility to replicate the bursting of the dot-com bubble. However, I would tilt the overall portfolio to an underweight position in new era stocks and increase exposure to 'broad market benchmarks.' Given that broad market benchmarks have outperformed the large cap index since last October, reducing new era stocks may still be beneficial to your overall relative performance even if new era stocks and the broad market continue to rise in the coming months.
Original Article Link
Welcome to join the official BlockBeats community:
Telegram Subscription Group: https://t.me/theblockbeats
Telegram Discussion Group: https://t.me/BlockBeats_App
Official Twitter Account: https://twitter.com/BlockBeatsAsia