Data Analysis: How Wide is the Liquidity Gap Between Hyperliquid and CME Crude Oil?
Original Title: 432 Hours of Hyperliquid Oil Market Data: A Microstructure Comparison with CME WTI Futures
Original Source: Castle Labs
Original Compiled by: Golem, Odaily Planet Daily
Editor's Note: This article systematically studies the difference in crude oil contract trading data between Hyperliquid and CME during weekdays and weekends, drawing some important conclusions. Currently, Hyperliquid indeed lags behind CME in absolute metrics such as liquidity depth or slippage, with overall liquidity of less than 1%, attributed to the fact that the main users of the RWA trading platform are still native crypto retail.
A distinctive feature of Hyperliquid is the significant increase in crude oil contract trading volume during weekends. This indicates that in addition to retail traders with speculative demand, traders looking to obtain crude oil exposure and hedge positions before Monday also trade on Hyperliquid. This trend is becoming more pronounced, giving Hyperliquid the ability to discover commodity prices.
However, for institutional investors, the high transaction costs on the Hyperliquid platform remain a major obstacle to its expansion in the commodity trading sector compared to CME. If Hyperliquid does not enhance its ability to handle institutional-level orders early on, it will only serve as a temporary weekend trading venue for traditional traders, ultimately becoming a minor addition to the traditional financial landscape. The following is the original content:
Research Methodology and Data Sources
This analysis evaluates the microstructure of the oil market through two studies covering weekday and weekend markets, using tick-by-tick transaction data from two exchanges, Hyperliquid's xyz:CL perpetual contract and the Chicago Mercantile Exchange (CME) CLJ6 (April 2026 NYMEX WTI crude oil futures) contract.
CME data is sourced from the Databento trade data feed, capturing tick-by-tick transaction data rather than order book snapshots. Therefore, all depth and slippage estimates for CME are based on actual transaction volume rather than quote depth. Hyperliquid data is sourced from Hyperliquid's publicly available S3 database, which includes full on-chain transaction records.
Therefore, the analysis of both exchanges is based on actual trading volume. All depth data represents explicit liquidity, meaning the volume traded within a specific tick range around the VWAP mid-price in a 5-minute window, rather than the full resting depth on the order book.
Research Period and Market Background
The research period was from February 27, 2026, to March 16, 2026, a time when geopolitical tensions were high following an attack by Iran on February 28, 2026.
· Market Close Pre-Attack: The last CME trading day before the attack event.
· Monday Opening: The market reopened under significant pressure, with CME prices gapping up, while the Hyperliquid xyz:CL market was constrained by discovery boundaries.
· Subsequent Weekends: Due to sustained high oil prices, market volatility kept the crude trading volume on the Hyperliquid platform elevated.
xyz:CL launched at the beginning of 2026, meaning the observation period of these three weekends covered the early maturity phase of the Hyperliquid market. Observed trends, including increased liquidity depth, trading volume, and user growth, partly reflected market maturation. However, we believe that on-chain trading platforms currently cannot match traditional trading platforms in absolute metrics like liquidity depth or slippage.
Our research goal is to track directional trends: whether the price spread between the two is narrowing, at what rate, and under what conditions.
Data Analysis
Data analysis is divided into two parts based on time periods:
· Weekday Period: Covering the full three-week period, comparing the depth, slippage, and premium/discount of trading between Hyperliquid and CME during weekdays. For Hyperliquid, we also analyzed its funding rate throughout the period.
· Weekend Period: Within the given time frame, including three weekends, we analyzed price discovery and the price gap deviation of Hyperliquid relative to CME's opening price.
Weekday Period Data Analysis
This analysis covers a full three-week period, focusing on periods when both trading platforms are simultaneously active.
Liquidity depth is measured by the USD trading volume within the VWAP midpoint price range of ±2, ±3, and ±5 basis points in each 5-minute interval and aggregated as the median for all weekday intervals. As mentioned above, this reflects traded volume within the interval, not resting quote depth. This method may underestimate the liquidity depth of CME and Hyperliquid.
Execution slippage is estimated using a synthetically ordered order book sorted by transaction price. Within each 5-minute interval, observed market order execution records are sorted in ascending price (simulating sell-side orders) and executed sequentially as sell orders until the target order size is reached. The arrival price is set as the lowest transaction price in that interval (representing the best ask price at the time of order arrival). Slippage is calculated as the difference between the execution volume-weighted average price (VWAP) and the arrival price, expressed in basis points. This method is applied to order sizes ranging from $10,000 to $1,000,000.
Weekday Period Hyperliquid-CME Basis: Tracks the signed price difference between the Hyperliquid midpoint price and the latest CME price in all weekday period 5-minute windows. This can reflect any structural premium or discount of Hyperliquid relative to the CME reference price during active periods. The Hyperliquid midpoint price is derived from the volume-weighted average price (VWAP) of trades within each 5-minute trading interval, not real-time order book quotes.
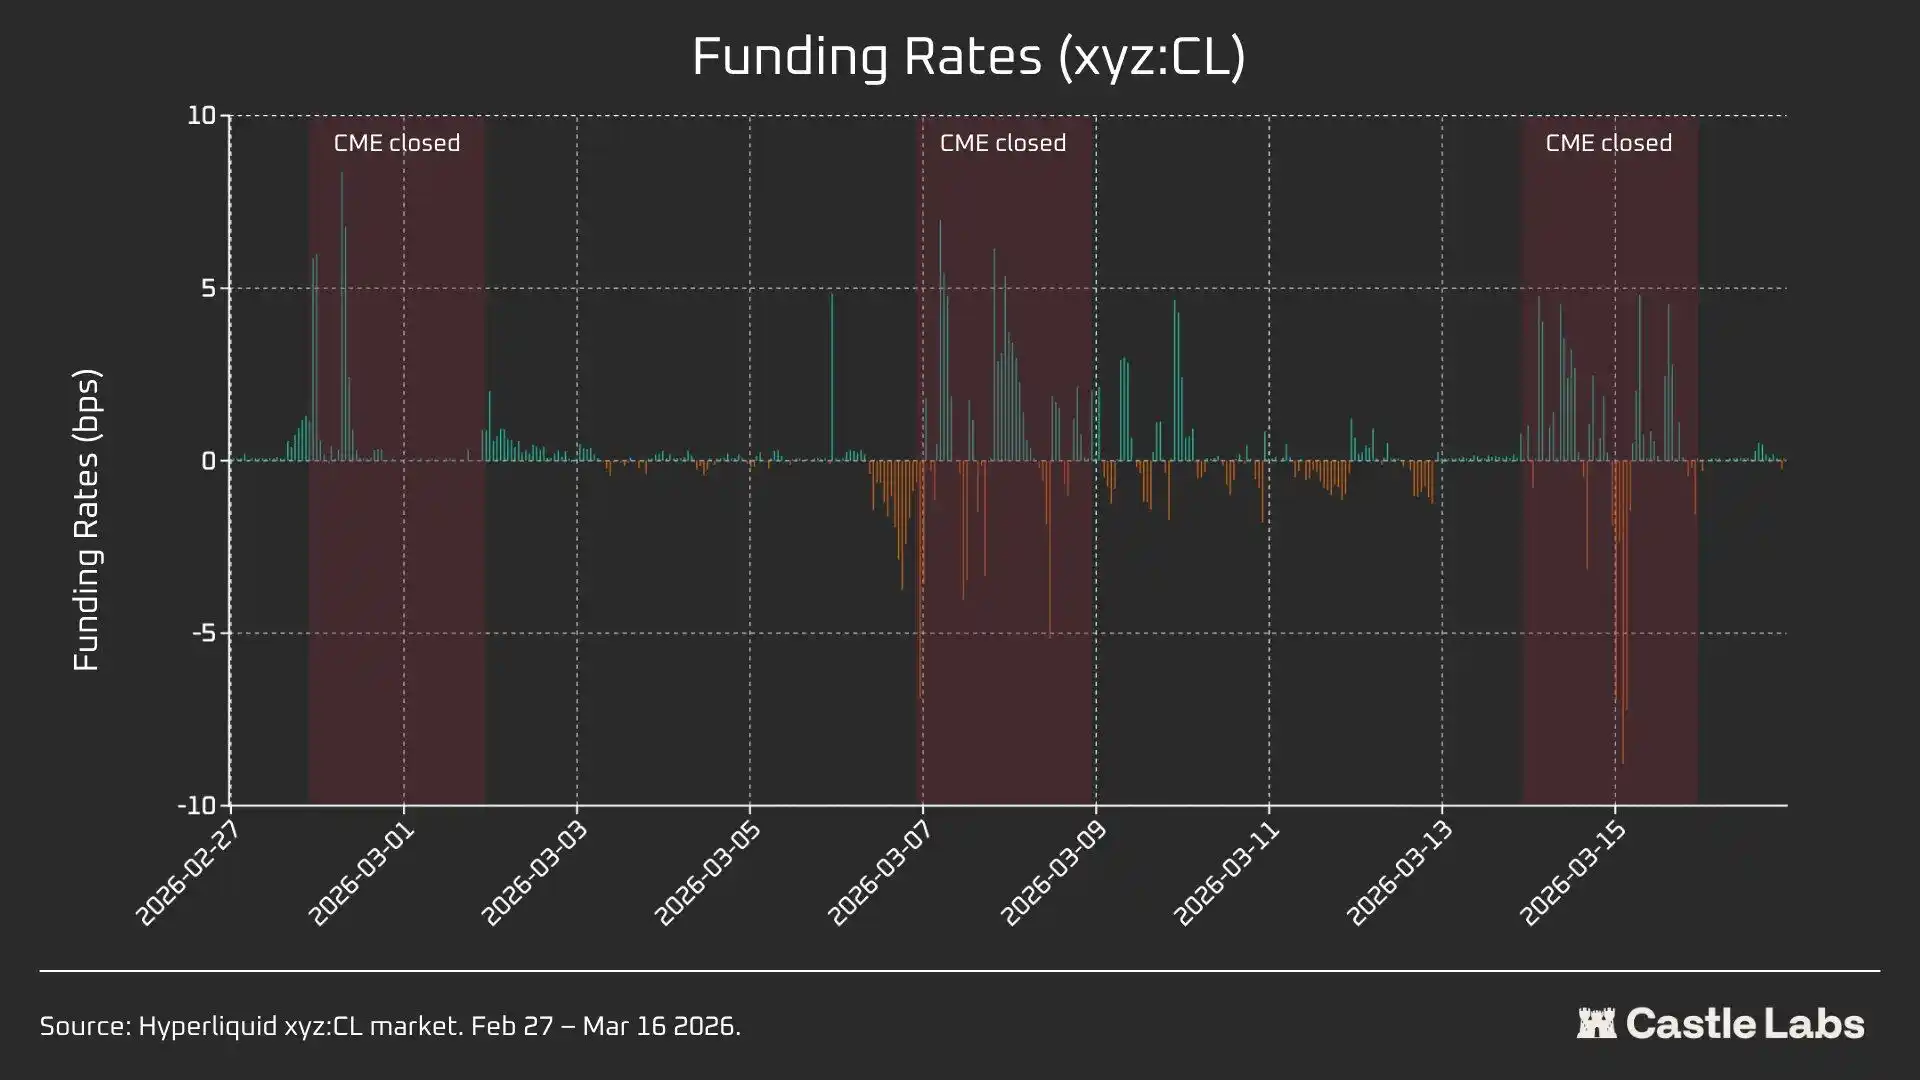
Hyperliquid Funding Rate is assessed hourly, with the funding rate expressed in basis points per hour.
Weekend Period Data Analysis
This analysis focuses on three different weekend closure periods for the CME:
· W1: February 28 to March 1, 2026
· W2: March 7 to March 8, 2026
· W3: March 14 to March 15, 2026
In W1 and W2, Hyperliquid perpetual contracts are restricted, so the mark price cannot exceed the "Band Boundary (DB)."When the oracle price freezes (for example, when the primary reference market (CME) is closed, and the external price data source stops updating), the protocol effectively constrains the price within a narrow range.
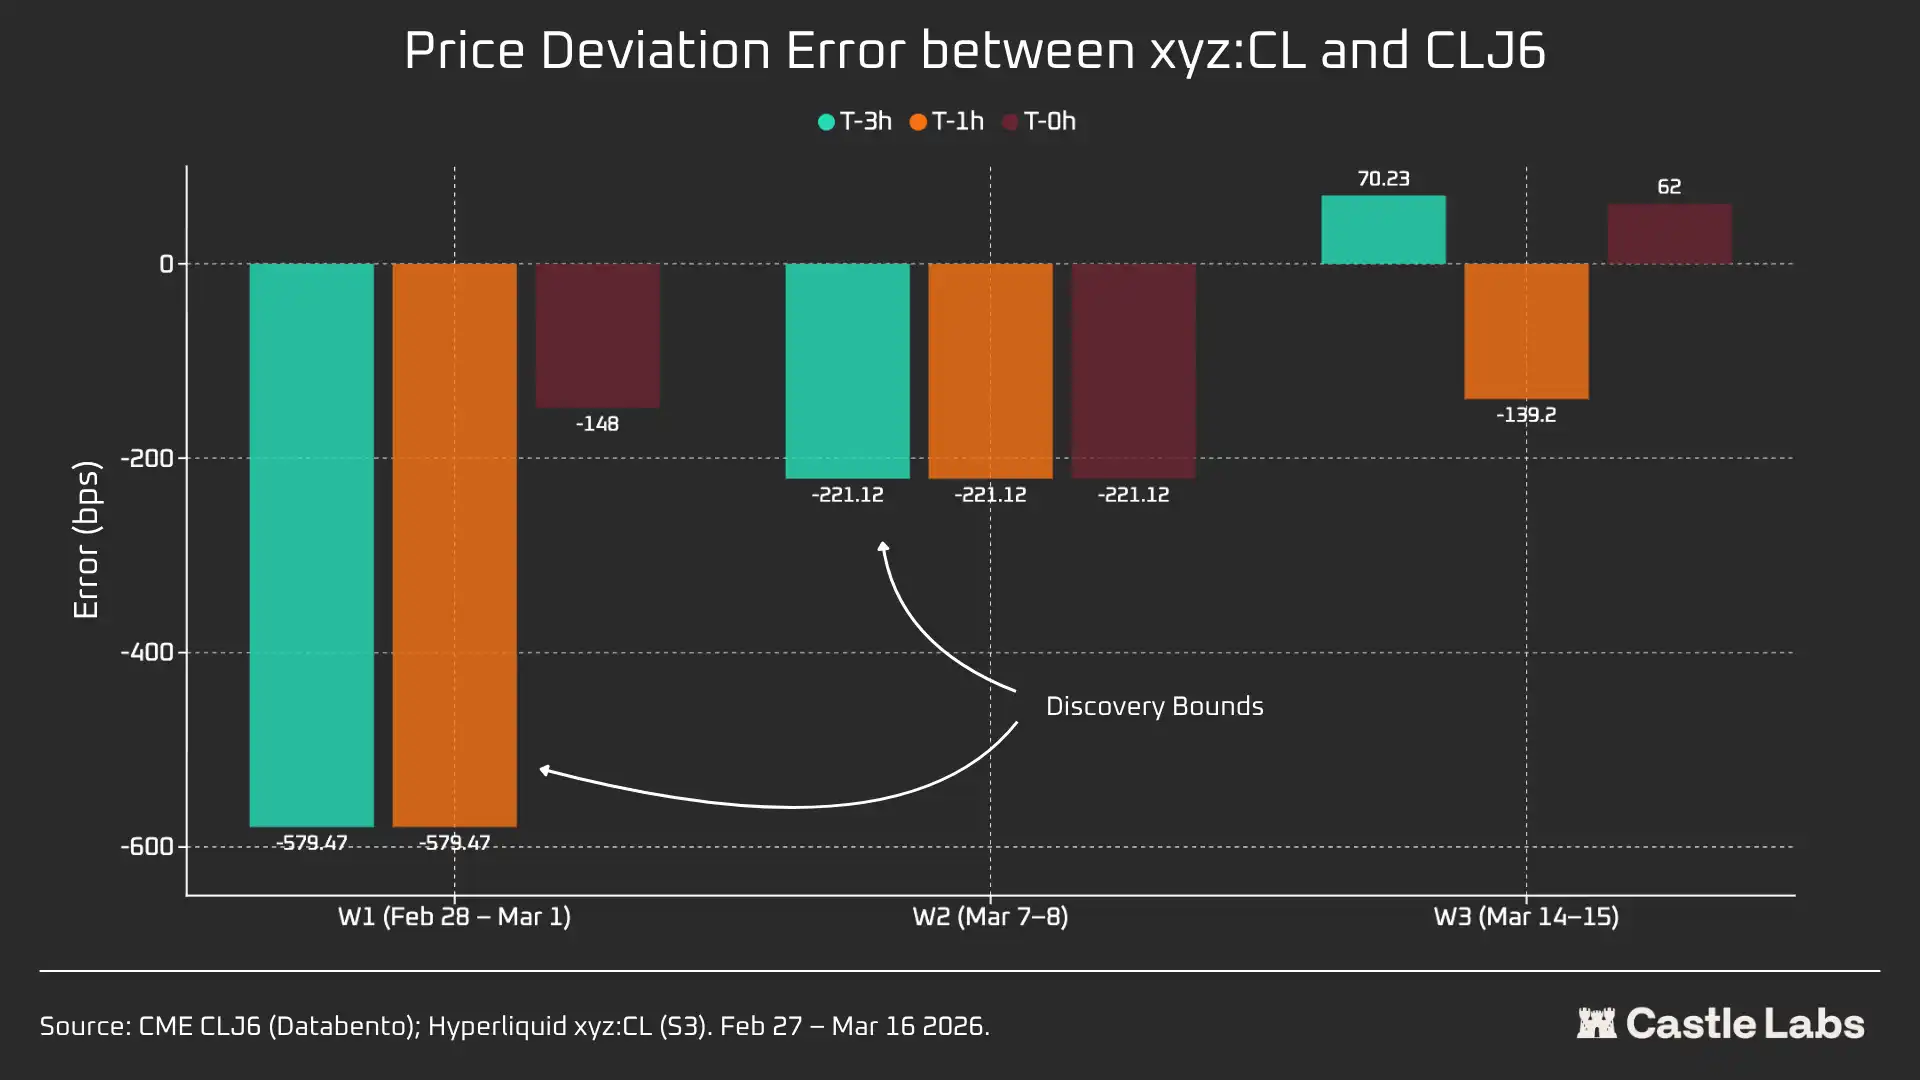
For each weekend window, we will report key data points for Hyperliquid xyz:CL, including price, volume, and number of trades. To measure the Monday opening price deviation gap, each weekend, we will measure the price difference between Hyperliquid and CME at three reference points:
3 hours before CME reopens 1 hour before CME reopens CME open (T=0)
All price differences are expressed in basis points, where a positive value indicates a premium of Hyperliquid over CME's opening price, and a negative value indicates a discount.
Quantitative Analysis
This section will first analyze and compare the liquidity of the Hyperliquid xyz:CL HIP-3 crude market with NYMEX CLJ6 during overlapping work hours.
Liquidity Depth: Hyperliquid Less Than 1% of CME
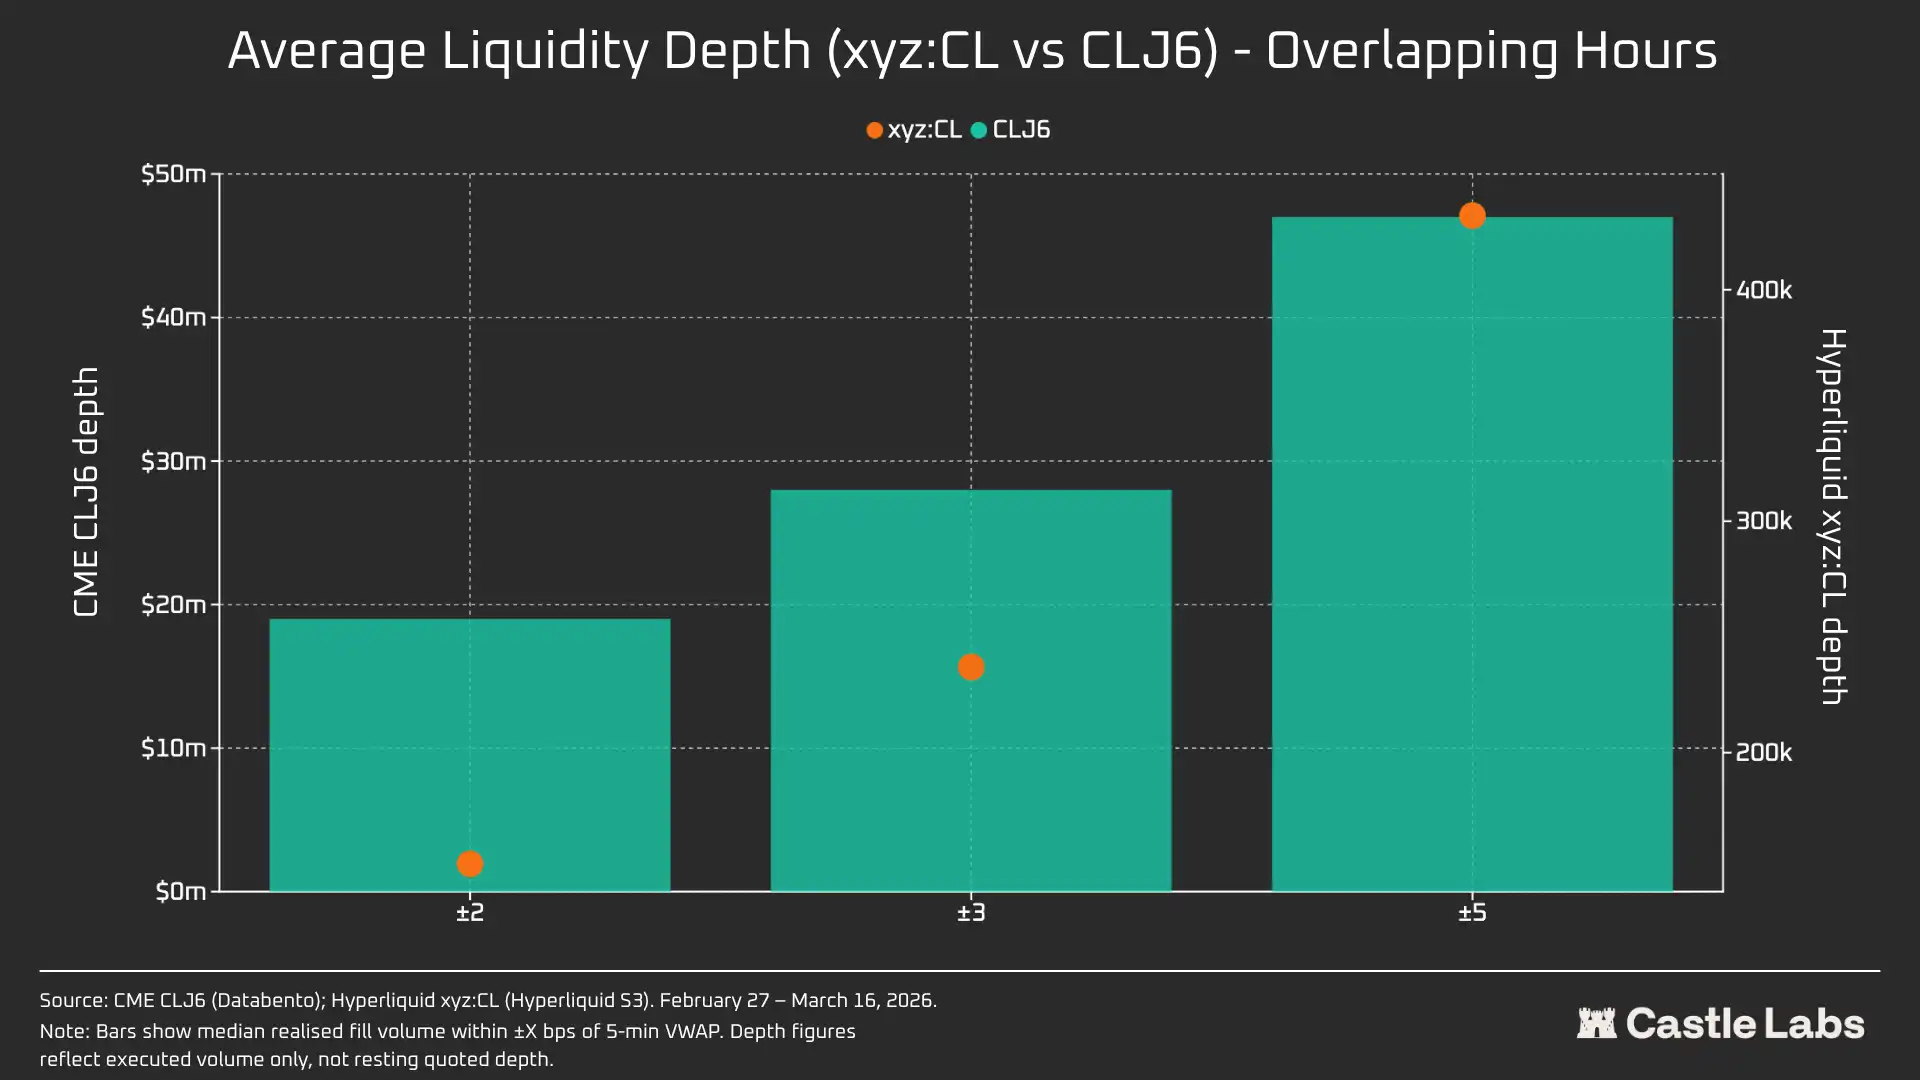
Undoubtedly, the liquidity situation on the on-chain trading platform is vastly different from CME's. The average liquidity depth of CL on Hyperliquid is less than 1% of CLJ6, and the liquidity depth across price ranges is consistent (109 times at ±5 bps). Within the ±2 bps mid-price range, CME's executable depth is $19 million, while Hyperliquid is only $152,000, a difference of 125 times.
Given the novelty of the CL market on Hyperliquid and its different target user base, this result is not surprising. The primary value of on-chain trading platforms is to provide an unlicensed trading channel for users traditionally excluded by institutions like CME.
However, as the weekend trading volume on platforms like Hyperliquid grows, perceptions of these platforms are starting to shift, and institutional investors are increasingly interested in hedging positions off-hours. Therefore, creating a market environment suitable for traditional investors and retail investors has become increasingly important for Hyperliquid.
For retail traders with a transaction amount of $10,000, this cost difference is negligible. But for institutional investors with transaction amounts exceeding $1 million, the on-chain trading costs of CL (and most other markets) remain prohibitive.
In fact, the intrinsic differences in user bases are reflected in the median trade sizes during these market overlap periods.
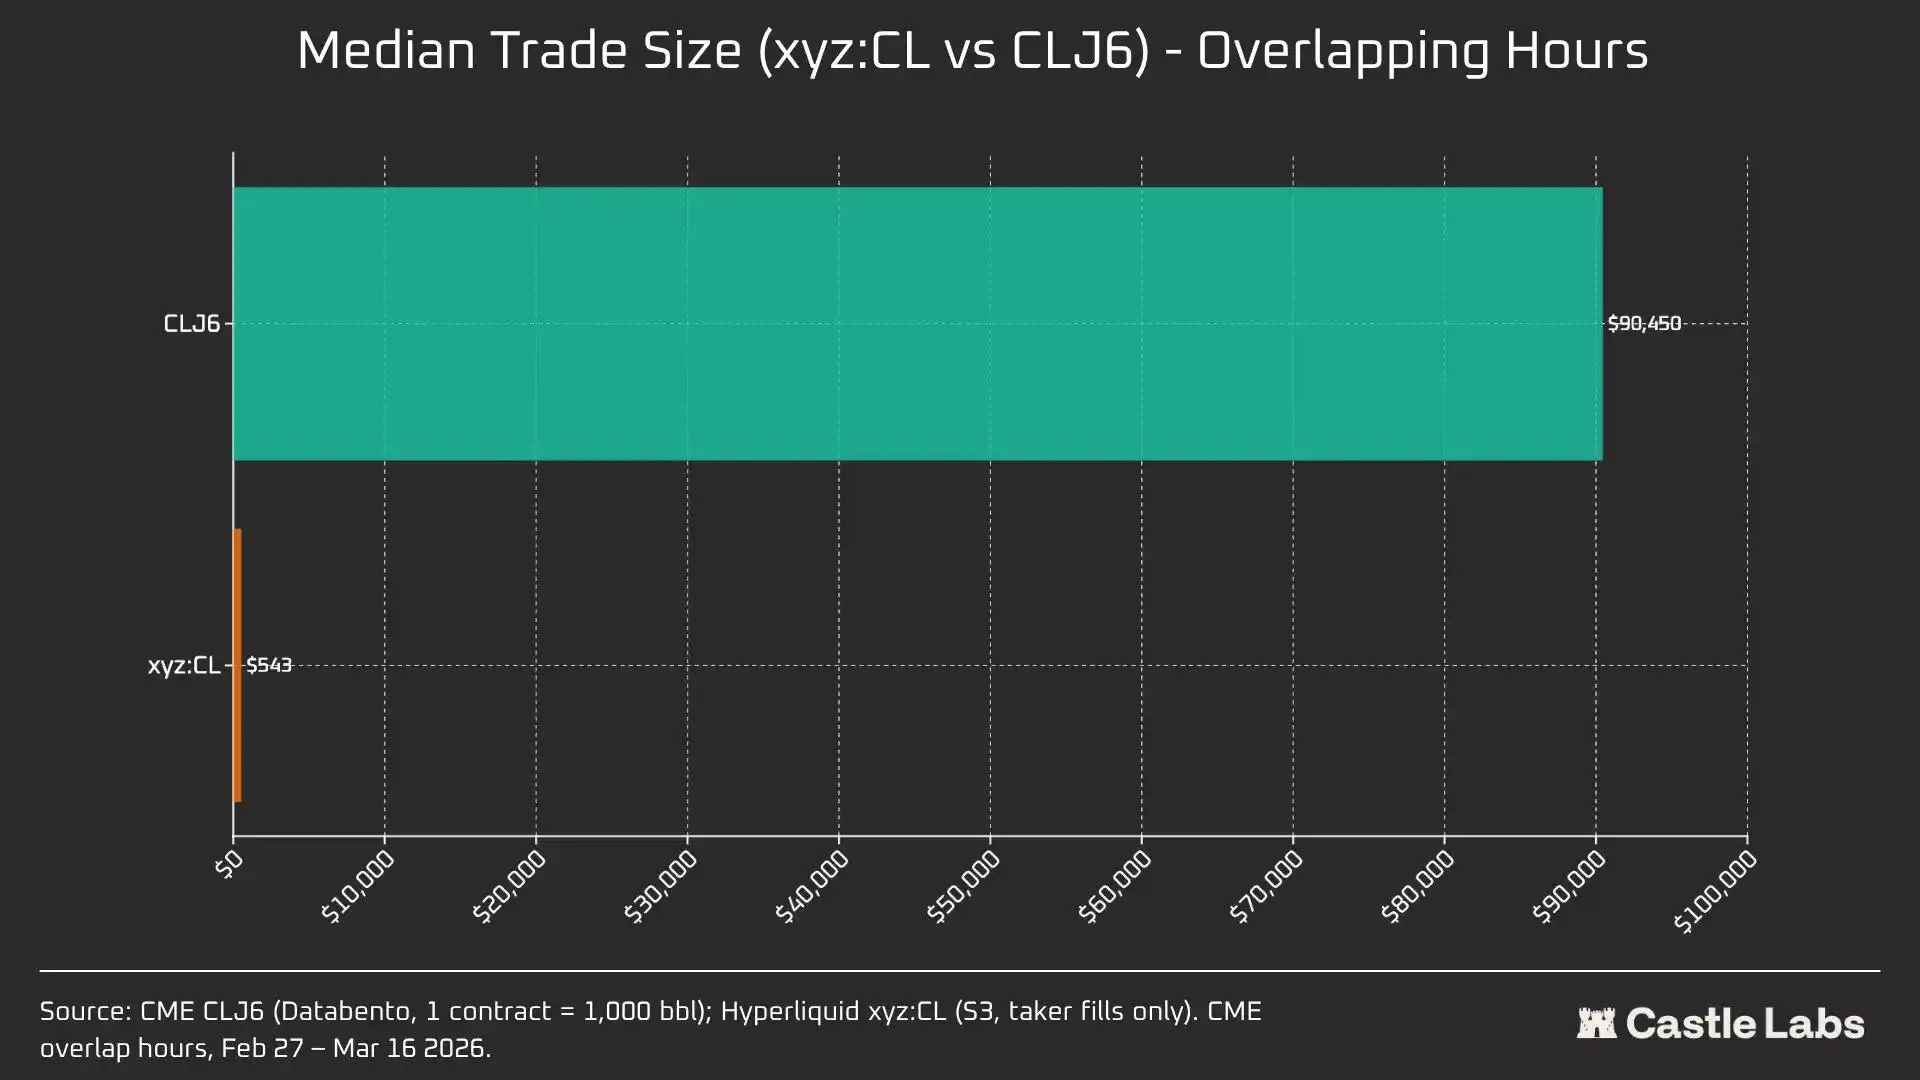
A 166x difference in median trade sizes ($90,450 vs $543) most clearly demonstrates the fundamental differences in user bases served by these trading venues. The median trade size of CLJ6 is comparable to a standard crude oil futures contract (nominal value of approximately $94,000 at current prices), while Hyperliquid's median trade size is $543, reflecting the leverage directional bets made by cryptocurrency-native retail traders.
We anticipate that as these markets become increasingly legitimized in the eyes of more traditional investors and move funds on-chain, Hyperliquid's commodity market will reach an inflection point in its median trade size.
To further differentiate between trade sizes, we conducted order simulations with order size caps ranging from $10,000 to $1,000,000.
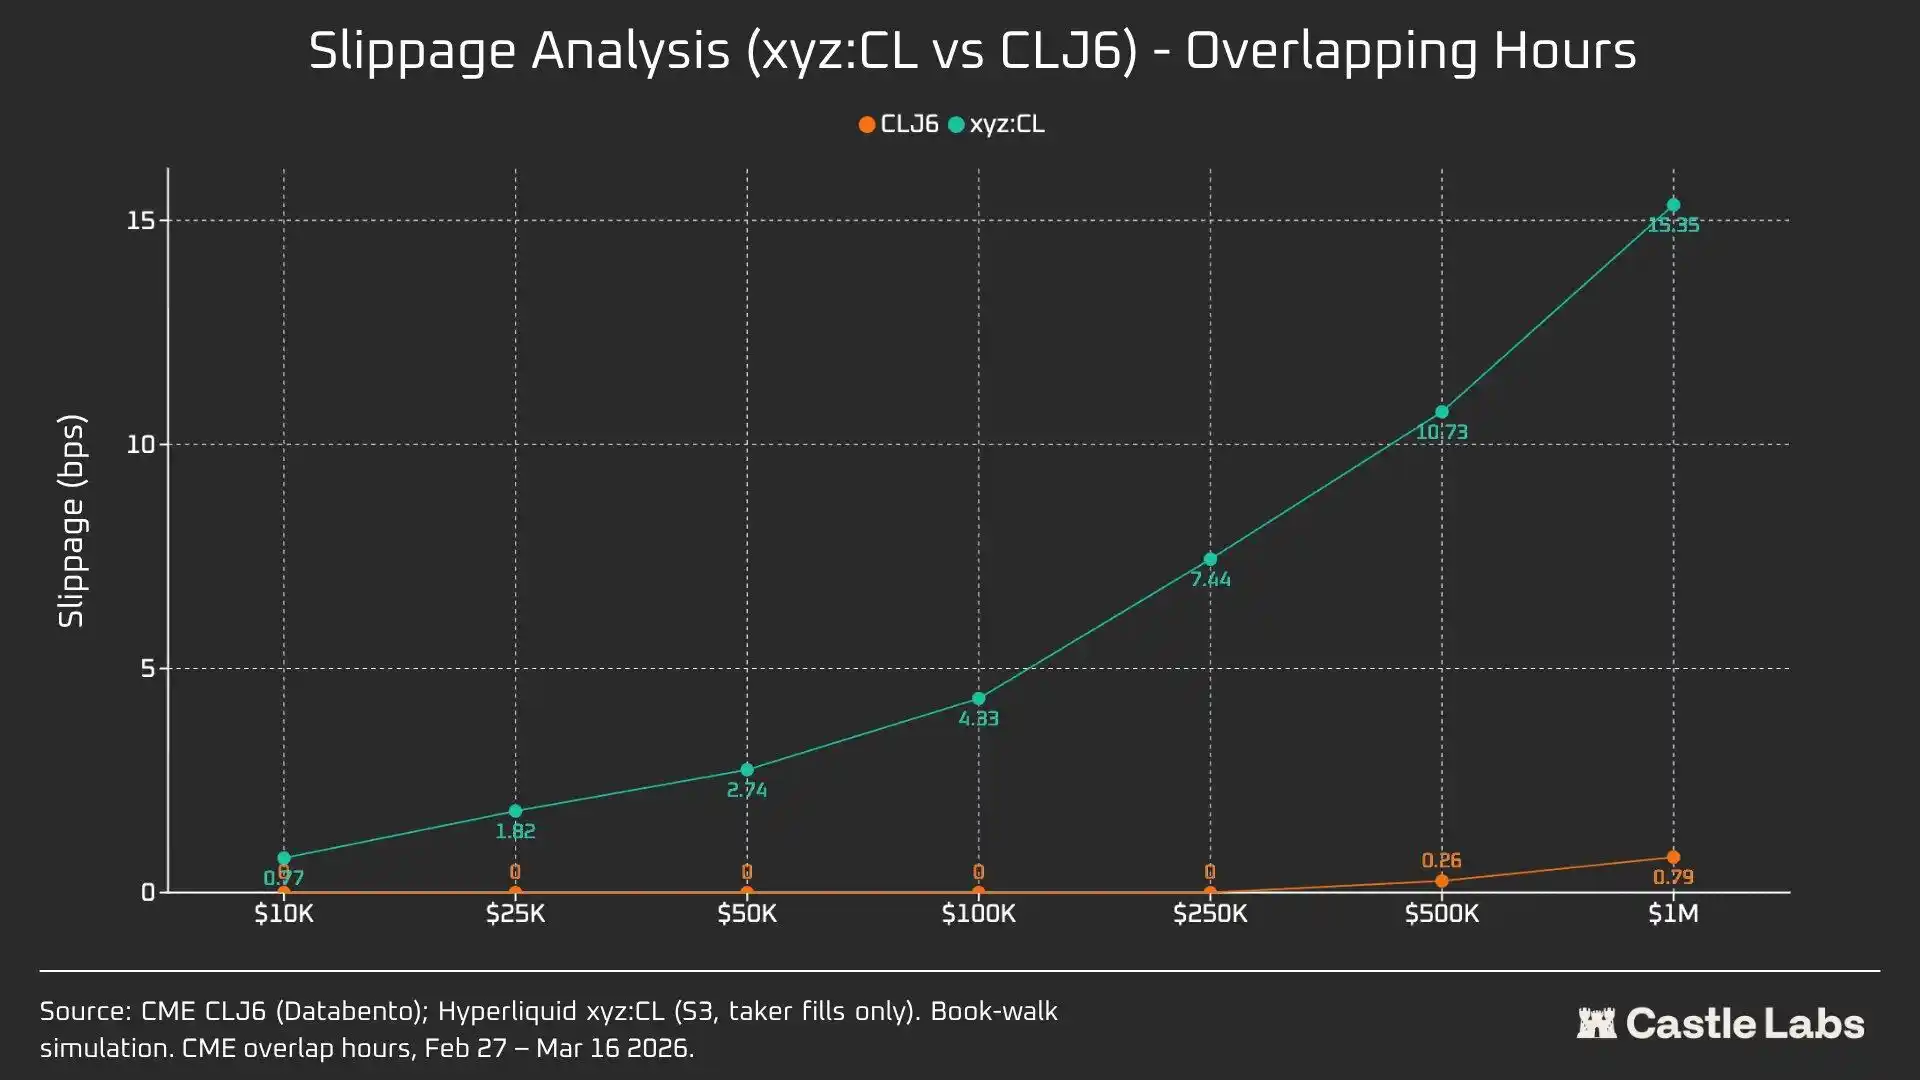
For a $10,000 order, CLJ6 traders experience no slippage, as expected, while Hyperliquid users have a sub-1 basis point median execution slippage at 0.77 basis points. The discrepancy arises with $100,000 orders, where Hyperliquid users' slippage rises to 4.33 basis points, approaching the 5 basis point threshold, while CME CLJ6 experiences no slippage.
Notably, this is higher than the median trade size of the CLJ6 market ($90,450).
At a $1,000,000 trade size, Hyperliquid's 15.4 basis points is approximately 20 times CME's 0.79 basis points, confirming that the trading venue currently lacks the capability to handle institutional-level orders. Given Hyperliquid's average trade size, the platform could easily provide equally high-quality service to users without generating slippage.
CLJ6 orders begin to experience significant slippage around the $500,000 trade size, impacting their execution.
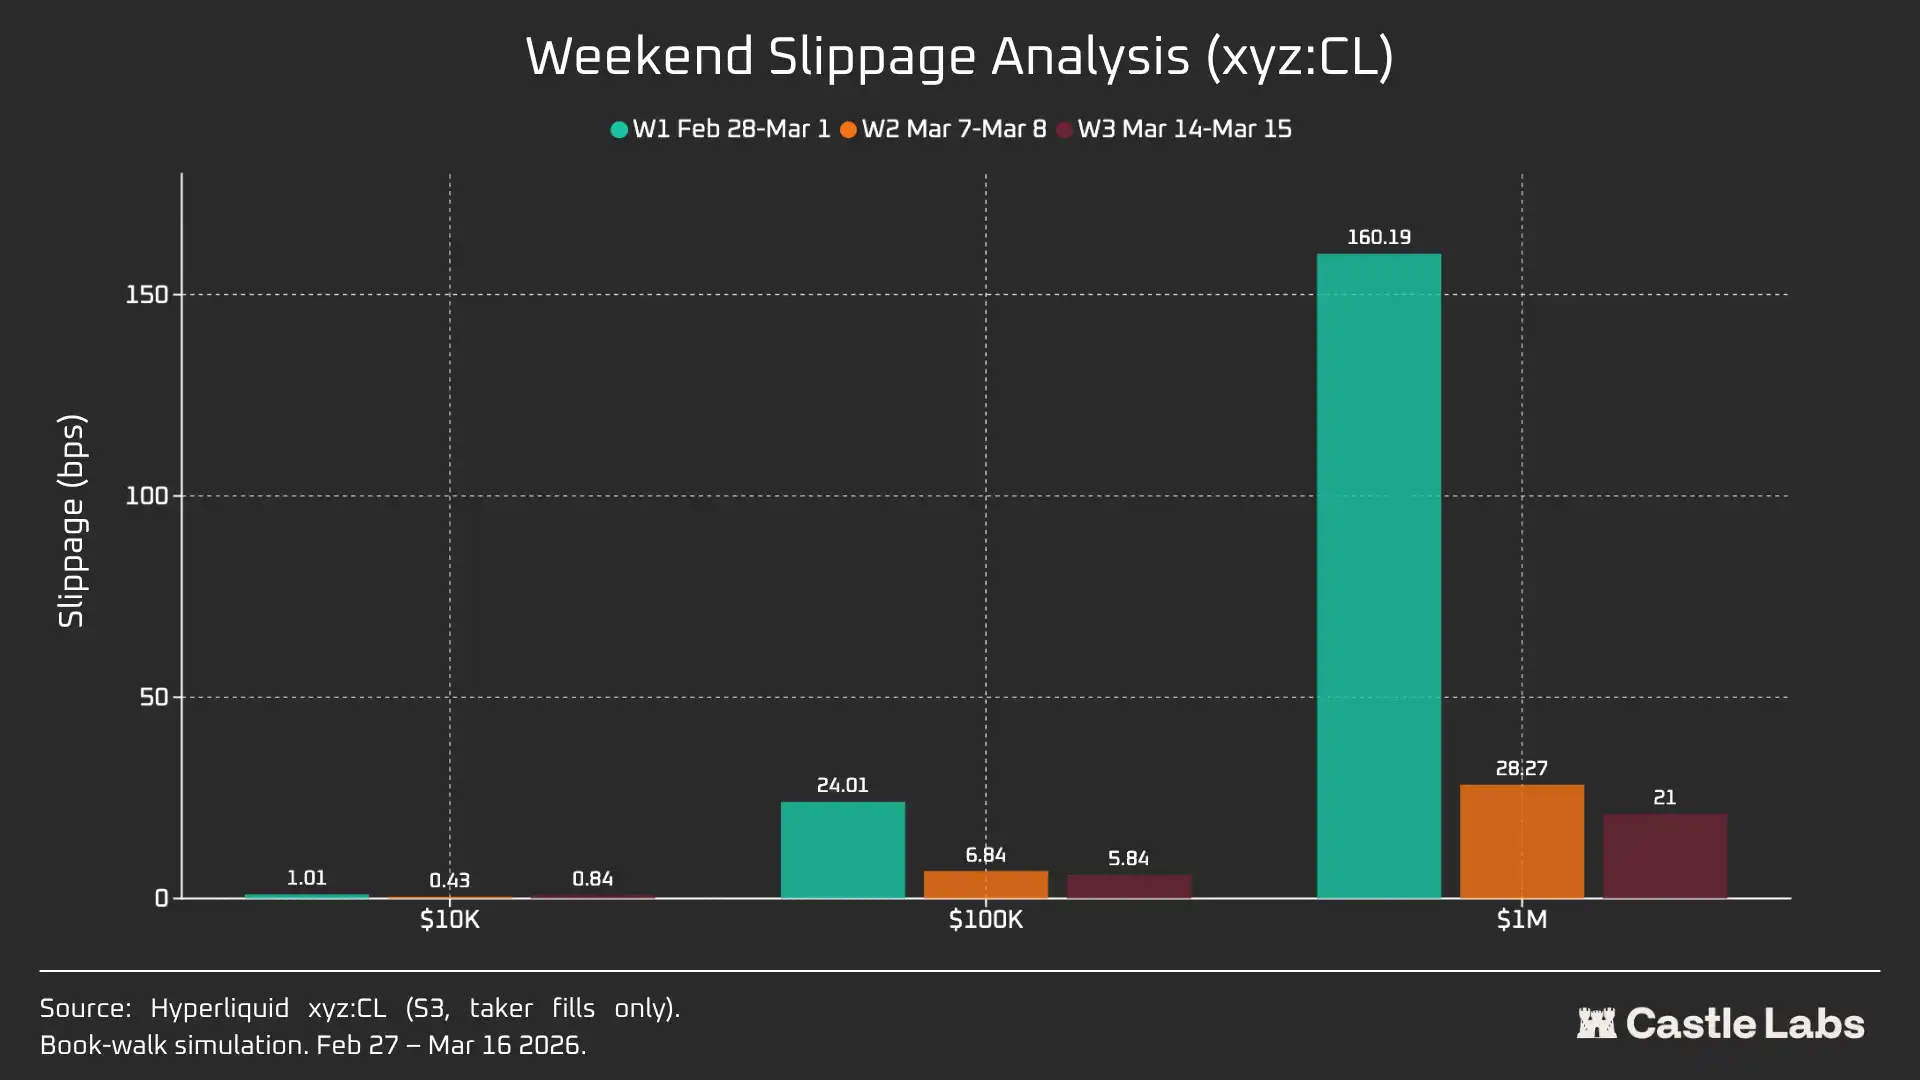
When we extend the order size analysis to weekends, slippage for all order sizes decreases, especially for the $100,000 and $1,000,000 order sizes, indicating market maturation. Over the three-week analysis period, the slippage of simulated orders decreased as follows:
· $10,000: -16%
· $100,000: -75%
· $1,000,000: -86.9%
Funding Rate
The funding rate for CL experiences significant volatility during the CME closing period but stabilizes during the delivery period. This helps us uncover the internal pricing dynamics of the market during non-trading hours. Weekend trading allows the CL market to leverage an internal price discovery mechanism supported by DB and other risk mitigation protocols. As a result, the funding rate is expected to be more volatile, as emphasized in the following text.
During active trading hours, Hyperliquid's xyz:CL closely tracks CME's CLJ6, but as oil prices increase, a structural discount emerges and widens, likely due to funding rate pressure from accumulated long positions. Over the weekend when CME is closed, Hyperliquid's price discovery is further constrained by the Price Range mechanism (DB). In the absence of a real-time reference market, this mechanism limits the fluctuation range of the mark price.
Weekend Period Analysis: Hyperliquid Demonstrates Price Discovery Capability
These three weekends have showcased the rapid maturation of the Hyperliquid market:
W1: February 28 to March 1, 2026 (Iranian Attack Event)
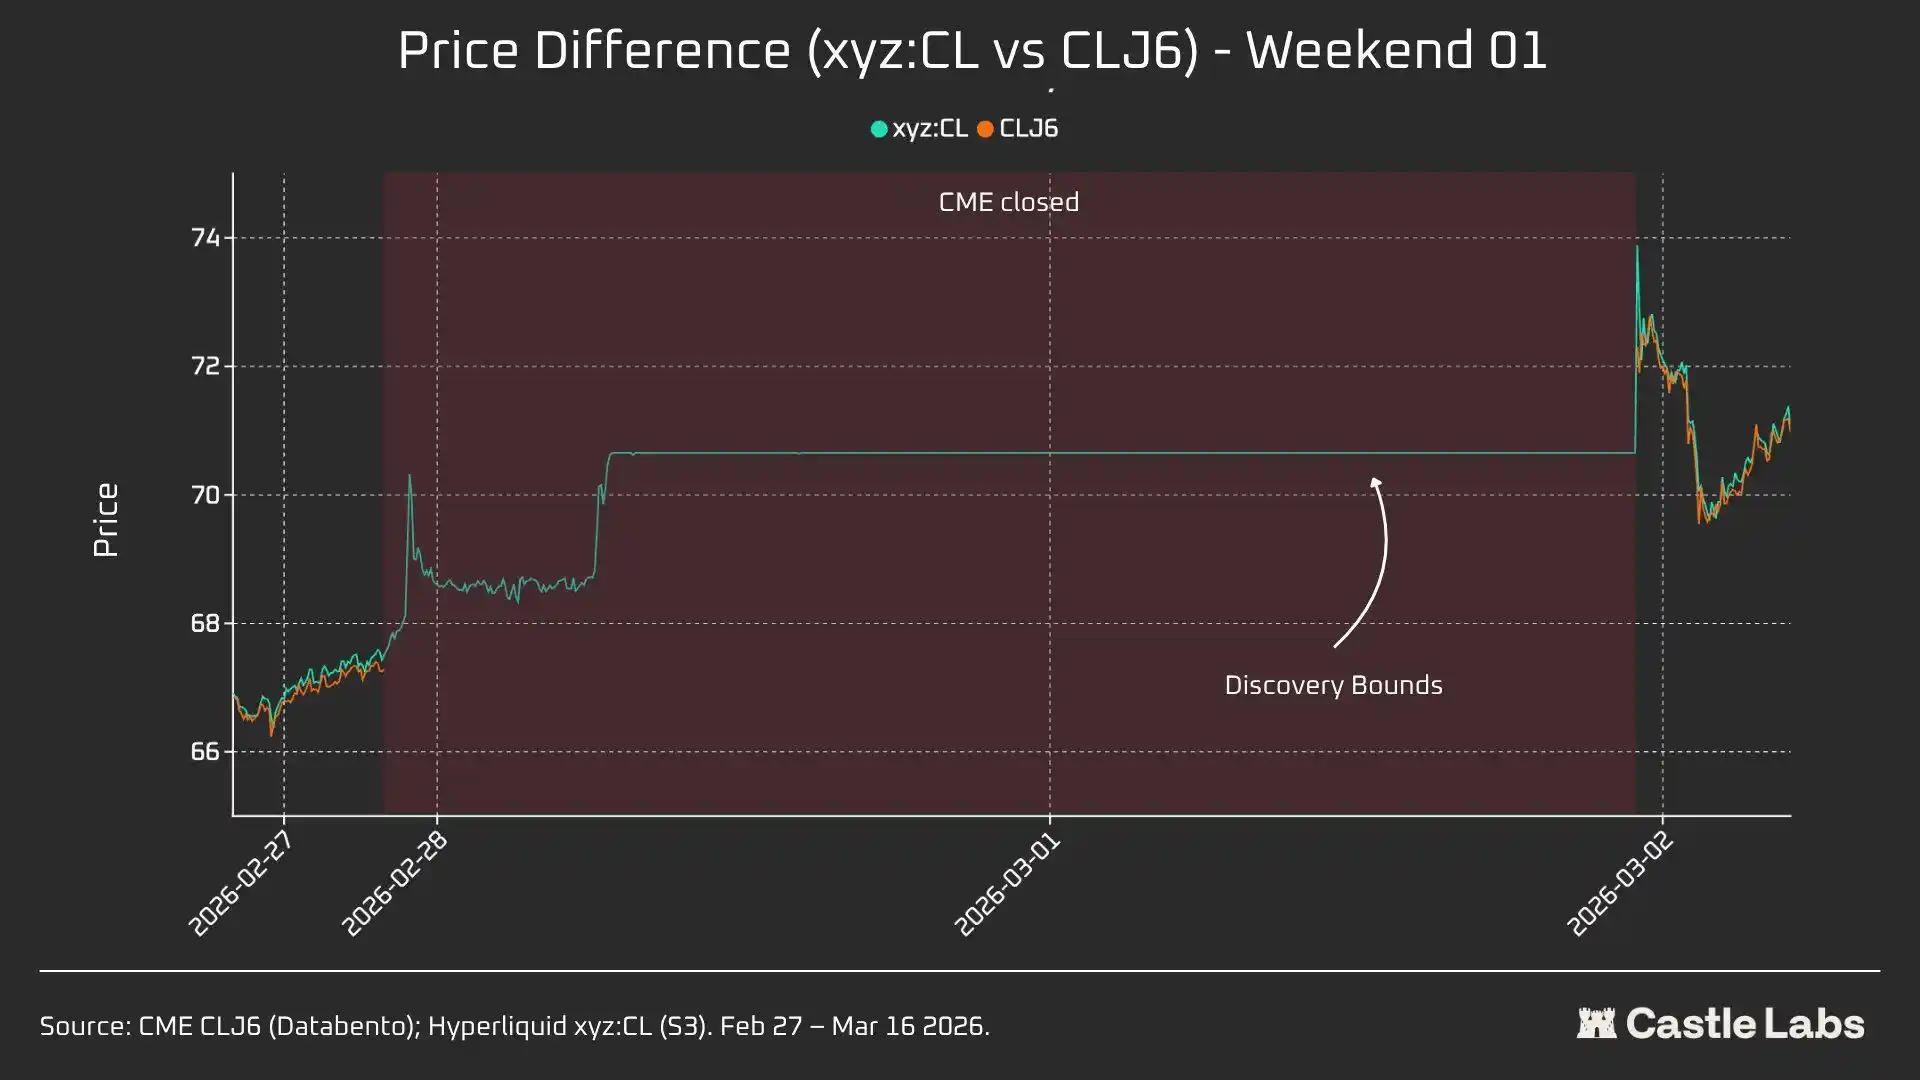
Prices on Hyperliquid rose from around $67.29, close to CME, to about $70.80, accounting for approximately 45% of Monday's eventual gap up to $75 (+1146 basis points).
It is essential to note that this weekend's price discovery was limited due to the ±5% price range restriction mechanism (DB) mentioned earlier. This explains why the curve in the chart is relatively flat and why there was a gap up on Monday. Nevertheless, at the moment pairing data is released, the difference between Hyperliquid xyz:CL ($73.89) and CME CLJ6 ($75) is within 1.5%.
This is not a "mistake" or "failure" but rather a risk protection achieved through market design. Therefore, from a data perspective, the first weekend had the lowest correlation, highlighting how xyz:CL reacted to the initial impact of the Iran airstrikes and the importance of DB as a weekend price discovery mechanism, especially for emerging markets.
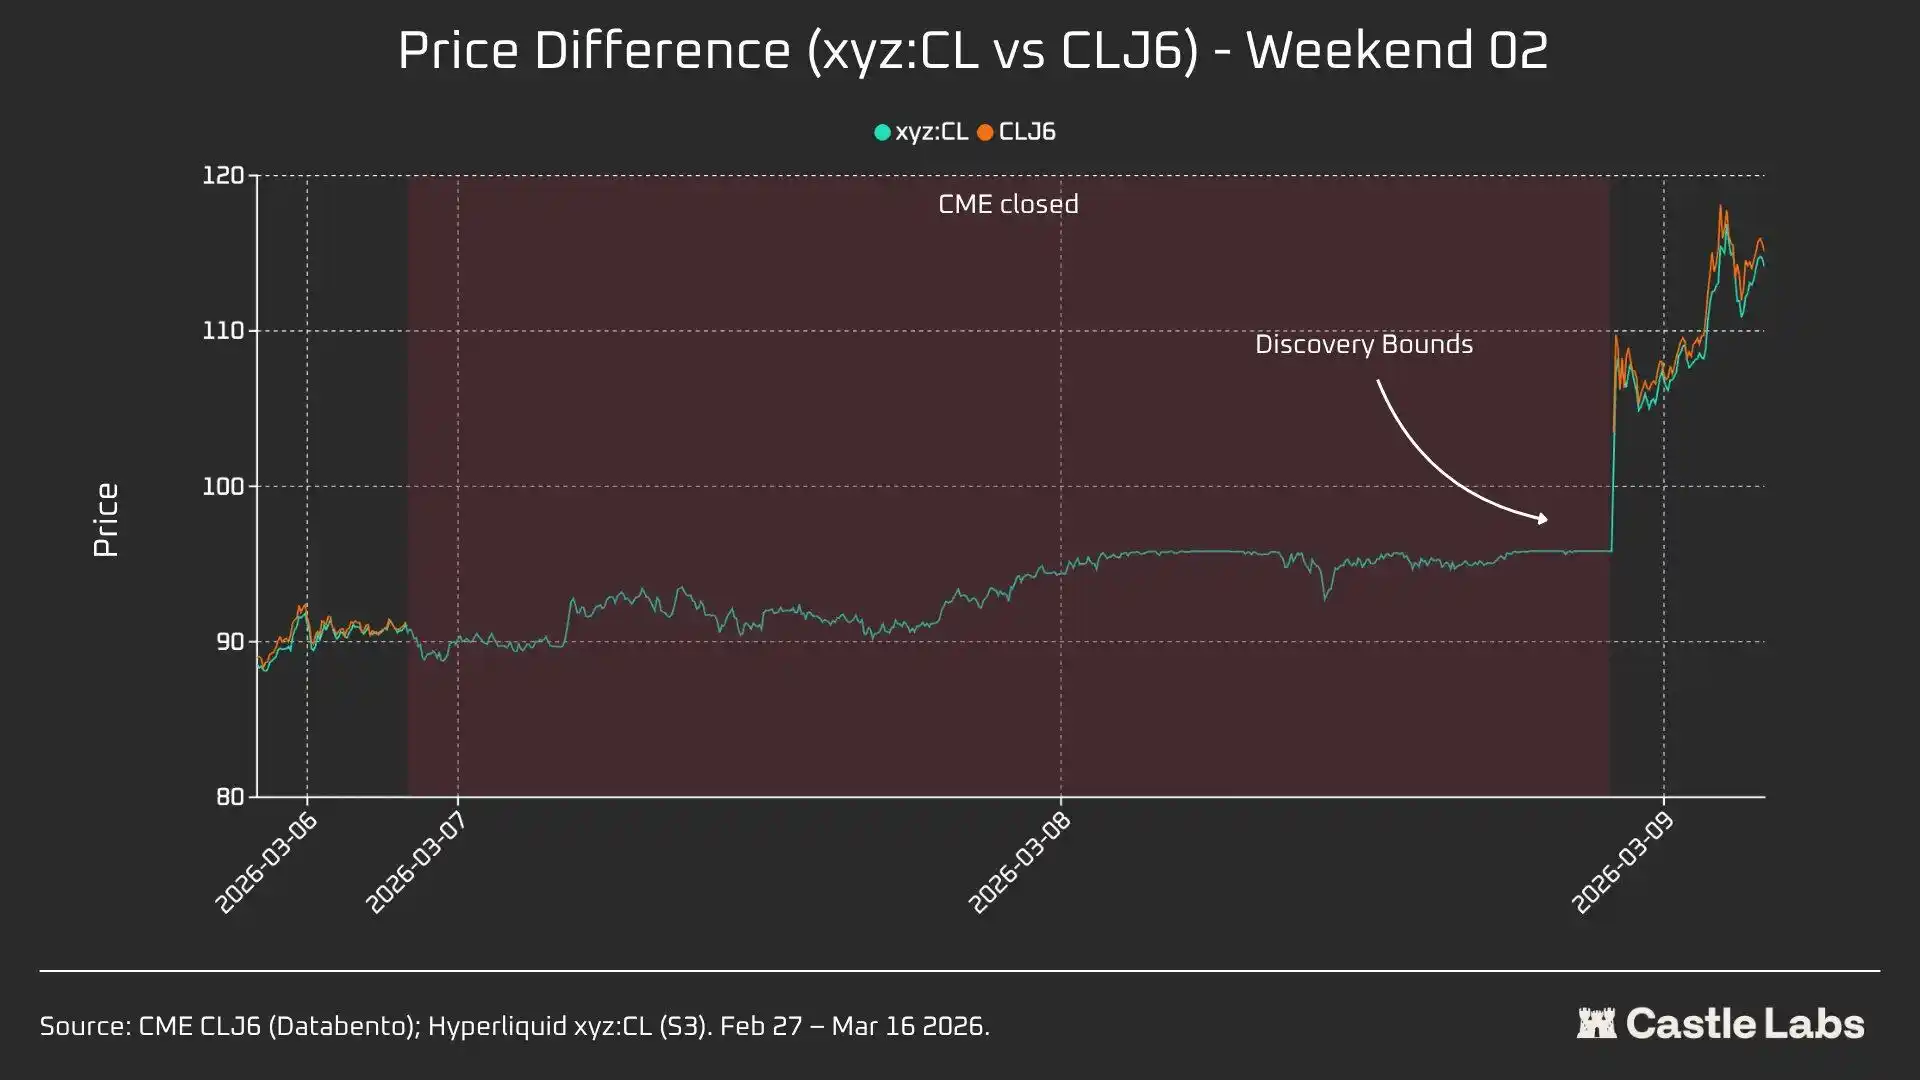
Week 2: March 7, 2026, to March 8, 2026
The second weekend was the real test as xyz:CL touched the range boundary price at the market close. The opening price for CLJ6 was $98 (a 737 bps increase from the $91.27 closing price), while xyz:CL peaked at around $95.83, capturing only a 68% gain.
During the second weekend, xyz:CL better captured the market trend and was closer to CME's opening price compared to the previous weekend.
Week 3: March 14, 2026, to March 15, 2026
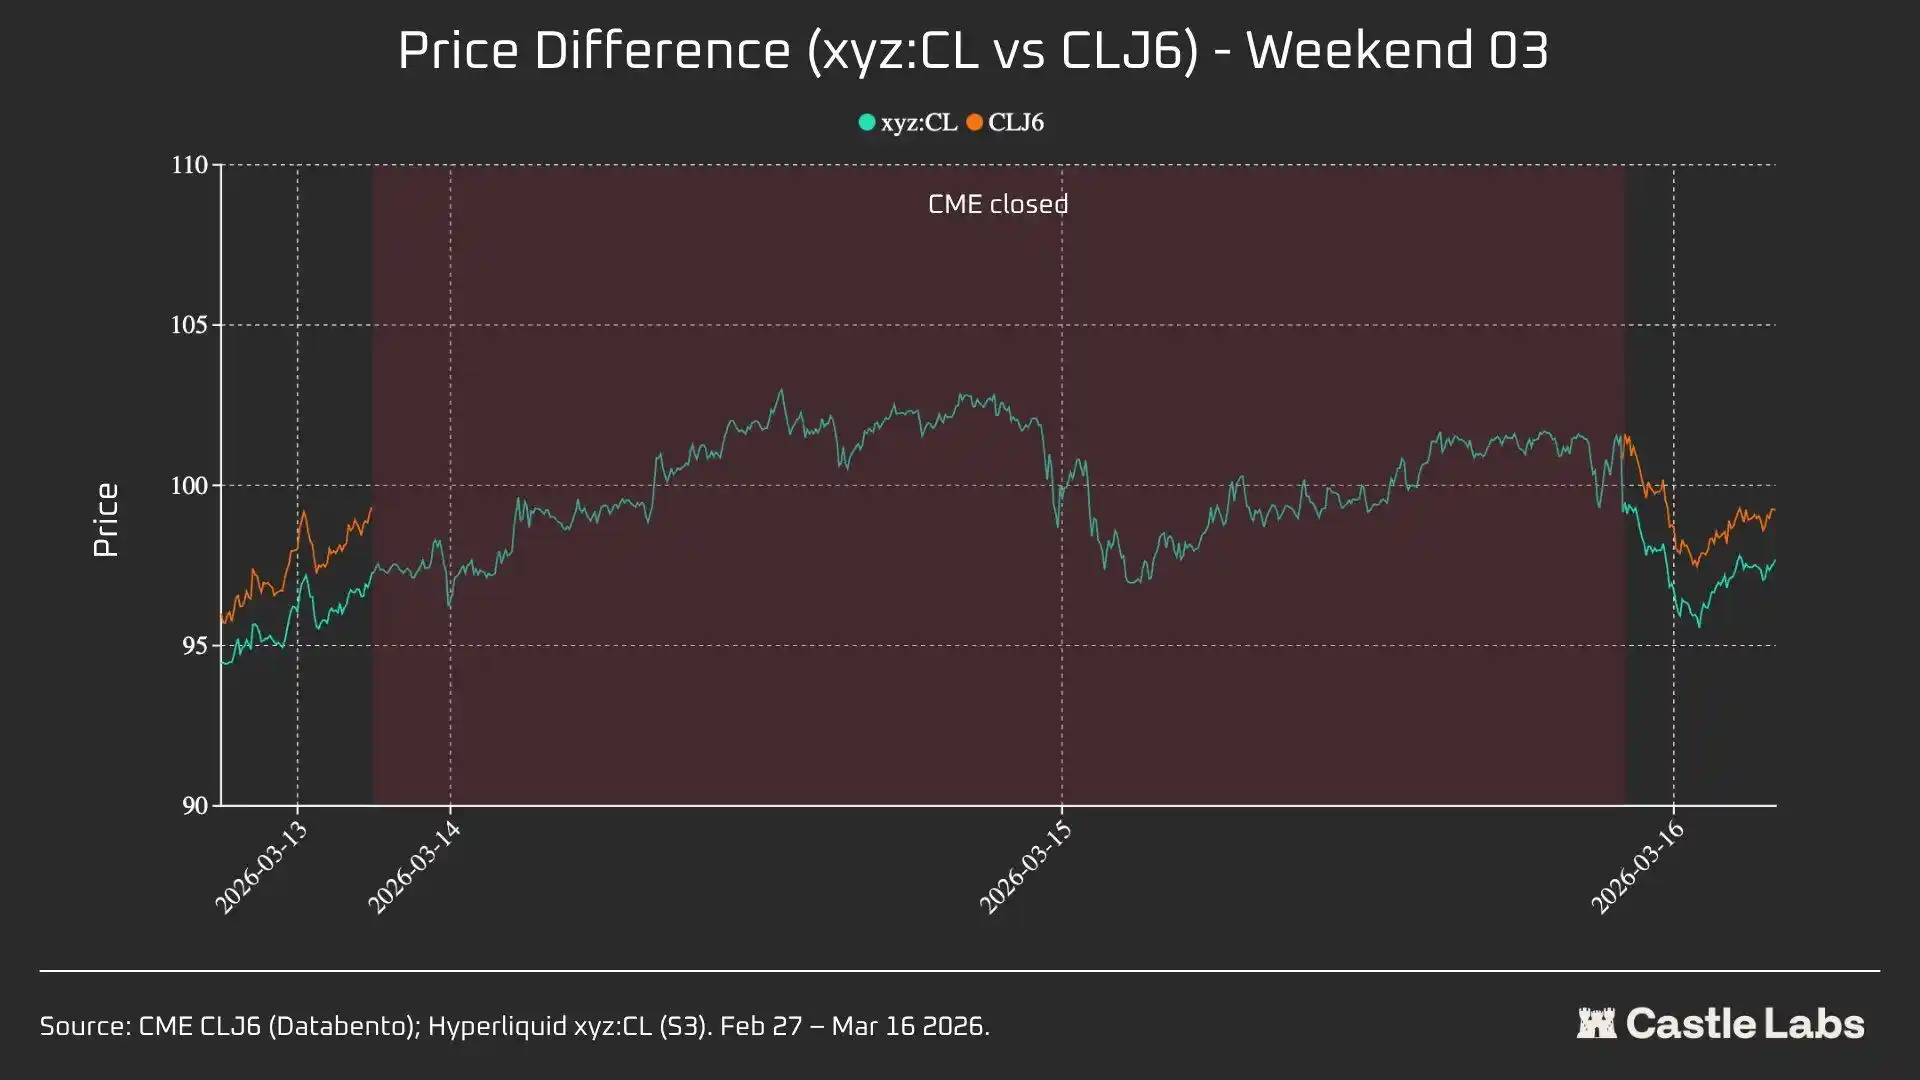
Data from the third weekend indicates that in a relatively calm market environment, Hyperliquid could more reliably predict CME's final opening direction.
During this weekend, xyz:CL showed optimal convergence with CLJ6: rising 226 bps from the CME closing price, slightly higher than the 62 bps from Monday's opening price. CLJ6 closed at $99.31 on Friday, opened at $100.93 (a 163 bps increase), while xyz:CL opened at $101.56.
Overall, these three snapshots illustrate a structural shift in the xyz:CL market on the Hyperliquid platform, transitioning from an emerging market constrained by DB price discovery (Weekends 1 and 2) to increasingly free price discovery with over- and undershooting (Weekend 3).
By analyzing the price deviation errors at different time intervals before CME's opening for each weekend (3 hours, 1 hour, 0 hours), it was found that the data from Week 3 is the most reliable, as the xyz:CL market was influenced by DB in the previous two weekends. In Week 3, the price deviations for xyz:CL were approximately +70 bps and -139 bps in the 3-hour and 1-hour periods before CME's opening, indicating its improved price discovery compared to the earlier analyzed weekends.
Other Metrics
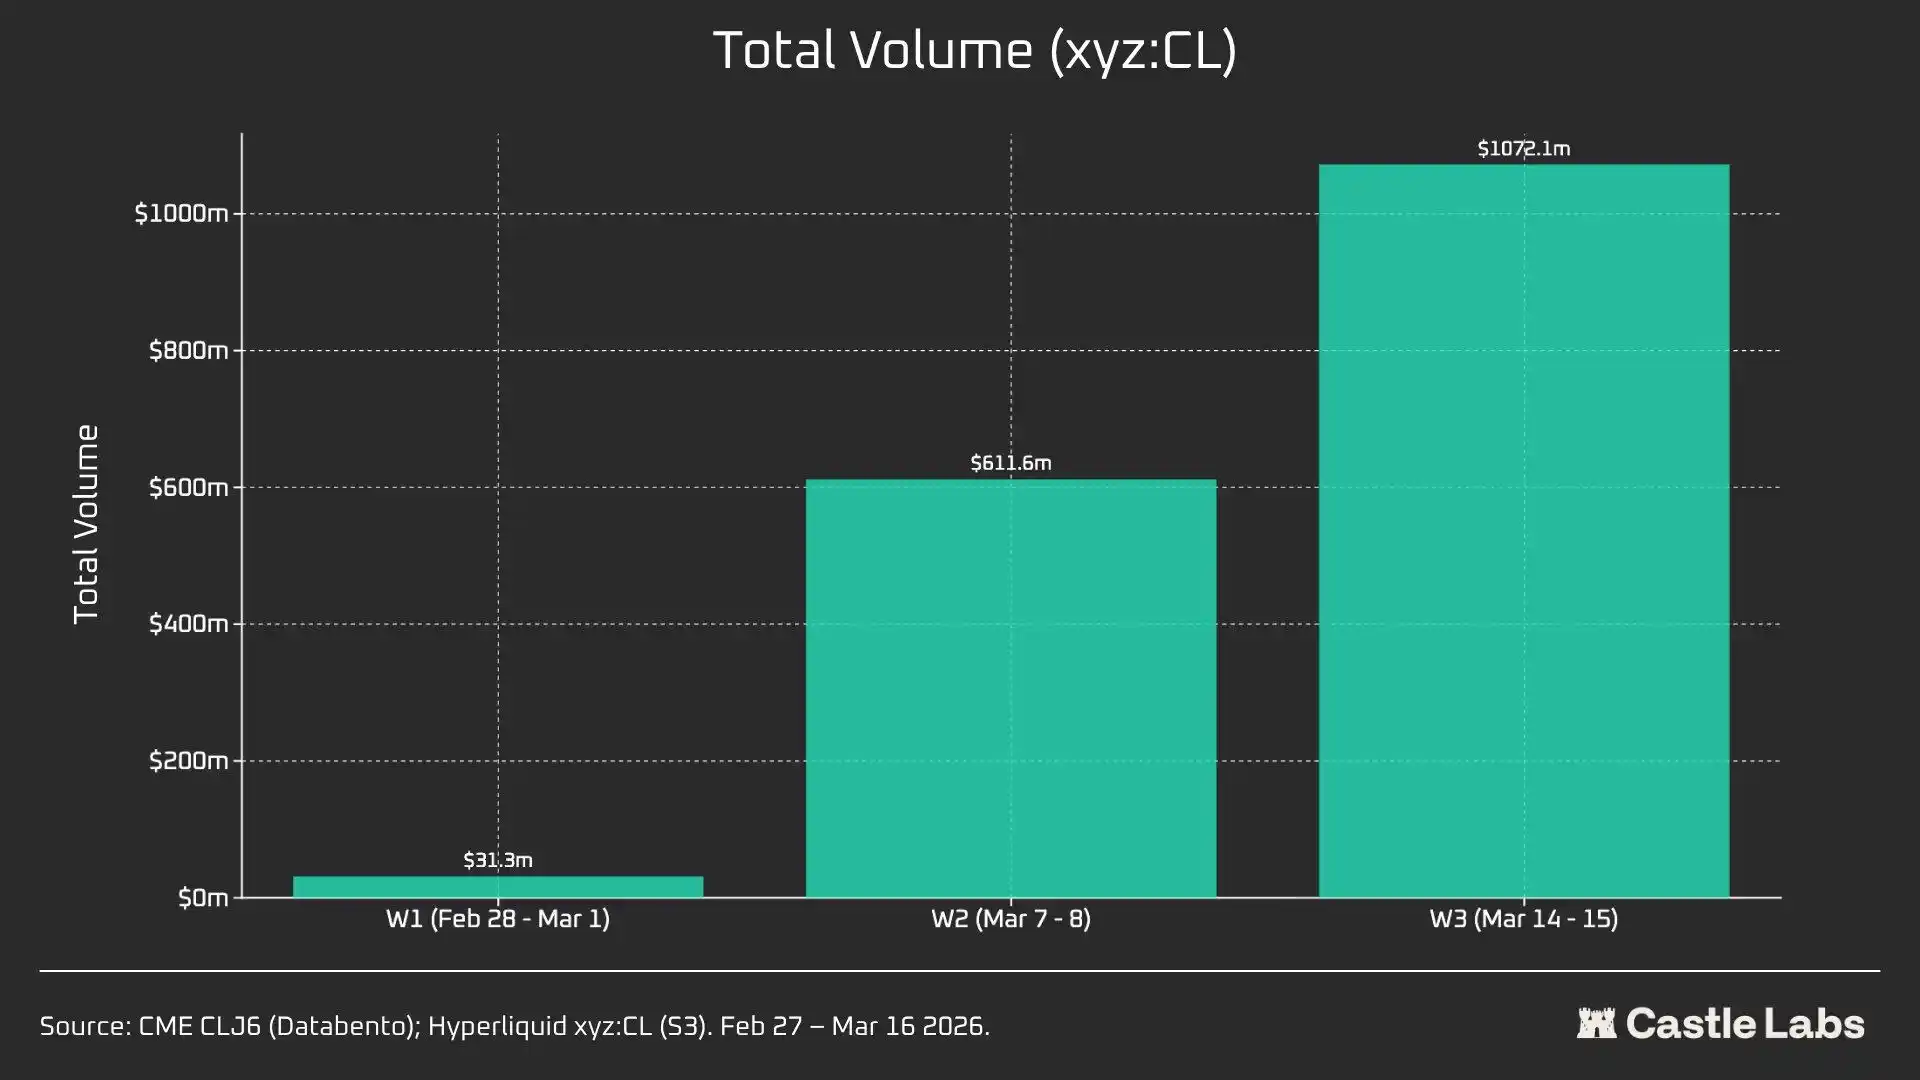
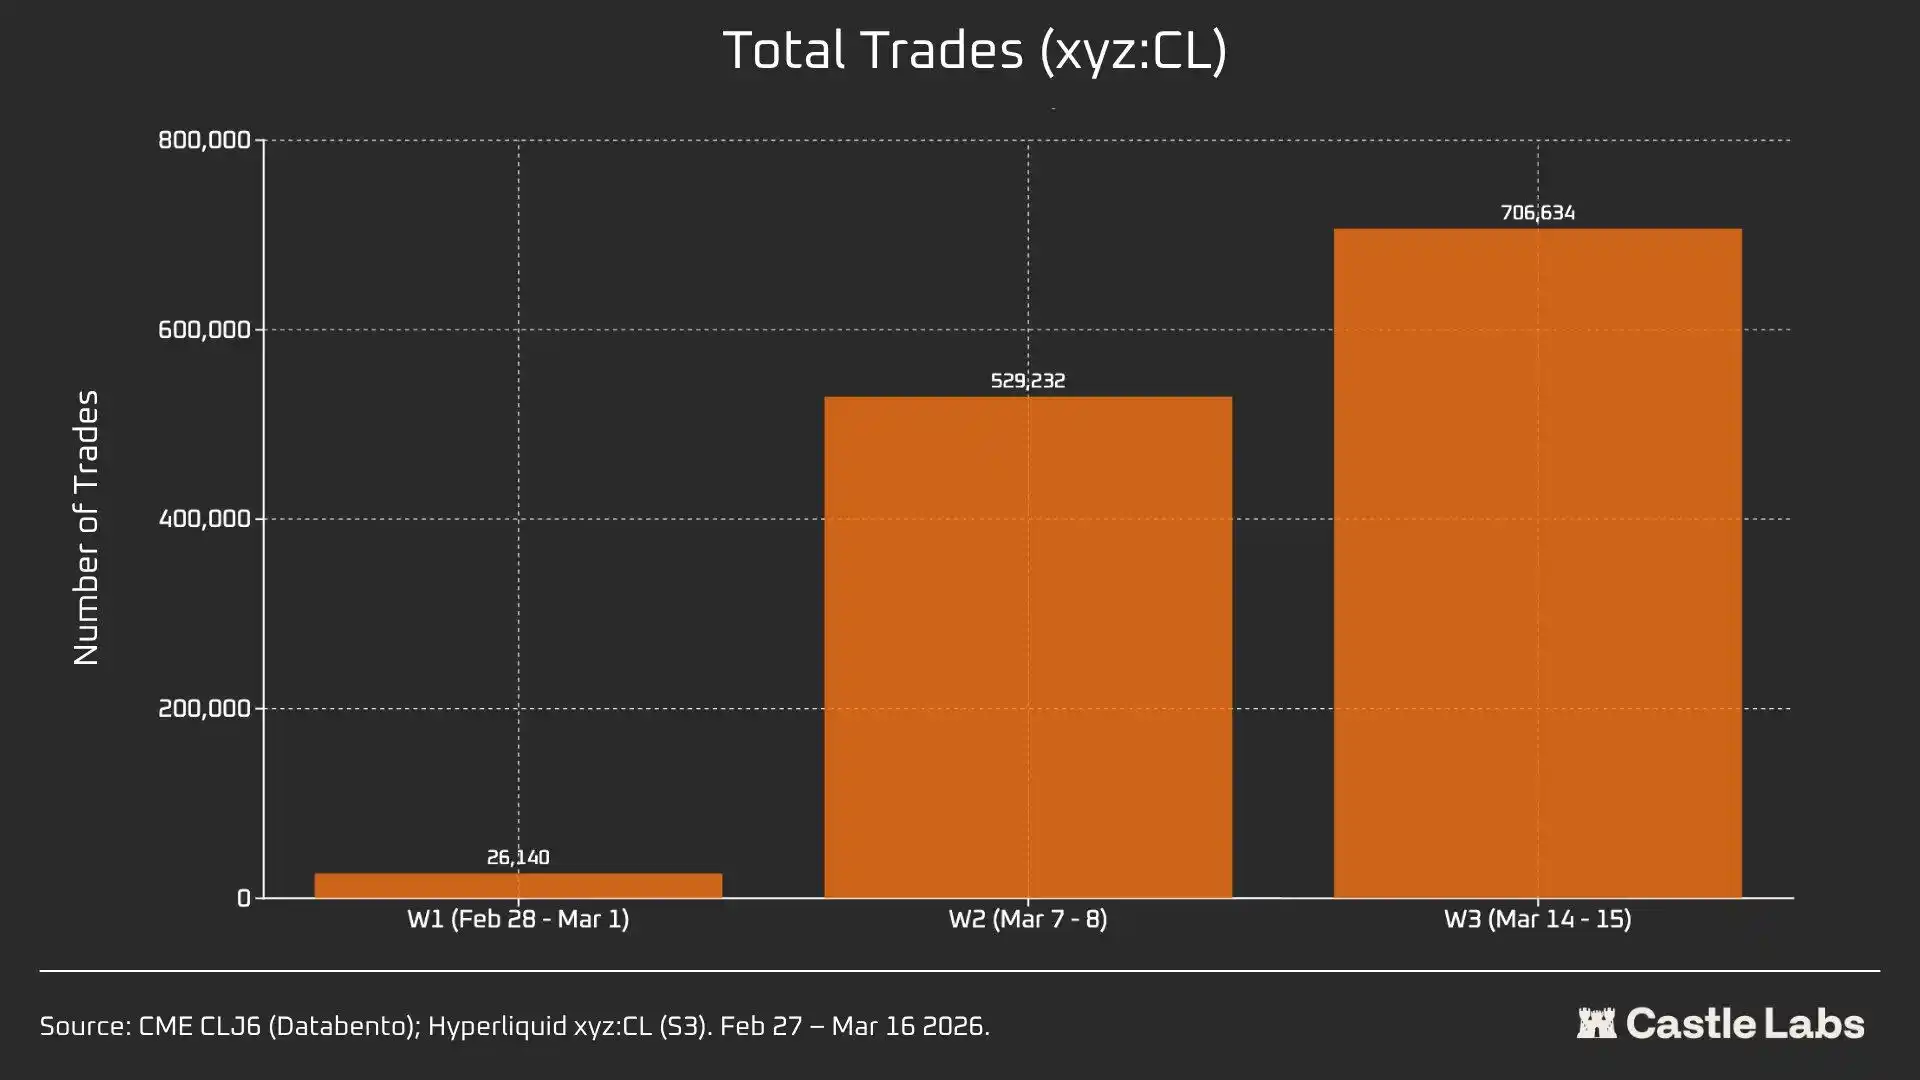
We also provide other metrics for the weekend summary analysis, including trading volume, total number of trades, and average trade size. These metrics vary across weekends and have shown consistent growth over multiple weekends.
xyz: The total trading volume of the CL market has grown from $31 million to over $1 billion in three weeks, reflecting an increase in the number of users and the market's ultimate maturation.
Furthermore, the total number of trades has increased from 26,000 on the first weekend to over 700,000 by the third weekend.
Notably, the average trade size over the weekend has actually grown from the median we previously mentioned to $534. All three weekends have seen the same growth trend, which may indicate more institutional funds flowing into the market.
The average trade size on the first weekend was $1,199, growing to over $1,500 by the third weekend.
This may indicate a different user base using the platform over the weekends, with fewer retail users and more traders needing crude oil exposure ahead of Monday, so weekend trading is closer to hedging demand rather than speculation.
Welcome to join the official BlockBeats community:
Telegram Subscription Group: https://t.me/theblockbeats
Telegram Discussion Group: https://t.me/BlockBeats_App
Official Twitter Account: https://twitter.com/BlockBeatsAsia