Quantitative Analysis Predicts the Market, Why Do Moonboys Become Rekt?
Original Article Title: The Microstructure of Wealth Transfer in Prediction Markets
Original Article Author: Jonathan Becker
Original Article Translation: SpecialistXBT, BlockBeats
Editor's Note: The author has meticulously dissected how retail traders' irrational preference between "longshot outcomes" and "certainty outcomes" has led to the emergence of an "optimism tax." This is not just a hardcore analysis of market microstructure, but also a pitfall guide that every prediction market participant should be wary of.
Below is the original content:
A slot machine on the Las Vegas Strip, returning approximately 93 cents for every $1 wagered. This is widely considered one of the worst odds games in gambling. However, on the CFTC-regulated prediction market Kalshi, traders have wagered substantial amounts on "longshot" contracts with historical returns as low as returning only 43 cents per dollar. Tens of thousands of participants willingly accept an expectation value much lower than a casino slot machine just to bet on their beliefs.
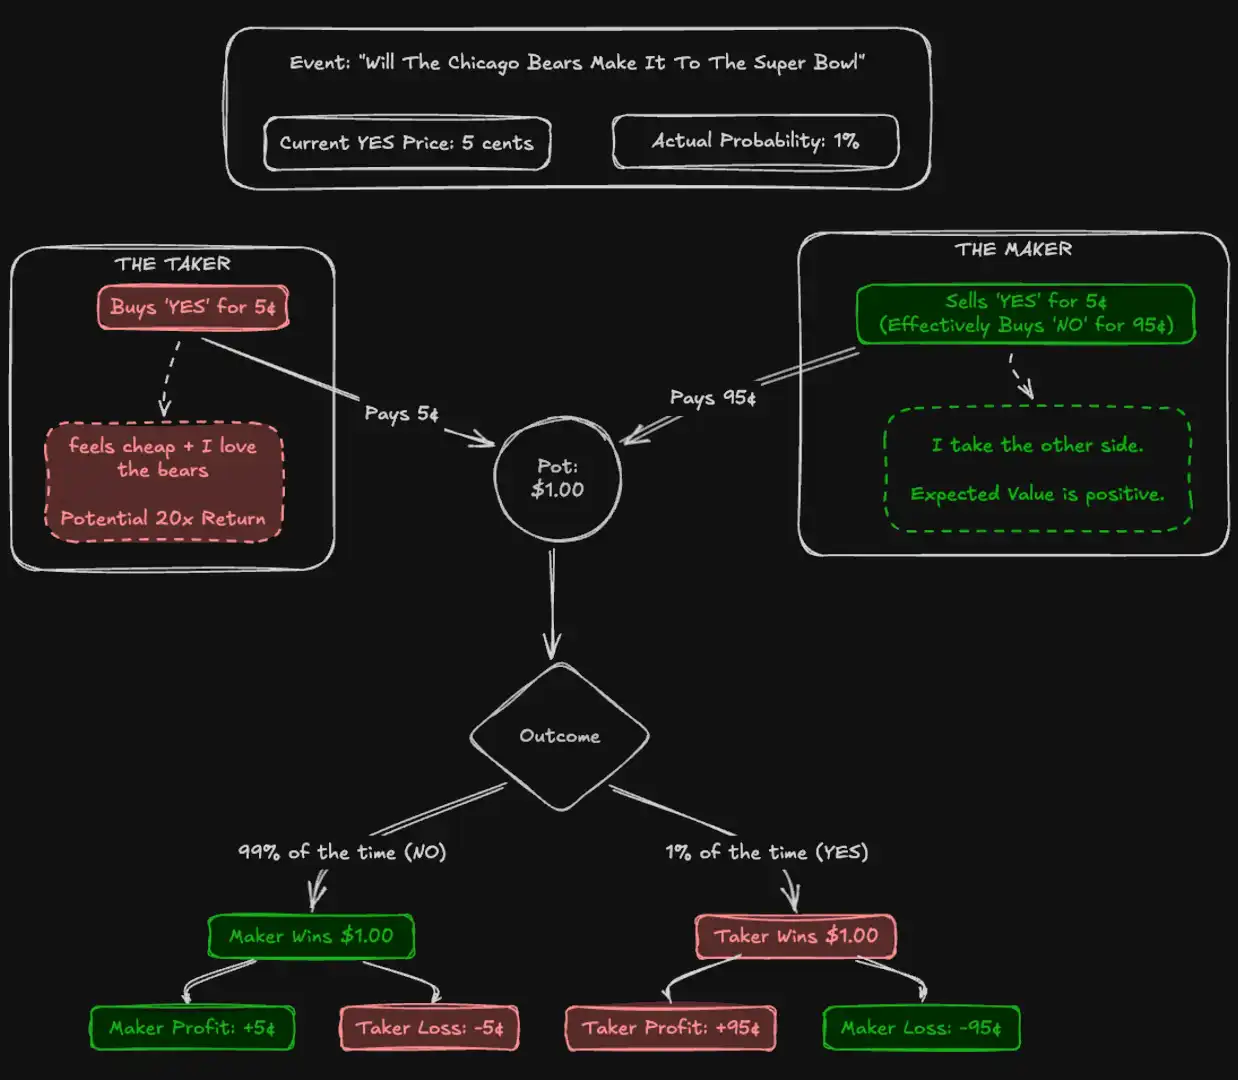
The Efficient Market Hypothesis posits that asset prices should perfectly aggregate all available information. In theory, a prediction market provides the purest test for this theory. Unlike stocks, there is no ambiguity in the intrinsic value of a prediction market: a contract either pays $1 or does not. A price of 5 cents should precisely imply a 5% probability.
To test this efficiency, we analyzed 72.1 million trades covering $18.26 billion in trading volume. Our findings suggest that the accuracy of the crowd relies less on rational actors and more on a mechanism of "harvesting mistakes." We documented a systemic wealth transfer: impulsive takers pay a structural premium for the affirmative "YES" outcome, while makers capture an "optimism tax" solely by selling contracts into this biased flow of funds. This effect is most pronounced in high-engagement categories such as sports and entertainment, while in low-engagement categories such as finance, the market approaches near perfect efficiency.
Contributions of This Article
This article makes three contributions.
First, it confirms the presence of a "high-risk bet bias" on Kalshi and quantifies its magnitude at different price levels.
Second, it decomposes returns by market role, revealing a continuous wealth transfer from liquidity takers to liquidity providers being driven by asymmetric order flow.
Third, it identifies a “YES/NO Asymmetry,” whereby liquidity takers disproportionately favor affirmative bets on high-risk propositions (low-probability prices), exacerbating their losses.
Prediction Markets and Kalshi
A prediction market is an exchange where participants trade binary contracts on real-world outcomes. These contracts settle at either $1 or $0, with prices ranging from 1 to 99 cents as a proxy for probability. Unlike stock markets, prediction markets are a strict zero-sum game: every dollar of profit corresponds to exactly one dollar of loss.
Launched in 2021, Kalshi is the first CFTC-regulated prediction market in the United States. The platform initially focused on economic and weather data and remained niche until 2024. Following a legal battle with the CFTC and securing the right to list political contracts, the 2024 election cycle triggered explosive growth. The introduction of sports markets in 2025 currently dominates trading activity. The trading volume distribution across categories is highly uneven: sports account for 72% of nominal trading, followed by politics (13%) and cryptocurrency (5%).
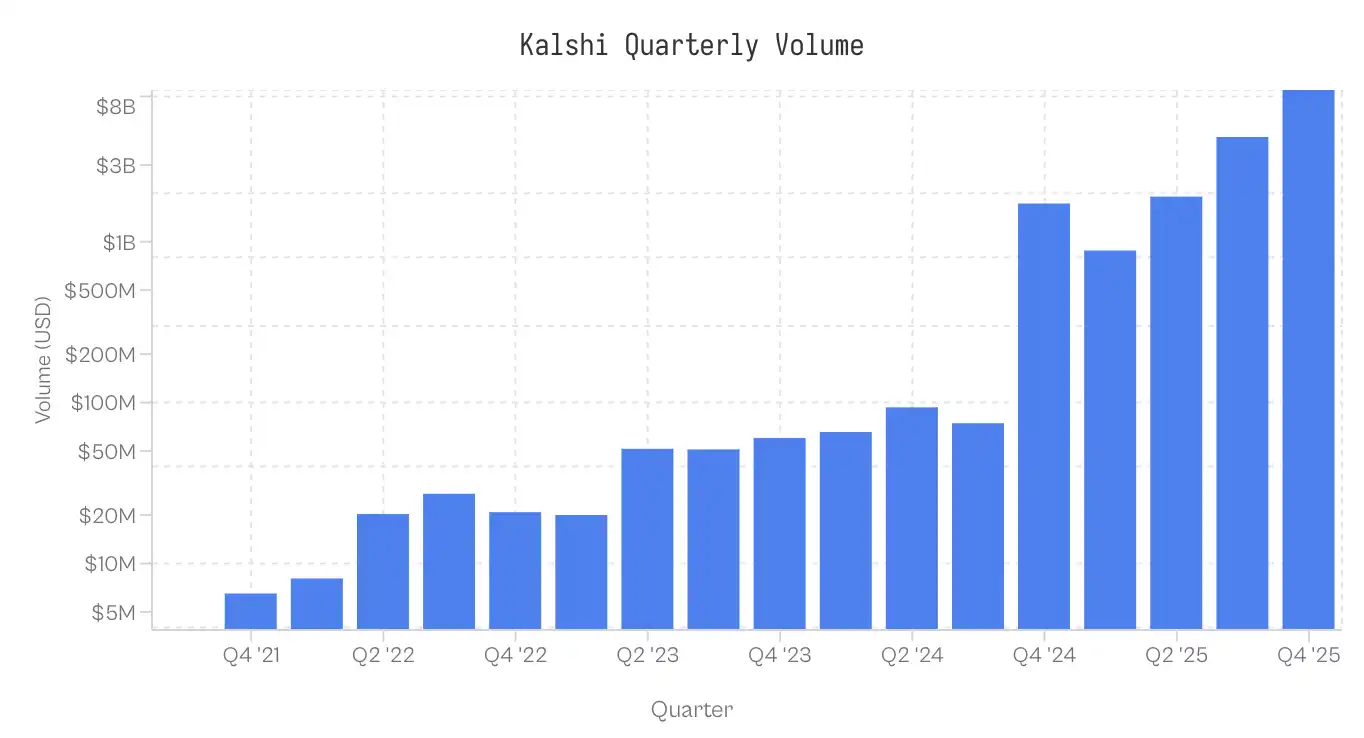
Note: Data is current as of November 25, 2025, 5:00 PM ET; data for Q4 2025 is incomplete.
Data and Methodology
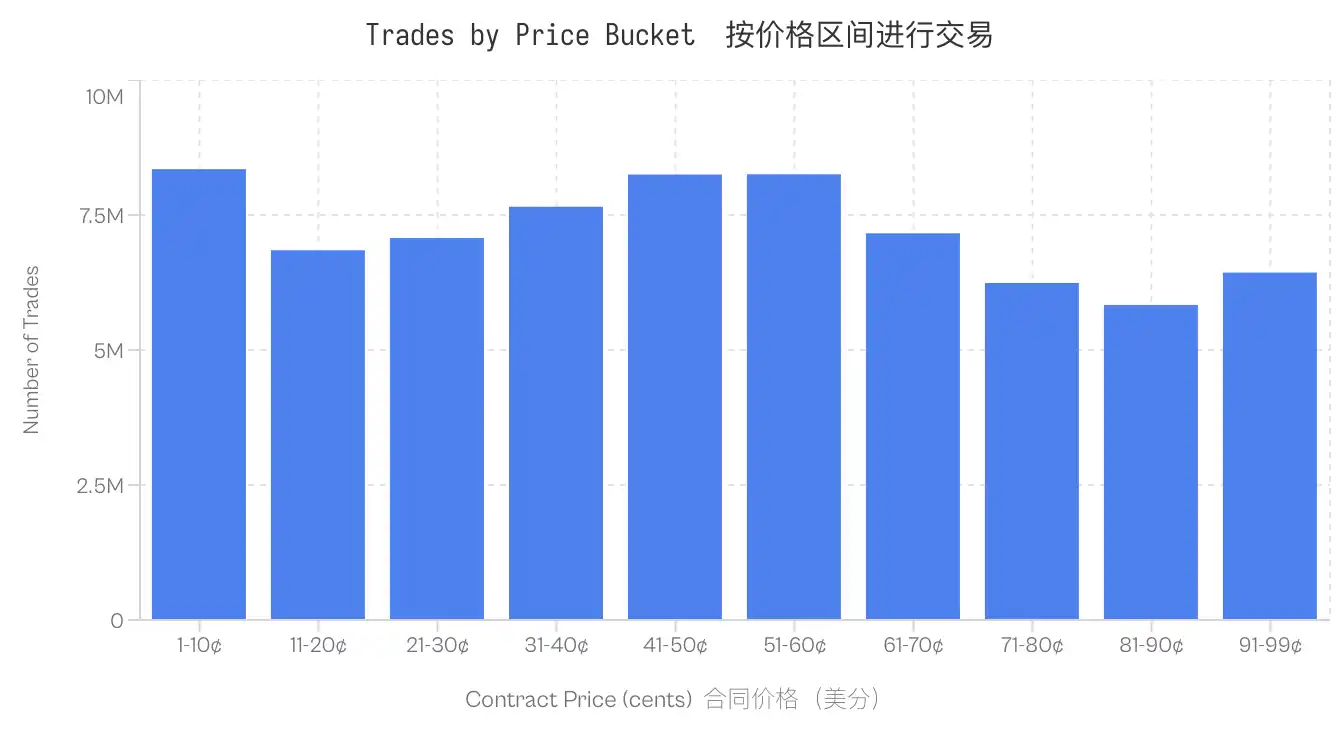
The dataset includes 7.68 million markets and 72.10 million trades. Each trade records the execution price (1-99 cents), the liquidity-taking side (yes/no), contract quantity, and timestamp.
Role Assignment: Each trade identifies the liquidity consumer (liquidity taker). The liquidity provider takes the opposite side. If taker_side = yes and the price is 10 cents, it means the liquidity taker buys YES at 10 cents; the liquidity provider buys NO at 90 cents.
Cost Basis (Cb): To compare the asymmetry between YES and NO contracts, all trades are standardized by risk capital. For a standard YES trade at 5 cents, Cb=5. For a 5-cent NO trade, Cb=5. Unless otherwise specified, the “price” referred to in this document refers to this cost basis.
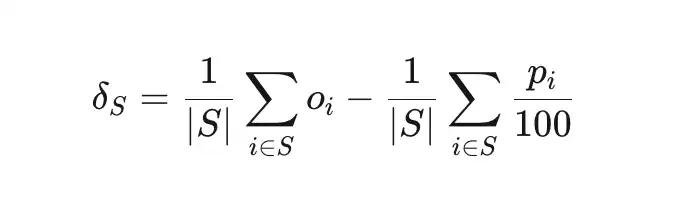
Price Dislocation (δS) measures the deviation between the actual success rate of a set of trades S and the implied probability.
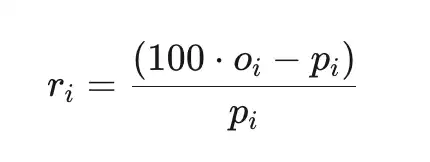
Total Excess Return (ri) is the return relative to cost (pre-platform fees), where pi is the price in cents, and oi ∈ {0,1} is the outcome.
Sample
Calculations are based only on settled markets. Voided, delisted, or still-open markets are excluded. Additionally, markets with a nominal trading volume less than $100 are excluded. The dataset remains robust across all price levels; even the least active trading range (81-90 cents) consists of 5.8 million trades.
Longshot Bias on Kalshi
The Longshot Bias was first documented by Griffith (1949) in horse racing and later formalized by Thaler & Ziemba (1988) in an analysis of pari-mutuel betting markets. It describes the tendency of bettors to pay too high a price for low-probability outcomes. In an efficient market, a contract priced at p cents should have roughly a p% chance of winning. In markets with a Longshot Bias, the low-priced contracts have a lower win rate than their implied probability, while high-priced contracts have a higher win rate than the implied probability.
Kalshi's data confirms this pattern. A contract trading at 5 cents has a mere 4.18% win rate, implying a -16.36% Price Dislocation. Conversely, a contract at 95 cents has a win rate of 95.83%. This pattern is consistent: all contracts priced below 20 cents perform below their odds, while contracts above 80 cents outperform their odds.
Note: Despite this bias, the calibration curve shows that the prediction market is actually quite efficient and accurate, with slight exceptions only in the tails (very low or very high prices). The close alignment of implied and actual probabilities confirms that the prediction market is a well-calibrated price discovery mechanism.
The existence of the Longshot Bias raises a zero-sum market-specific issue: if some traders systematically overpay, then who captures the remaining value?
Order Book Imbalance: Wealth Transfer between Makers and Takers
The Return Decomposition by Role in Market Microstructure defines two groups based on participants' interaction with the order book. Makers provide liquidity by placing resting limit orders on the order book. Takers consume liquidity by executing against existing orders. The return decomposition by role reveals a significant asymmetry:
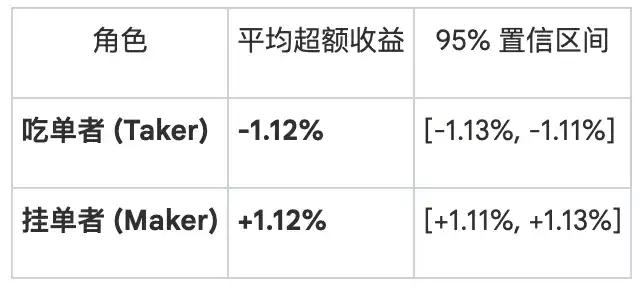
This asymmetry is most pronounced in the tail. For a 1-cent contract, the taker win rate is only 0.43% (implied probability of 1%), corresponding to a -57% mispricing. The maker win rate for the same contract is 1.57%, with a +57% mispricing. At 50 cents, the mispricing is compressed; takers show -2.65%, and makers show +2.66%. Across 80 of the 99 price levels, takers exhibit negative alpha, while makers display positive alpha at the same 80 levels.
The overall misalignment of the market concentrates on specific groups: takers incur losses, and makers capture gains.
Is This Just Bid-Ask Spread Compensation?
An apparent counterargument is that makers earn the bid-ask spread as compensation for providing liquidity. Their positive return may simply reflect spread capture rather than capitalizing on biased order flow.
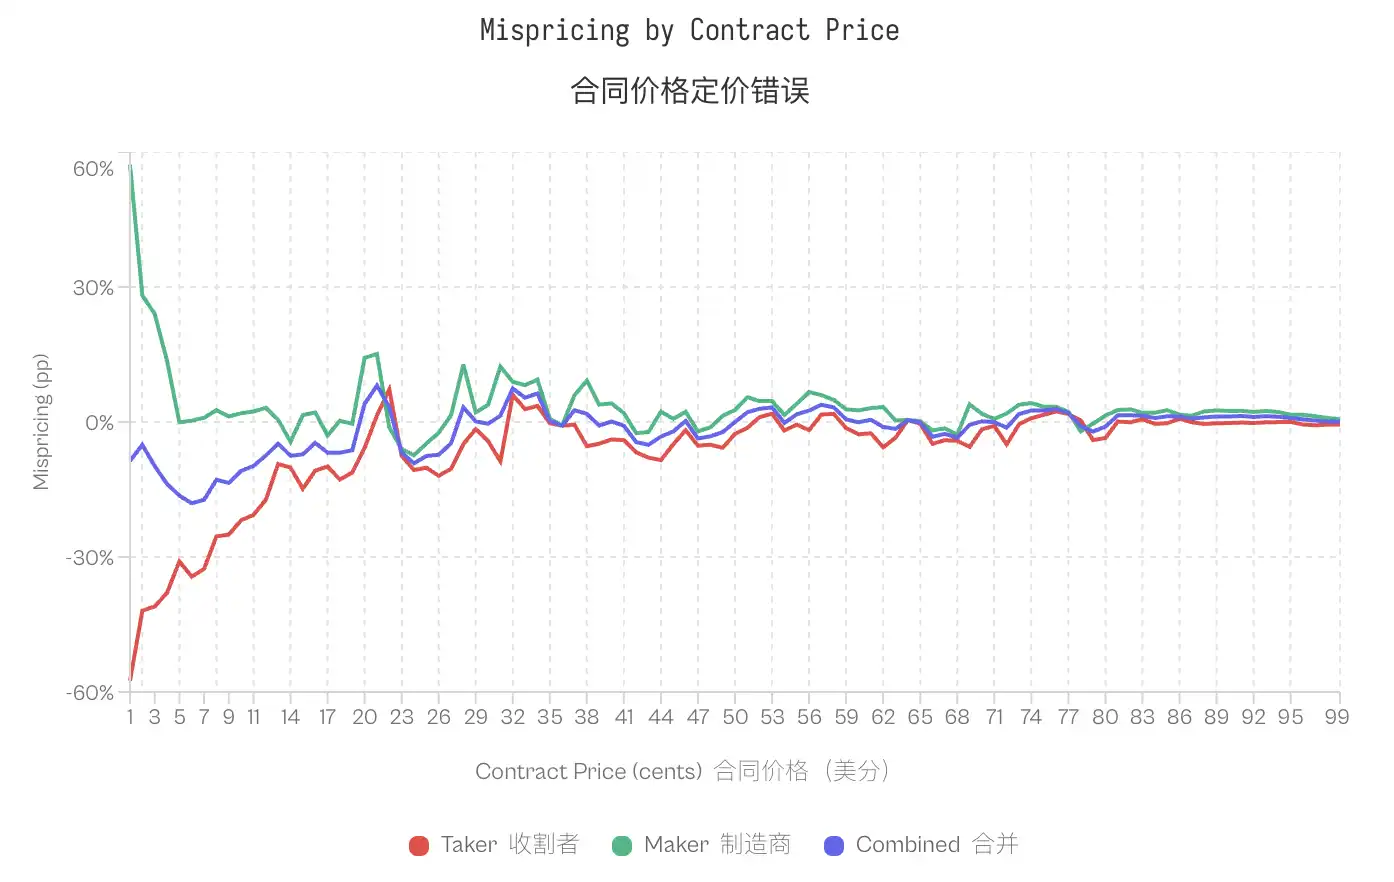
While this may seem plausible, two empirical findings suggest otherwise. First, makers' returns depend on the direction they take. If profits were purely based on the spread, whether makers buy YES or NO should be irrelevant.
We test this by decomposing maker performance by position direction:
Makers who buy NO outperform makers who buy YES 59% of the time.
The weighted excess return for makers buying YES is +0.77%, while for makers buying NO, it is +1.25%. The difference between the two is 0.47 percentage points. While this effect is minimal (Cohen's d = 0.02-0.03), it is consistent.
At the very least, this indicates that spread capture is not the sole reason.
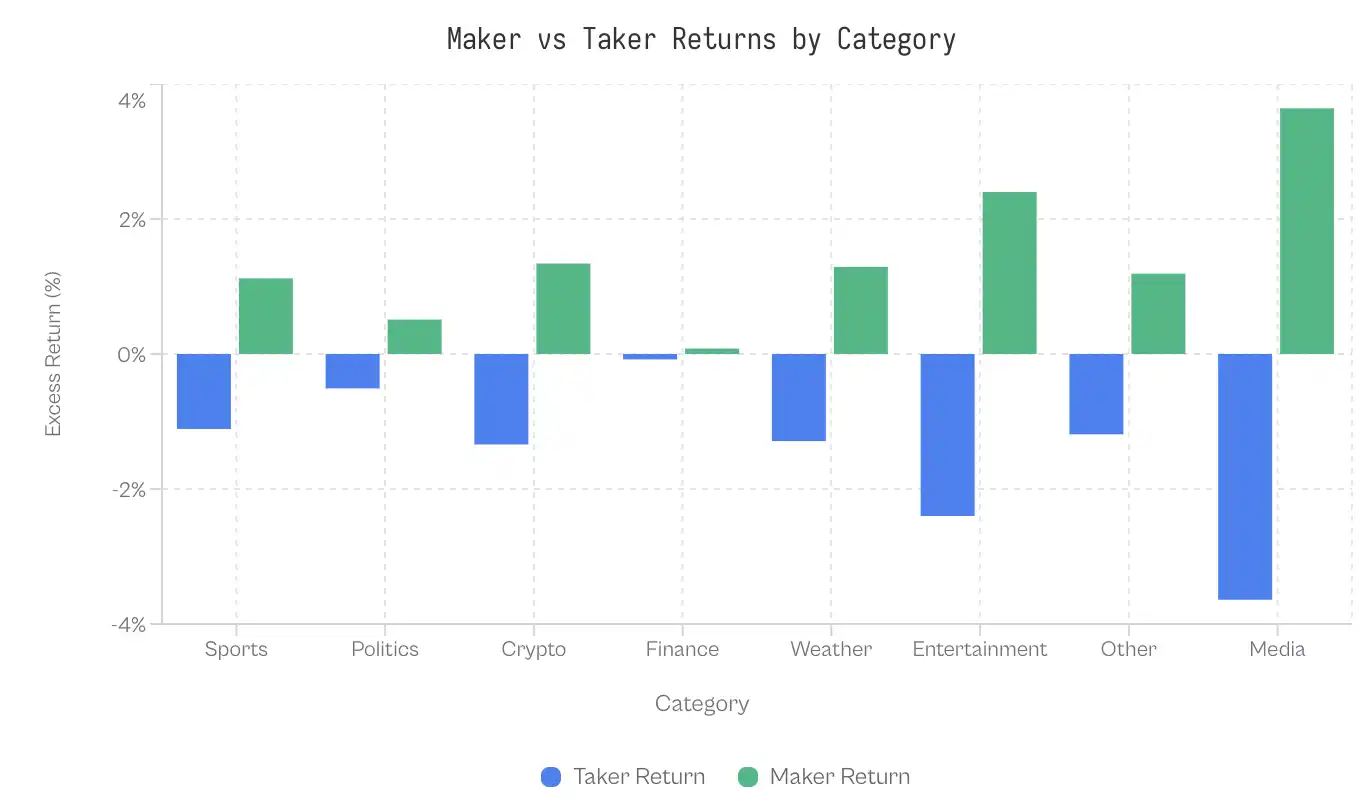
Differences Across Market Categories
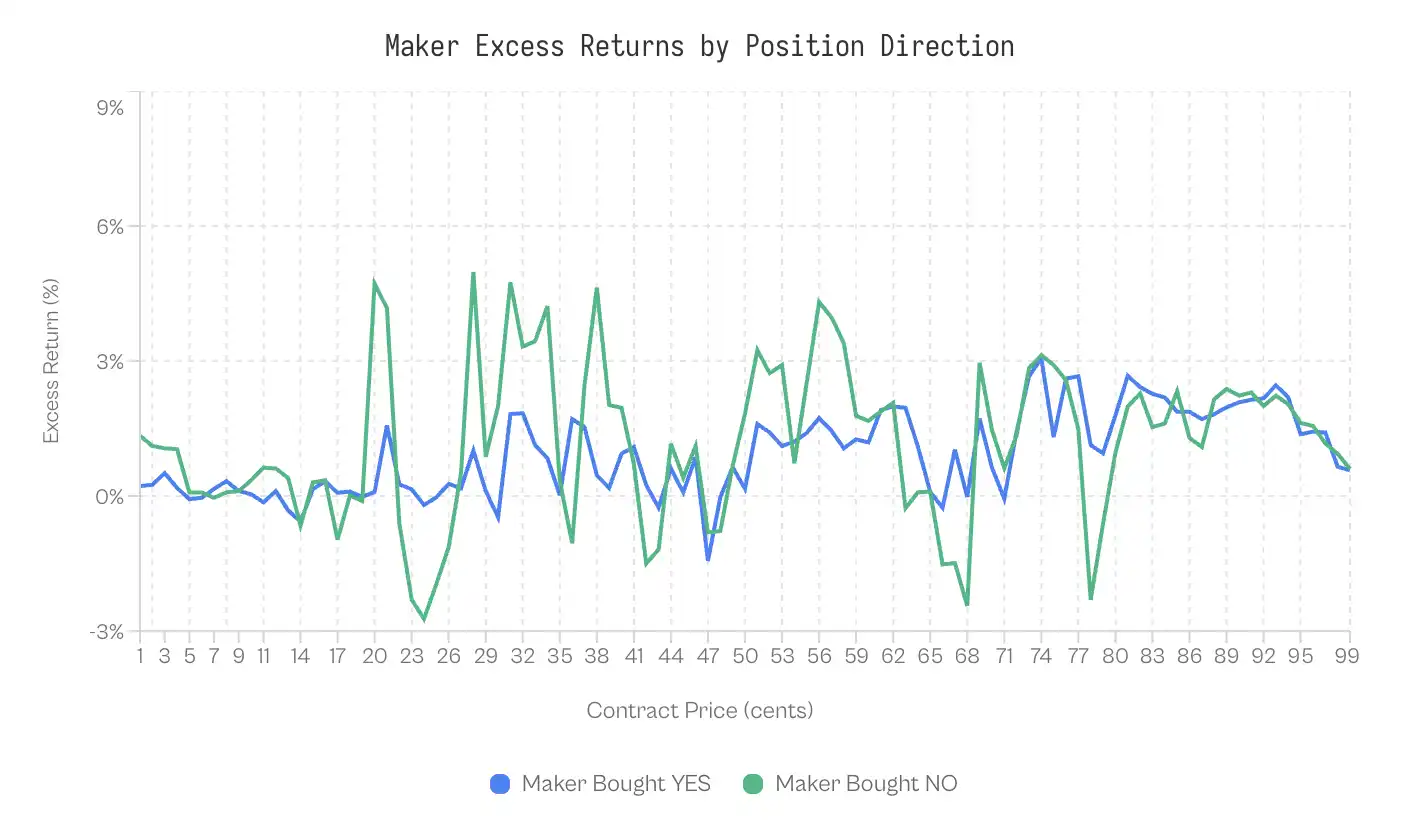
If a lack of understanding of the market's irrational demand has led to a bias, then categories attracting less mature participants should exhibit a larger gap. The data is staggering: the Finance category shows only a 0.17 percentage point gap; the market is highly efficient.
On the other end, the gap between world events and media exceeds 7 percentage points. Sports, as the category with the highest trading volume, shows a moderate gap of 2.23 percentage points. With a total order flow of $6.1 billion, even this moderate gap has resulted in significant wealth transfer.
Why is the Finance category so efficient? One possible explanation is participant selection; financial issues attract traders who think in terms of probability and expected value, rather than fans betting on their home team. The problem itself is quite mundane (e.g., "Will the S&P Index close above 6000 points?"), which filters out emotional bettors.
The Evolution of Taker and Maker
The gap between makers and takers is not an inherent feature of the market; it has emerged with the platform's development. In the early days of Kalshi, the pattern was the opposite: takers enjoyed positive alpha, while makers suffered losses.
From inception to 2023, takers averaged a +2.0% return, while makers were at -2.0%. With no mature counterparties, takers were winning; amateur makers defined the early stage and became the losers.
This situation began to reverse in the second quarter of 2024 and saw a sharp expansion post-2024 elections.
The inflection point coincided with two events: Kalshi winning political contract approval from the CFTC in October 2024, and the subsequent 2024 election cycle. Trading volume surged from $30 million in Q3 2024 to $820 million in Q4. New capital attracted seasoned market makers, along with the extraction of value from the taker flow.
Pre-election, the average gap was -2.9 pp (takers winning); post-election, it flipped to +2.5 pp (makers winning).
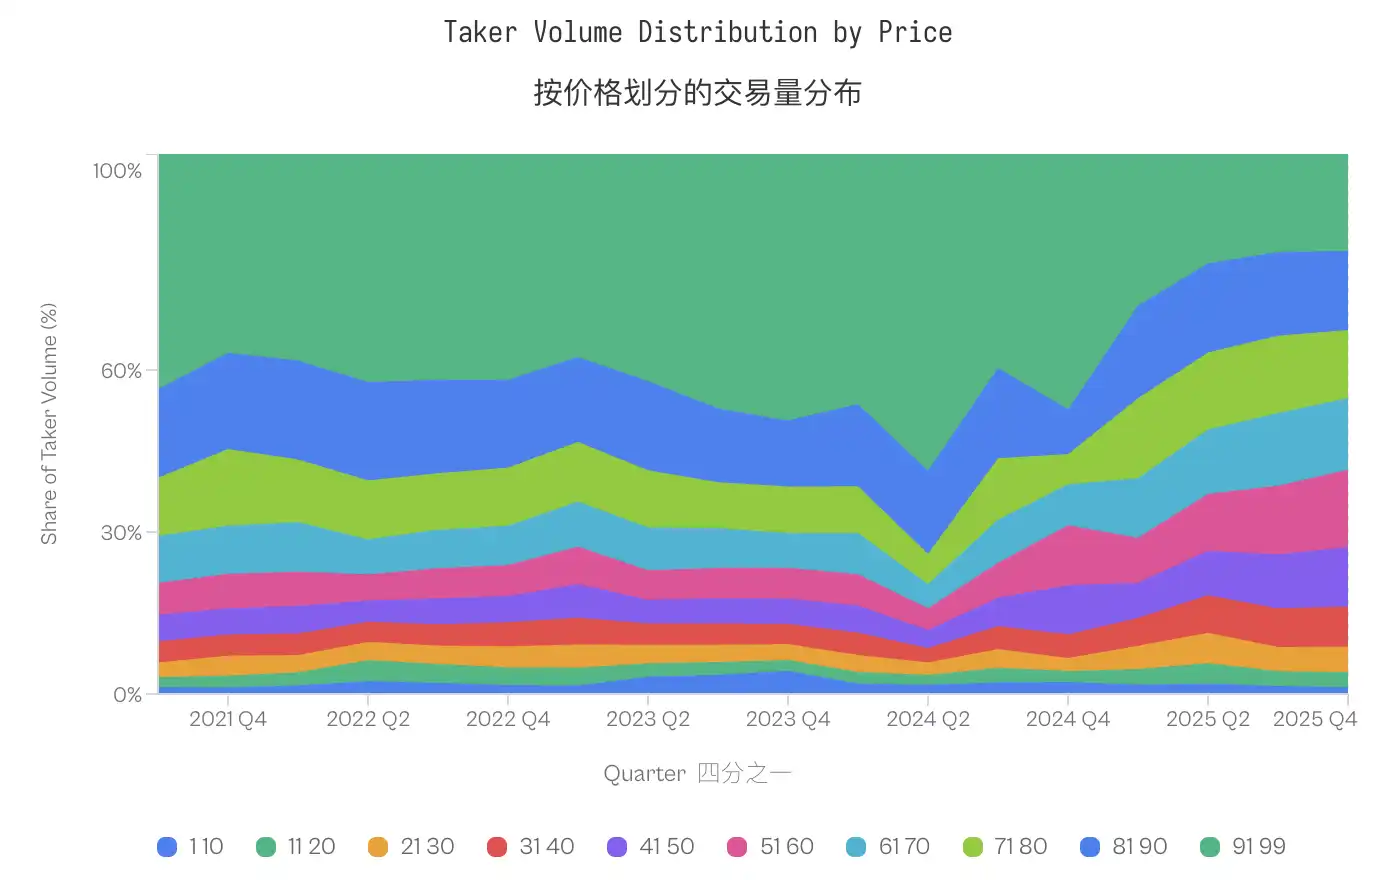
The trading volume share of low-probability contracts (1-20 cents) remained relatively stable, at 4.8% pre-election and 4.6% post-election. However, the distribution actually shifted towards mid-range prices; the share of contracts at 91-99 cents decreased from 40-50% between 2021-2023 to less than 20% in 2025, while mid-range contracts (31-70 cents) saw a significant increase.
The behavior of the taker has not become more extreme (the share of low-probability contracts has even slightly decreased), but their losses have increased.
This evolution has reshaped the overall outcome. The transfer of wealth from traders to liquidity providers is not an inherent feature of predicting market microstructure; it requires mature liquidity providers, and mature liquidity providers need sufficient trading volume to prove the rationality of their participation.
In the early stages of low volume, liquidity providers were likely inexperienced individuals who lost to relatively informed traders.
The surge in trading volume attracted professional liquidity providers who could extract value from the trader's flow at all price points.
YES/NO Asymmetry
The breakdown of maker-taker determines who absorbs the loss but leaves the question of how to operate. Why is the pricing of the taker flow always wrong? The answer does not lie in the exceptional predictive power of the maker but in the taker's expensive preference for affirmative outcomes.
Asymmetry at Equal Prices
The standard efficiency model suggests that, at the same price, the pricing deviation of different contract types should be symmetric; theoretically, a 1-cent "yes" contract and a 1-cent "no" contract should reflect similar expected returns.
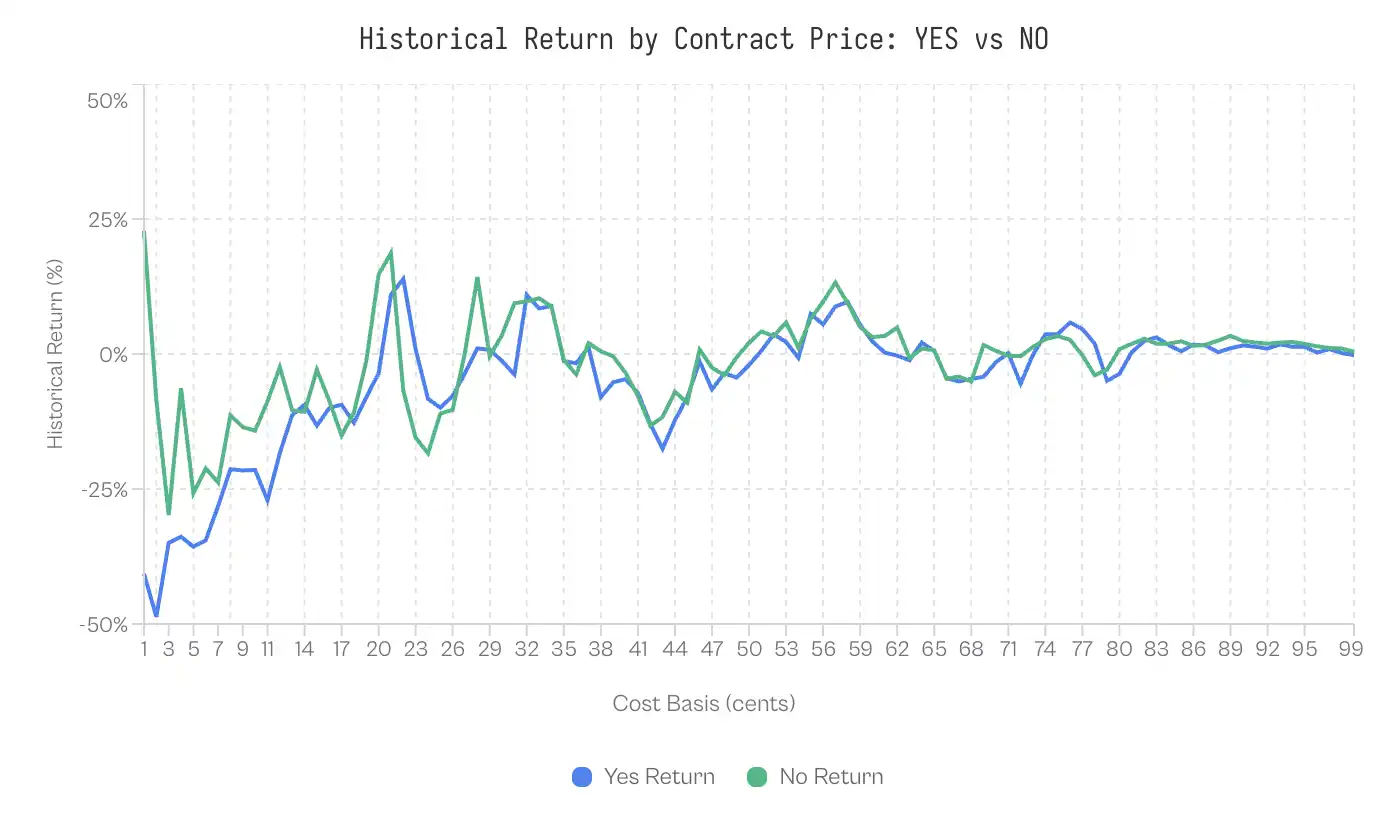
However, the data contradict this. At a price of 1 cent, the historical expected return of "YES" is -41%; YES buyers expect to lose nearly half of their principal. In contrast, the historical expected return for a 1-cent "NO" contract is +23%. The difference between these two seemingly identical probability estimate values is as high as 64 percentage points.
The advantage of the NO contract persists. Out of 99 price levels, the NO contract outperforms the YES contract at 69 price levels, with the advantage mainly concentrated at market extremes. The NO contract can generate higher returns at each price increment from 1 cent to 10 cents and from 91 cents to 99 cents.
Although the market is a zero-sum game, the dollar-weighted return rate for "YES" buyers is -1.02%, while the dollar-weighted return rate for "NO" buyers is +0.83%, with a difference of 1.85 percentage points due to the overpricing of "YES".
Taker Preference for Affirmative Bets
The poor performance of YES contracts may be related to trader behavior. An analysis of trading data reveals structural imbalances in order flow composition.
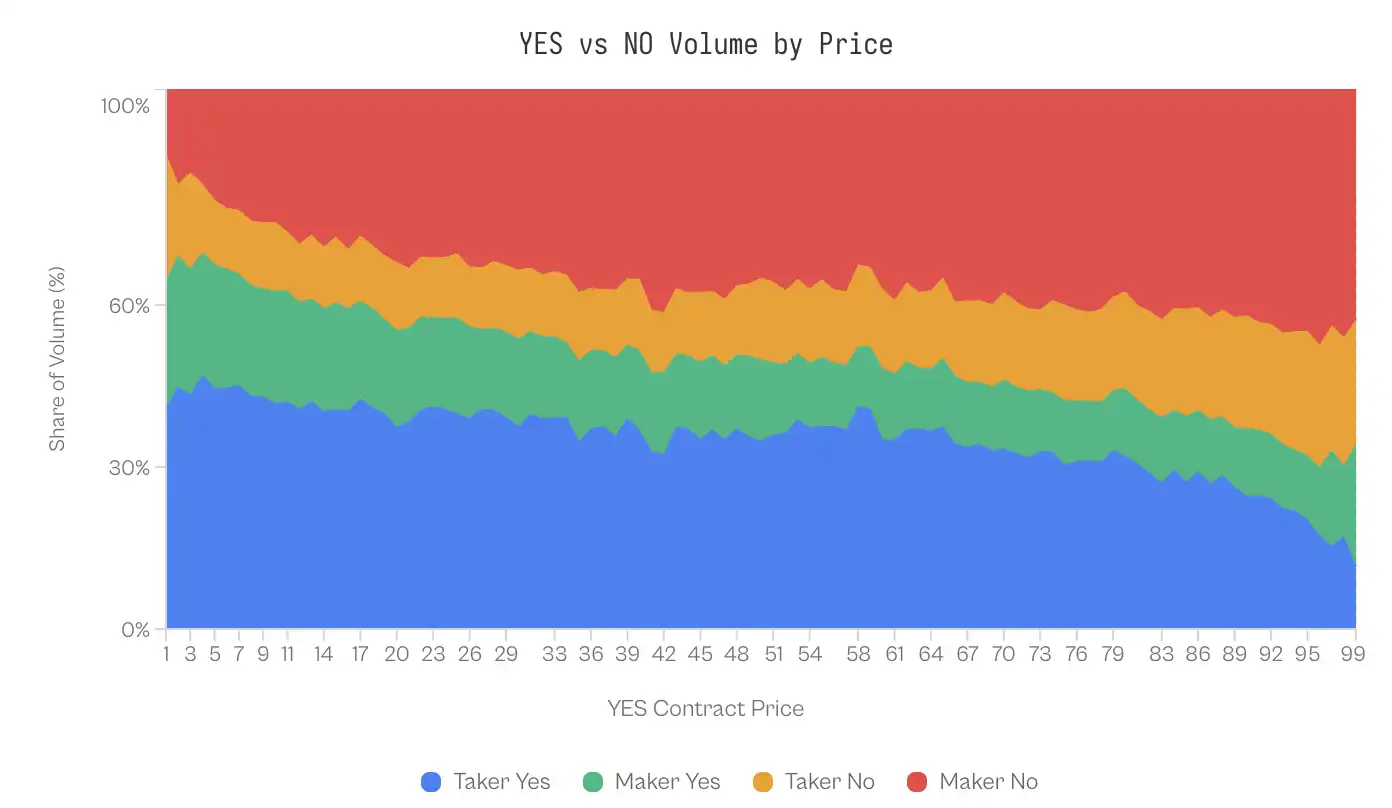
In the 1-10 cent range (where YES represents the underdog outcome), takers account for 41-47% of the YES volume, while makers comprise only 20-24%. This imbalance reverses at the other end of the probability curve. When the contract price is 99 cents (meaning NO is the 1-cent underdog), makers actively buy NO contracts, representing 43% of the volume, while takers account for only 23%.
One might assume that market makers take advantage of this asymmetry, profiting from a more accurate directional prediction ability — in other words, knowing when to buy NO. However, evidence does not support this assumption.
When dissecting the performance of market makers by position direction, the returns are nearly identical. Statistically significant differences only appear in the extreme tails (1-10 cents and 91-99 cents), and even in these tails, the effect size is minimal (Cohen's d = 0.02-0.03).
This symmetry is significant: market makers do not profit by predicting directions but rather by a mechanism that applies equally to both directions.
Discussion
An analysis of 72.1 million transactions on the Kalshi platform revealed a unique market microstructure: wealth systematically transfers from liquidity takers to liquidity providers. This phenomenon is driven by specific behavioral biases, moderated by market maturity, and concentrated in categories that can trigger high emotional involvement.
Profit Taker’s Profit Extraction Mechanism
In a zero-sum market, do profit takers win through informational advantage (prediction) or structural advantage (market making)?
The data strongly support the latter.
When breaking down market maker returns by position direction, the performance gap is minimal: market makers buying "YES" obtain +0.77% excess return, while market makers buying "NO" obtain +1.25% excess return (Cohen's d ≈ 0.02).
This statistical symmetry suggests that market makers do not possess a significant ability to predict winners. Instead, they profit through structural arbitrage: providing liquidity to the cohort of takers who prefer high-risk, high-reward outcomes.
This extraction mechanism relies on an "optimism tax."
Despite low-probability "YES" performing 64 percentage points lower than low-probability "NO," traders disproportionately buy YES contracts at low-probability prices, accounting for nearly half of the total volume in that price range.
Therefore, liquidity providers do not need to predict the future; they just need to act as a counterparty to optimistic sentiment. This aligns with the findings of Reichenbach and Walther (2025) on Polymarket and Whelan (2025) on Betfair, indicating that in prediction markets, liquidity providers will offer a trading flow that adapts to this bias rather than making predictions.
Specialization of Liquidity
Between 2021 and 2023, despite the Longshot Bias, market makers were still able to achieve positive returns. The reversal of this trend in 2024 perfectly coincided with the surge in trading volume following Kalshi's legal victory in October 2024.
The wealth transfer observed by the end of 2024 was a function of market depth. In the early stages of the platform, low liquidity hindered the entry of sophisticated algorithmic market makers. The massive trading volume post-2024 election incentivized the entry of professional liquidity providers, who could systematically capture spreads and exploit biased fund flows.
Differences Between Markets
The order book spread differential across different categories reveals how participant curation shapes market efficiency.
• Financial (0.17 pp): Acting as a benchmark, proving that prediction markets can be close to efficient. Questions such as "Will the S&P 500 close above 6000 points?" attract participants who think in terms of probability and expected value, who are likely also options traders or macroeconomic data followers. The barrier to informed participation is high, ordinary bettors have no edge, and they are likely aware of this, choosing to opt-out.
• Political (1.02 pp): Despite strong emotional factors, there is still some inefficiency in its predictions. Political bettors closely monitor polls and continually adjust their own judgments throughout the election cycle. This gap is larger than in financial markets but much smaller than in entertainment markets, indicating that political participants, despite the strong emotional aspect, do not completely lose their ability for probabilistic reasoning.
• Sports (2.23 pp): This category holds the largest share of trading volume in prediction markets. Despite a minor gap, considering the category's 72% volume share, this difference remains significant. Sports bettors exhibit some identifiable preferences, including home team loyalty, recency bias, and emotional attachment to star players. Fans betting on their supported team to win the championship are not calculating expected returns but buying hope.
• Cryptocurrency (2.69 pp): Attracting participants heavily influenced by the retail "price is going up" mentality, this segment overlaps with meme traders and NFT speculators. Questions like "Will Bitcoin reach $100,000?" tend to attract bets based more on narrative than probability estimation.
• Entertainment, Media, and World Events (4.79–7.32 pp): These areas exhibit the greatest cognitive gap and share a common feature: people perceive a very low threshold of expertise in their own knowledge. Anyone interested in celebrity gossip feels entitled to predict award ceremony outcomes; anyone reading a news headline feels they understand geopolitics. This leads to a participant group confusing familiarity with judgment.
Our research suggests that market efficiency depends on two factors: the technical threshold of informed participation and the extent to which market-induced issues trigger emotional reasoning.
When the market threshold is high and the framework remains objectively calm, market efficiency approaches an ideal state; when the threshold is low and the framework encourages narrative, the optimism effect peaks.
Limitations
While the data used in the study is reliable, there are still some limitations.
First, due to a lack of unique trader IDs, we can only rely on "market maker/taker" categorization to represent "sophisticated/unsophisticated" traders. Although this is standard practice in microstructure literature, it does not perfectly capture cases where sophisticated traders engage in cross-trading using time-sensitive information.
Second, we cannot directly observe bid-ask spreads from historical trading data, making it challenging to entirely differentiate spread capture from order flow exploitation behavior.
Lastly, these results are only applicable to the U.S. regulatory environment; offshore exchanges with different leverage caps and fee structures may exhibit different dynamics.
Conclusion
The promise of prediction markets lies in their ability to aggregate diverse information into a single, accurate probability.
However, our analysis of Kalshi indicates that this signal is often distorted by systematic wealth transfers being driven by human psychology and market microstructure.
The market is divided into two distinctly different groups: a maker class systematically overpaying for low-probability, affirmative outcomes and a taker class extracting this premium by passively providing liquidity.
When the subject is dry and quantifiable (such as finance), the market is efficient. When the subject allows for wishful thinking (such as sports, entertainment), the market transforms into a mechanism that transfers wealth from optimists to actuaries.
Welcome to join the official BlockBeats community:
Telegram Subscription Group: https://t.me/theblockbeats
Telegram Discussion Group: https://t.me/BlockBeats_App
Official Twitter Account: https://twitter.com/BlockBeatsAsia