A brief analysis of 12 types of volume and price behaviors in the fund-raising stage
Original author: yekoikoi
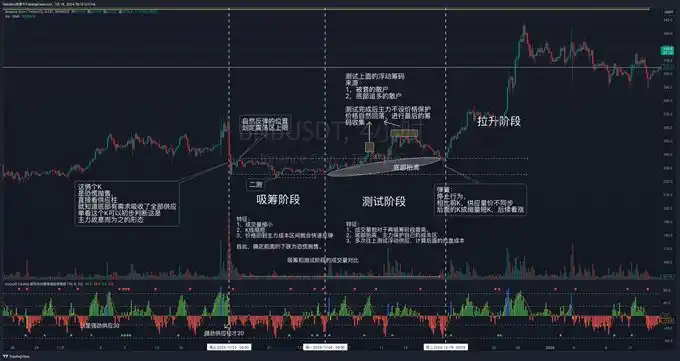
This is an advanced article. Previously, we have discussed the volume and price behavior of panic selling and SOS rebound. The sole purpose of panic selling is to absorb liquidity. Now, we will provide a complete explanation of the volume and price behavior of liquidity absorption. This is my secret weapon, which I am sharing with you for free. The full article is 2807 words long and comes with a detailed diagram. We recommend that you bookmark it and view it on a computer, reading the text and diagram side by side, as supply and demand determine the market.
Everyone please like, follow, share, and comment. Recently, it's been really tiring!
Recently, many targets have a feeling of re-raising funds in the late stage. After reading this, everyone can go and track the market themselves.
吸筹并不是一个简单的量价形态,标准的吸筹行为融合了很多量价行为,但是在「再吸筹」阶段,可能就会少很多行为,现在以最全面的量价行为去教学吸筹状态,小白直接看哈,可能会看不懂,收藏慢慢看。
Translation:Accumulation is not a simple volume-price pattern. Standard accumulation behavior integrates many volume-price behaviors, but in the "re-accumulation" stage, there may be fewer behaviors. Now, we teach the accumulation state with the most comprehensive volume-price behaviors. Beginners may not understand it at first glance, so feel free to save it and read it slowly.
The fundraising stage will include 12 types of volume and price behaviors:
1. Panic selling
2. Natural rebound
3. Second round of testing
4. Test upward floating supply.
5. Behavior of the spring
6. Ultimate Shock Warehouse
7. High volume support
8. Scope Narrowing
9. Strengthening of the support zone.
10. Convergent Triangle
11. Oscillation and Testing
12. Oscillating market.
Yesterday evening, a premature announcement was made in the group about MUBI, resulting in a 24% increase from 0.16 to 0.21. MUBI showed clear signs of accumulation and later initiation, with high support, floating supply testing, and shaking behavior. However, MUBI's cycle is relatively short, so not all forms of accumulation were fully included.
Now let's take the BNB 4-hour time period as an example of reading the disk. The panic selling and re-absorption of BNB260-220 is a classic case that is suitable for repeated study. He went through all the forms of absorption stages as much as possible. I started buying in the 220-230 range and you can search for the keyword "yekoi bnb" to view previous tweets.
I will briefly explain the description of all volume and price behaviors in the fundraising stage. Some of the volume and price behaviors have been taught before, and those that have not been taught will be explained separately in another post.
1. Panic Selling
This is usually the beginning of the absorption stage, marking the initial stage of the market range bottom formation (the impact of panic selling at different time periods is different, such as panic selling at the weekly level, and the time for bottoming and absorbing may take more than a month). In this stage, due to the extremely pessimistic market sentiment, investors will be eager to cut their losses and sell, leading to a sharp drop in prices. This kind of selling is usually accompanied by very high trading volume, and investors are crying everywhere, showing their positions and cutting their losses. The emotions of investors are very panicked, especially afraid of going to zero or losing a lot of money by cutting their losses too late. Panic selling usually ends after reaching an extreme point (that is, the previously mentioned stop behavior), at which point the market is severely oversold and all the chips of investors have been taken away by the main force.
2. Natural rebound
After panic selling, the market often experiences an automatic price rebound. This rebound indicates that supply is beginning to weaken and demand is entering the market. However, this demand is not provided by the main force, but rather comes from the rebound after the short position is closed out. The retail investors who cut their losses after the rebound will buy in again. The price of a natural rebound may not reach the previous high point, but it indicates that the market sentiment has changed. The price of the natural rebound high point will form a temporary resistance zone. The low point of panic selling and the high point of natural rebound form a range of oscillation, which will shake off the chips of the retail investors who are trying to buy the dip. It will also attract a group of short sellers to enter this range, providing fuel for subsequent rallies.
3. Secondary Testing
Welcome to join the official BlockBeats community:
Telegram Subscription Group: https://t.me/theblockbeats
Telegram Discussion Group: https://t.me/BlockBeats_App
Official Twitter Account: https://twitter.com/BlockBeatsAsia