On-chain data for the 25th week: The overall net position of the trading platform shows a large outflow, and market activity is average.

Original Title: "Peeping at Injured Cranes, Looking Up to See Spring | WTR 6.19"
Original Source: WatchToweR Research Institute
From June 12th to June 19th this week, the highest price of Bingtang Orange was around $26839, and the lowest was close to $24800, with a fluctuation range of about 8.14%.
Observing the chip distribution chart, there is a large volume of chips traded around 26,000, which will provide certain support or pressure.
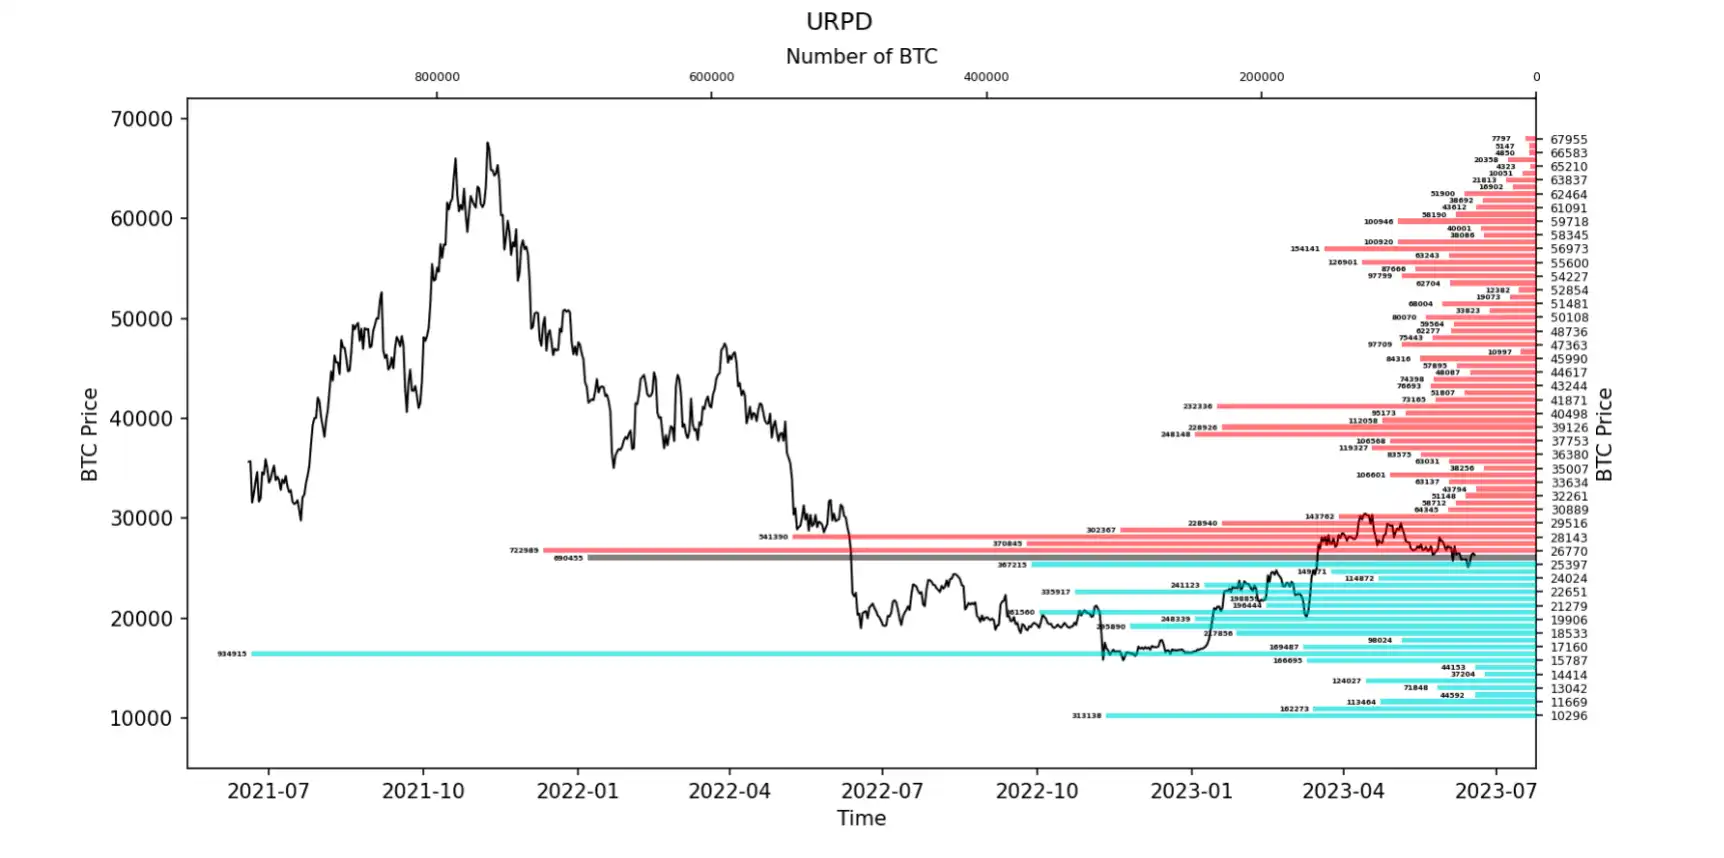
Analysis:
1. 24000 - 29000, approximately 3.23 million pieces.
2. 18500 - 23500, approximately 2.05 million pieces.
- The probability of not breaking below 18000~22000 in the short term is 65%.
- The probability of not breaking through 26500-29000 in the short term is 70%.
Long-term Insight: Used to observe our long-term situation; Bull market / Bear market / Structural change / Neutral state.:
Mid-term exploration: Used to analyze what stage we are currently in, how long this stage will last, and what situations we will face.
Short-term observation: Used to analyze short-term market conditions; as well as the possibility of certain directions and events occurring under certain conditions.
Long-term Insight
- Potential profit stamping percentage- Long-term inflation rate- Spot selling pressure
- High weight dumping
This week, the main focus is on researching and exploring the impact of the market on overall profits and the ability to withstand the impact on spot profits.
(Potential profit stamping percentage)
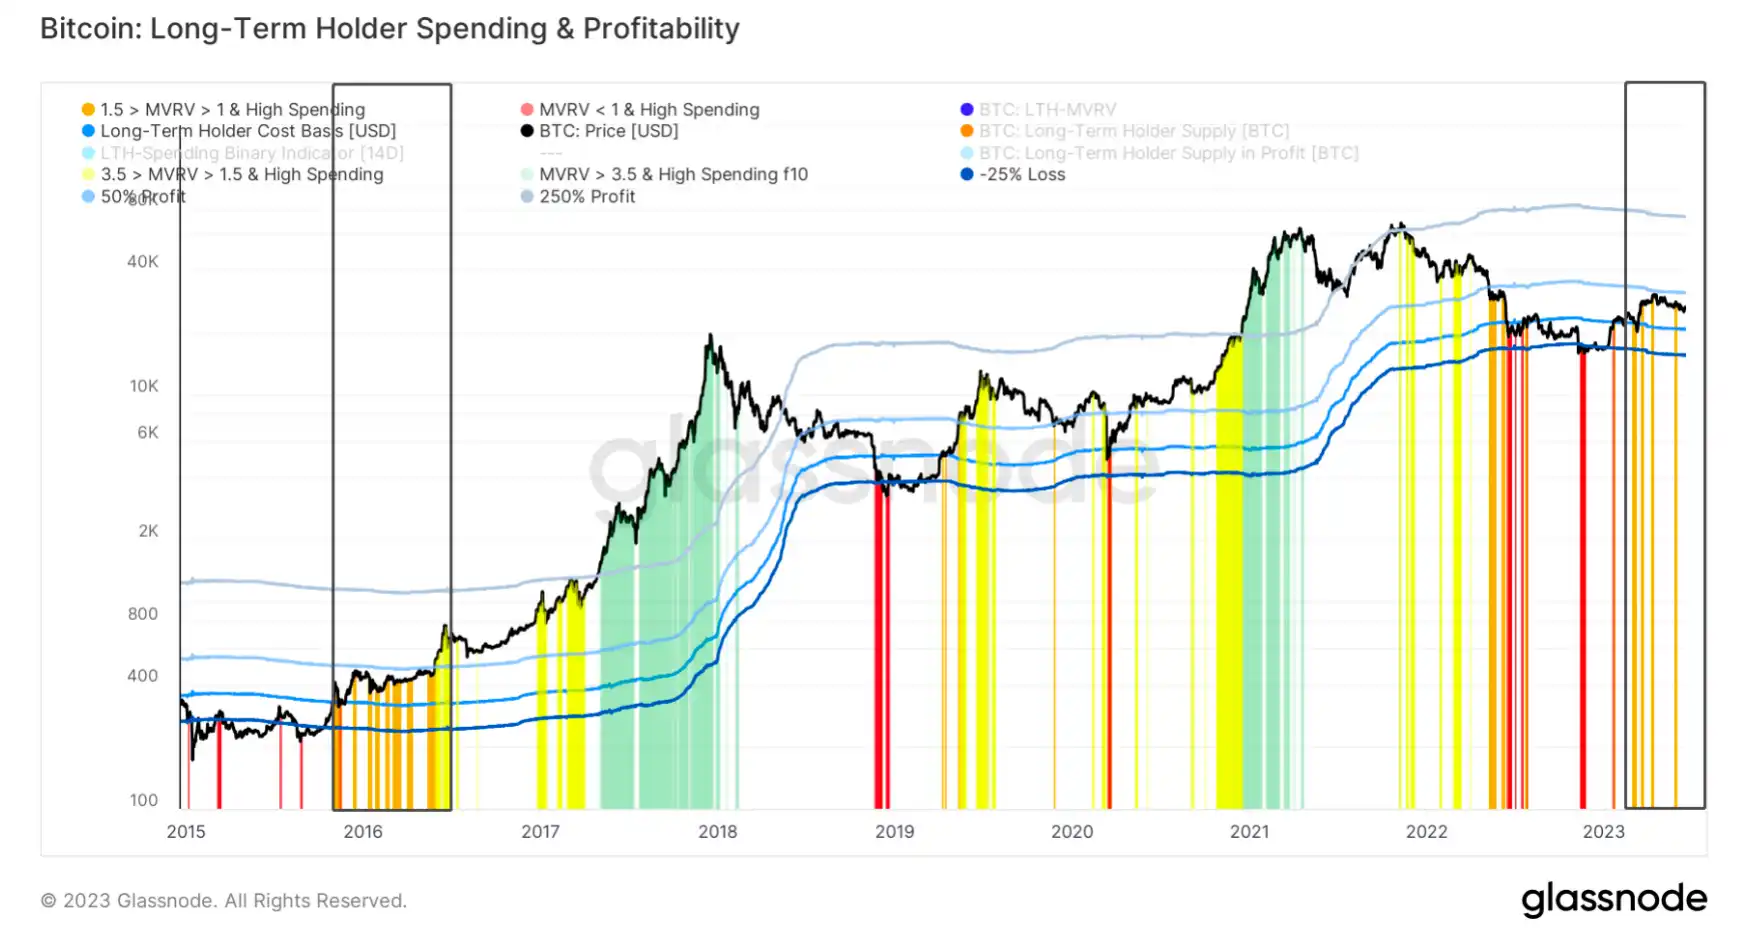
During the small bull market in mid-2019, the potential profit selling pressure far exceeded the current level, so let's put that aside for now.
Going deep into the important market moment of 2016, the random performance was an upward trend compared to the same period, as 2016 was experiencing a period of oscillation.
The current situation is relatively sluggish.
If we follow the majority's view, this time is similar to the small bull market in 2019. However, in terms of profit pressure, it is only about 40% of the level at that time.
This year's overall upward trend reveals more fatigue compared to some previous cycles.
In order to further verify, the concept of inflation rate (long-term investors' selling of the market) was introduced.
(Long-term inflation rate)
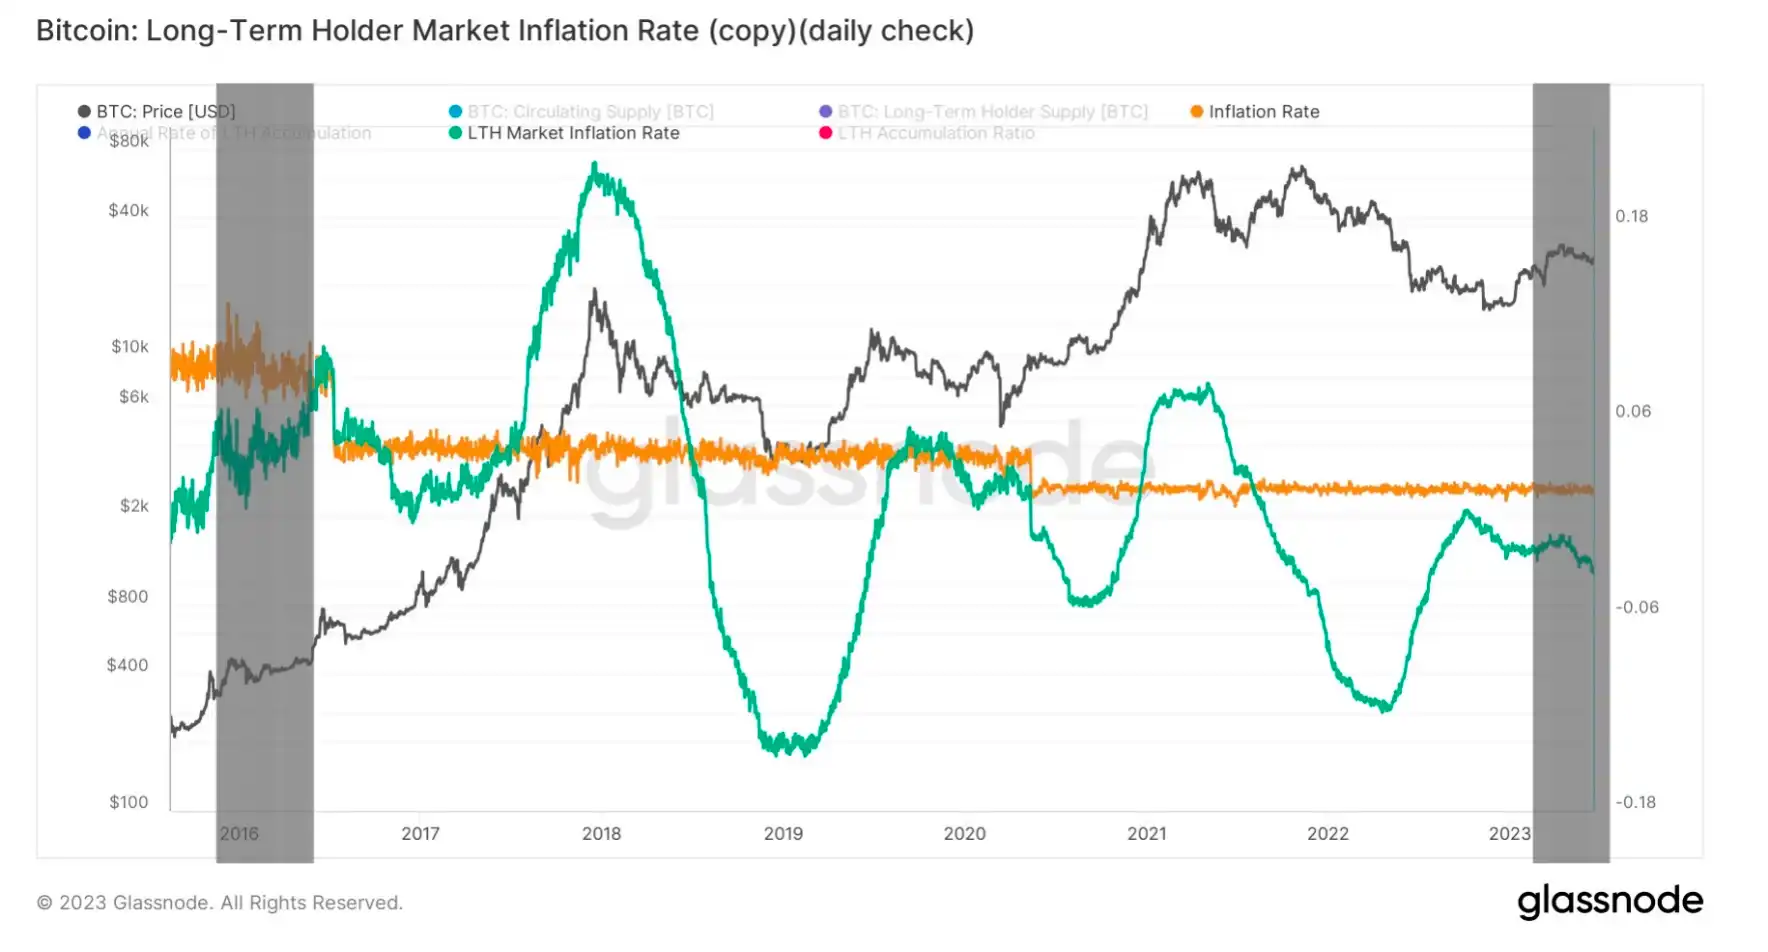
The selling situation of long-term investors at that time was much higher than it is now. The current market and data correspondingly indicate that the current strength is weak, whether compared to 2019 or 2016.
(See chart for spot selling pressure)
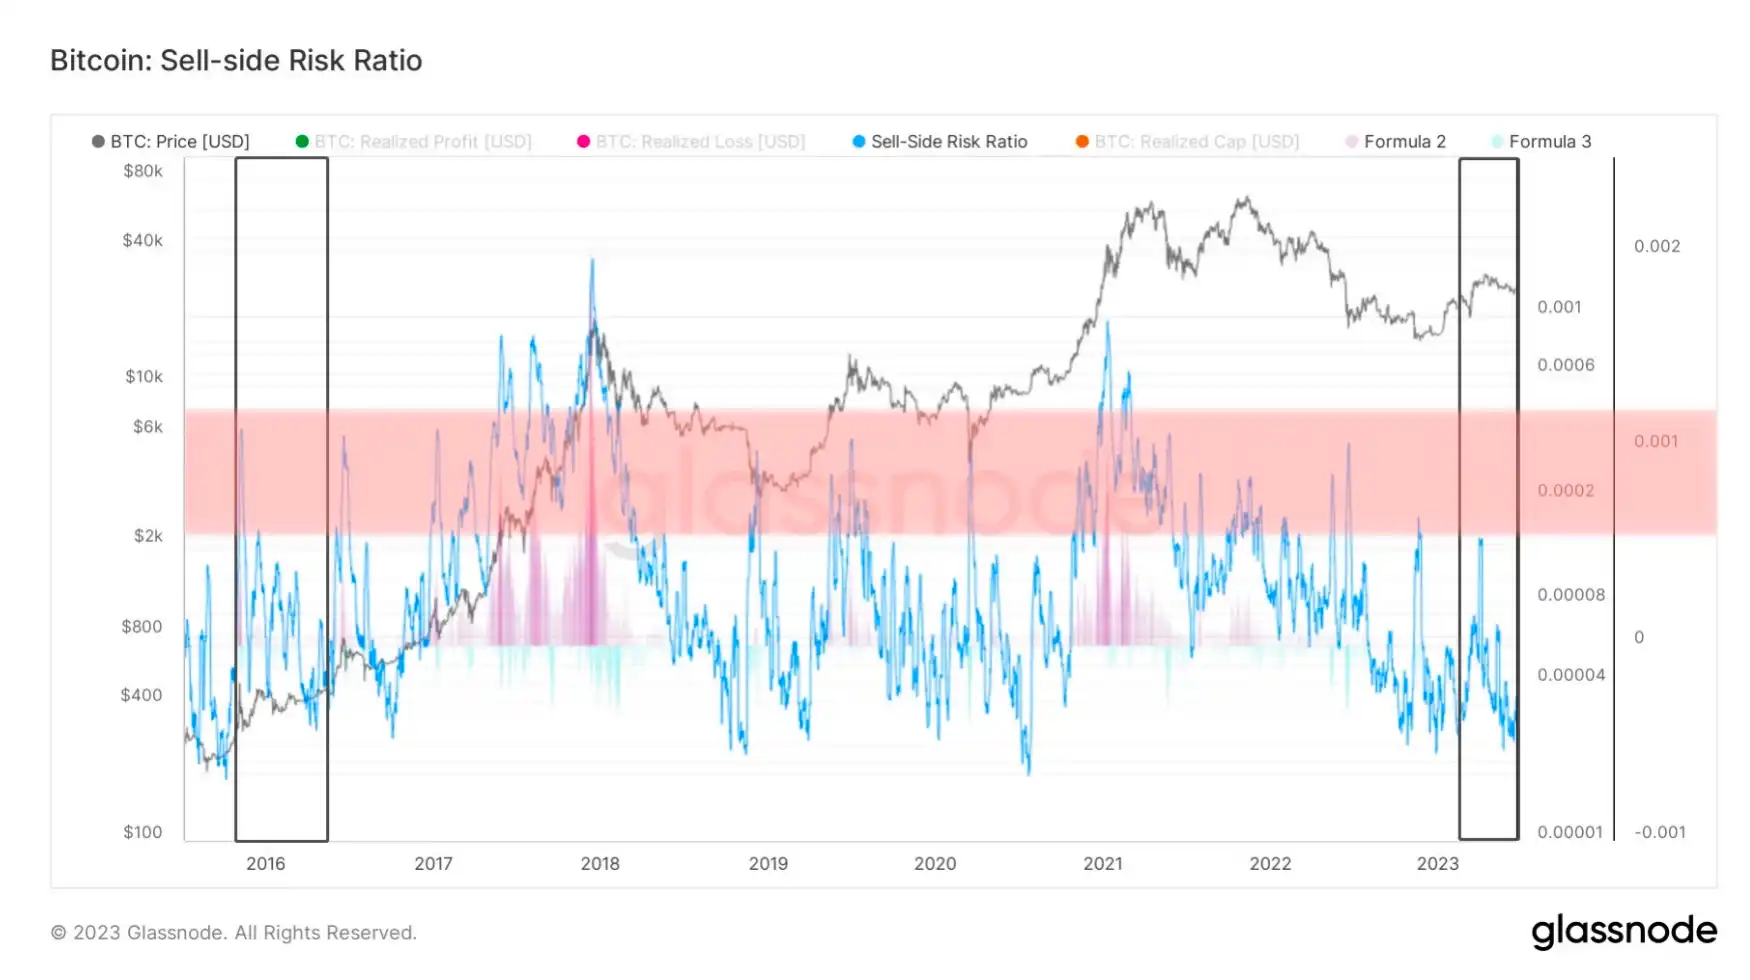
Compared with the situation in 2016, when the highest selling pressure was observed, the current selling pressure has decreased by 30%.
Regardless of the potential profit impact or the total selling pressure of spot, they both represent the current state of shock, which is far lower than that of 2016 and 2019, but the market performance is still worse than that of 2016 and 2019.
(High Weight Throw Pressure)
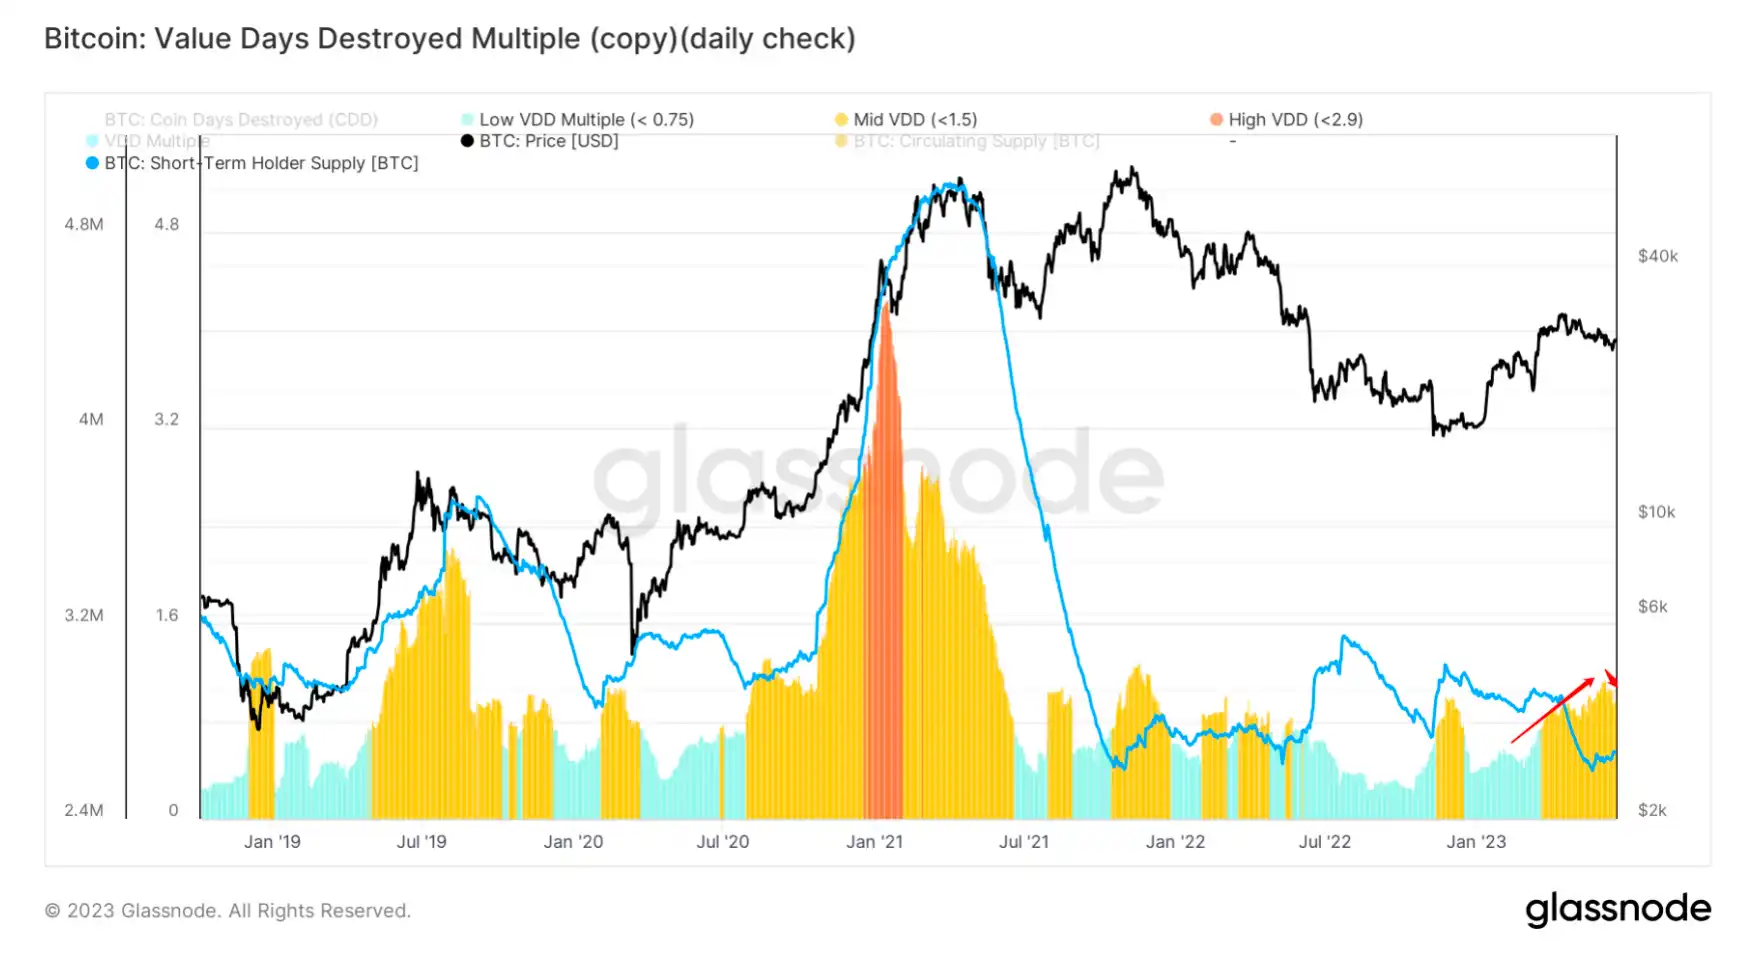
The specific high-weight selling pressure this year has slightly decreased.
With the current situation of high weight selling pressure, it may require some waiting in the direction of investment on the right side in the future.
The potential profit impact is only equivalent to a 40% increase in the small bull market of 2019.
However, the market feedback has weakened significantly.
In recent years, the pricing and market value in the industry have shown a certain degree of fatigue.
There may also be some discount on long-term pricing for the future.
Mid-term exploration
- Network sentiment positivity- Accumulation trend 分
- Long-term vs. short-term supply holding ratio
- Long-term supply of net positions.
- Short-term profit percentage compound model.- Centralized trading platform main asset balance.
(Network Emotion Positivity)
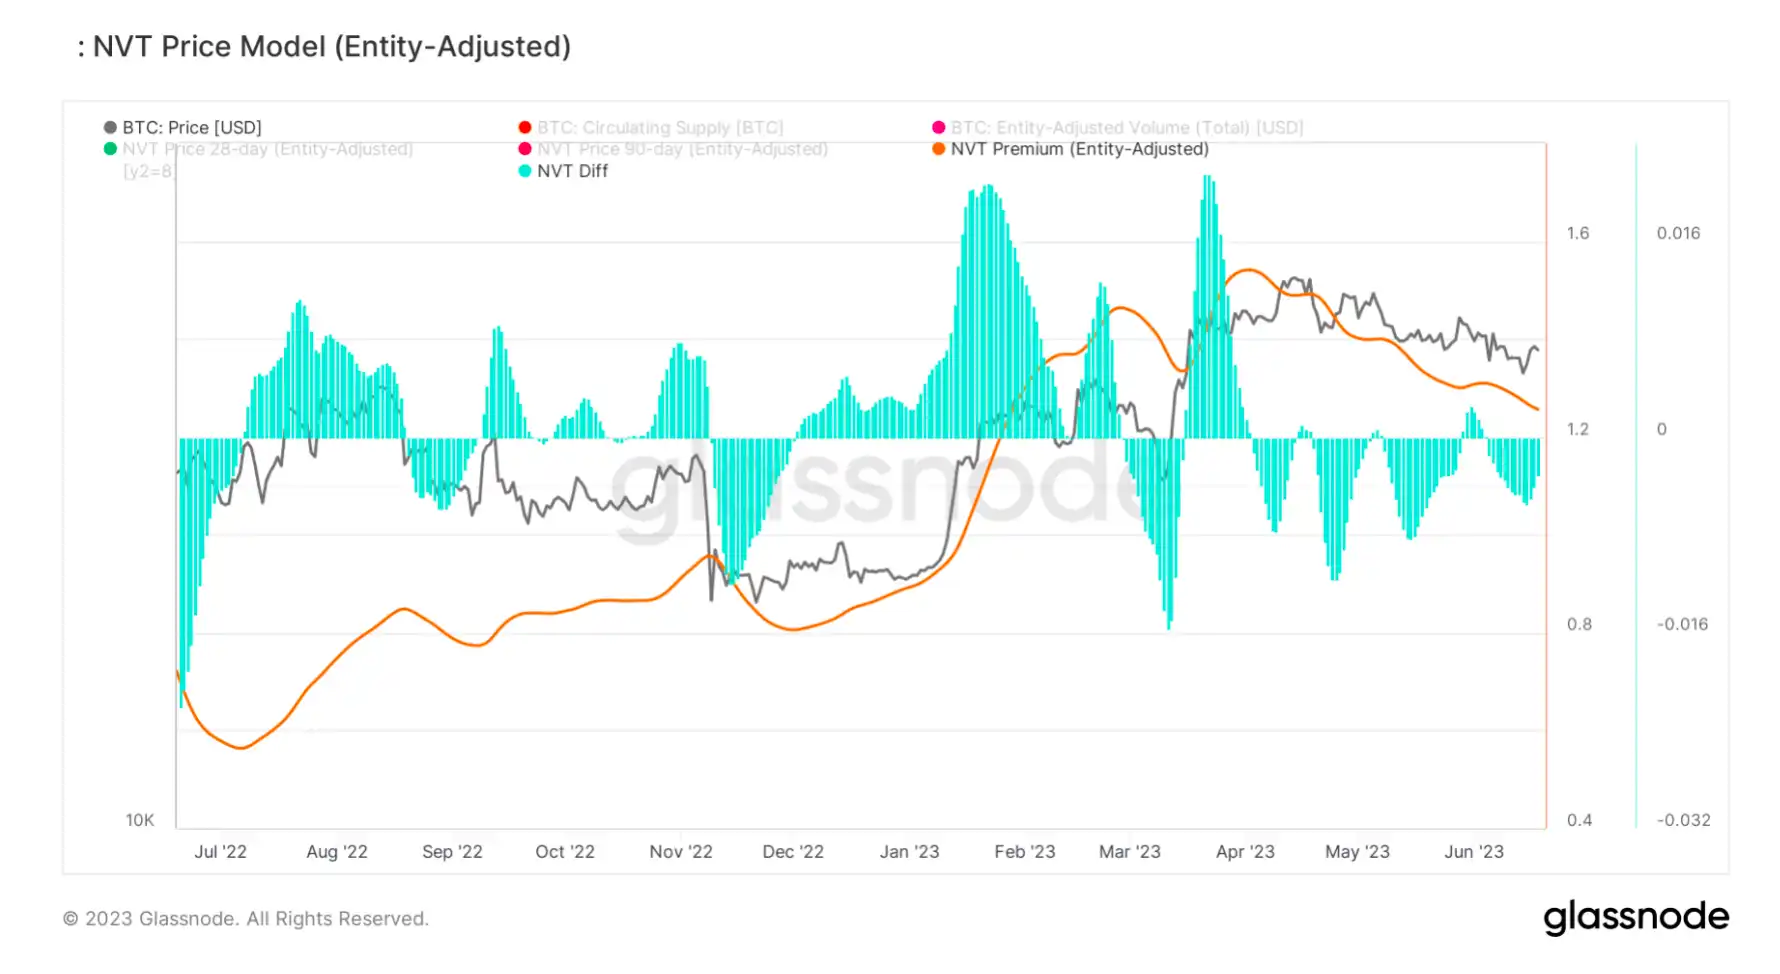
The enthusiasm on the chain is still in the repair stage, and there may not be a reversal right signal in the short term. Currently, it is more inclined to slow repair.
However, the current information only reflects the current situation, leaving the question of when the market will bottom out for the audience to ponder.
Explore group dynamics in depth.
(Accumulation Trend)
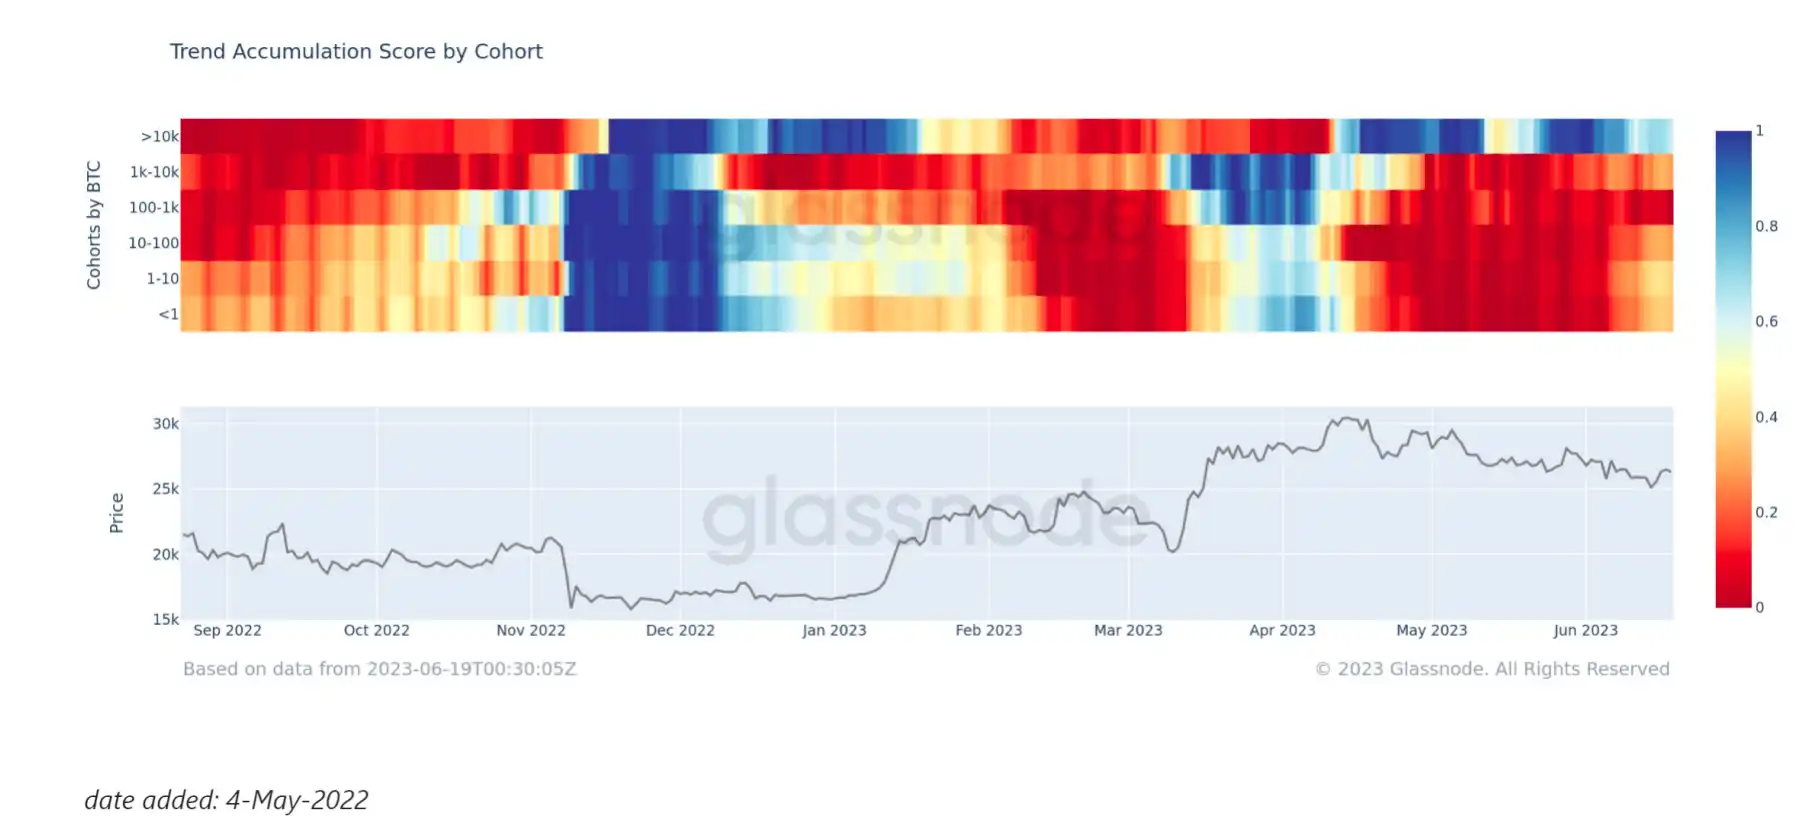
Observing the accumulation trend, the accumulation status of addresses with more than 10k has slowed down, but the overall holding status in the market is in a slightly recovering stage. Compared to the previous poor accumulation status, there is currently a certain level of momentum and accumulation.
If we observe the market from the left perspective, we will find that the accumulation status of the group during the period of price decline has begun to recover, and there may be a certain accumulation momentum for the future market in the current market.
Of course, the factors that make up the long-term fundamentals are quite complex. Currently, we are only observing the current state from a dynamic perspective.
Possibly suitable for in-market cautious expectations is to consider medium to long-term expectations as left-side operations.
(Short-term and long-term holding of supply)
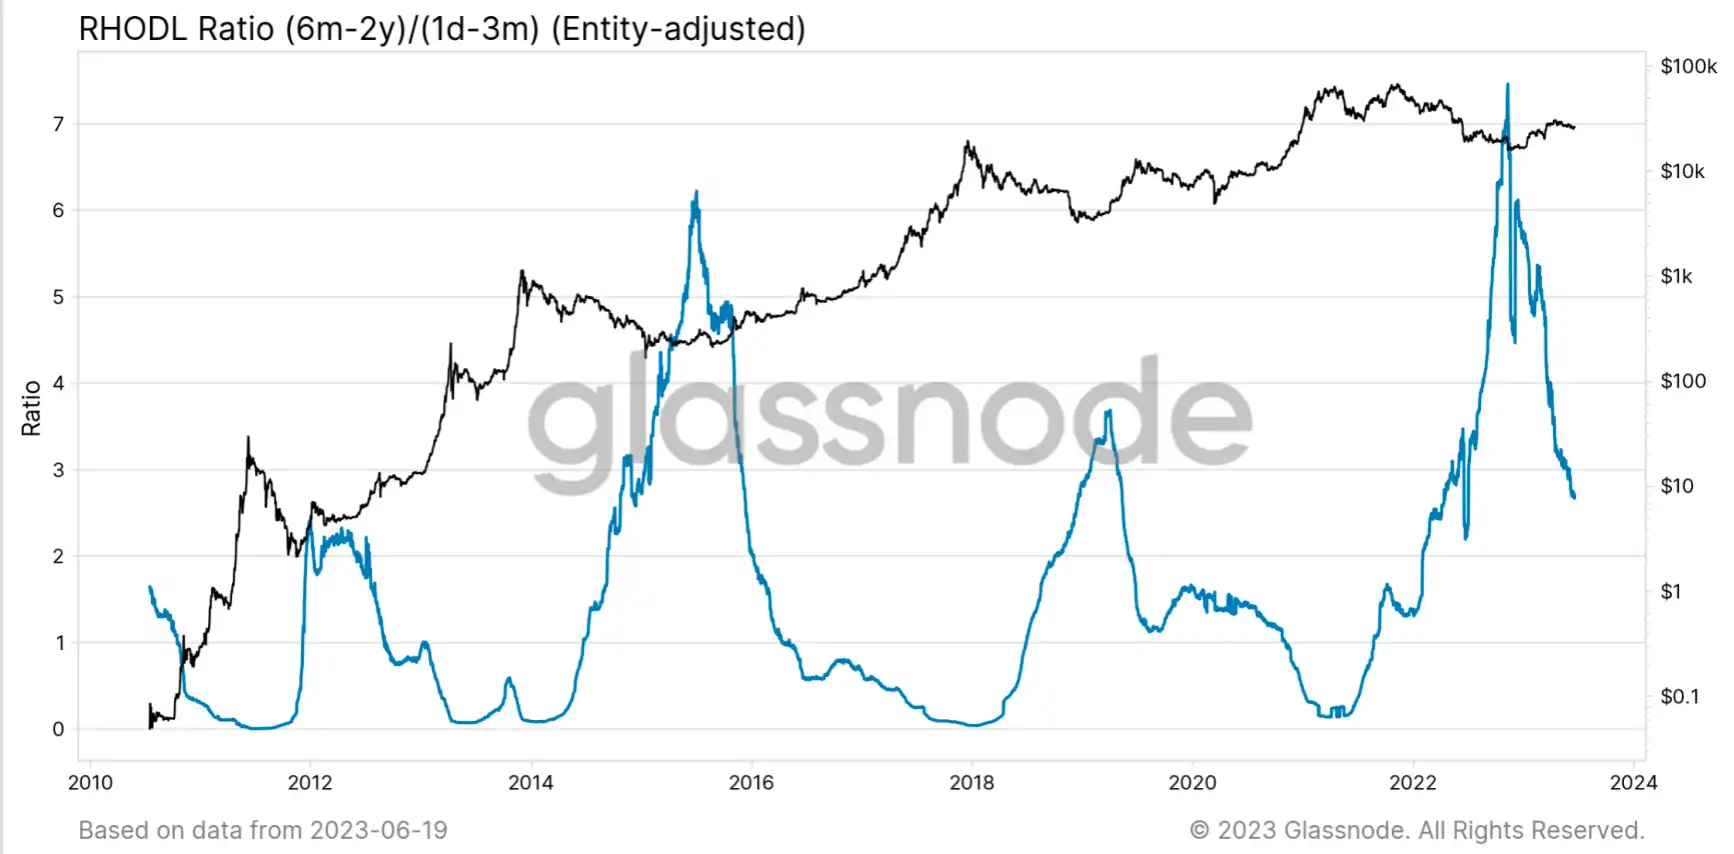
The ratio of long-term and short-term supply is the main basis for judging the current state in the industry, and is also used to measure the ratio of basic liquidity in the industry.
However, this model only reflects the ratio relationship and does not involve specific token transfers. It may be more suitable for observing the formation of long-term cycles.
From the current situation, the increase of medium and long-term groups in the market will compress the supply of tokens available for sale in the market. This will make the selling space of sellers in the market smaller, but the place where the model may be supplemented is the measurement of the purchasing power supply in the market.
(Centralized trading platform main asset balance)
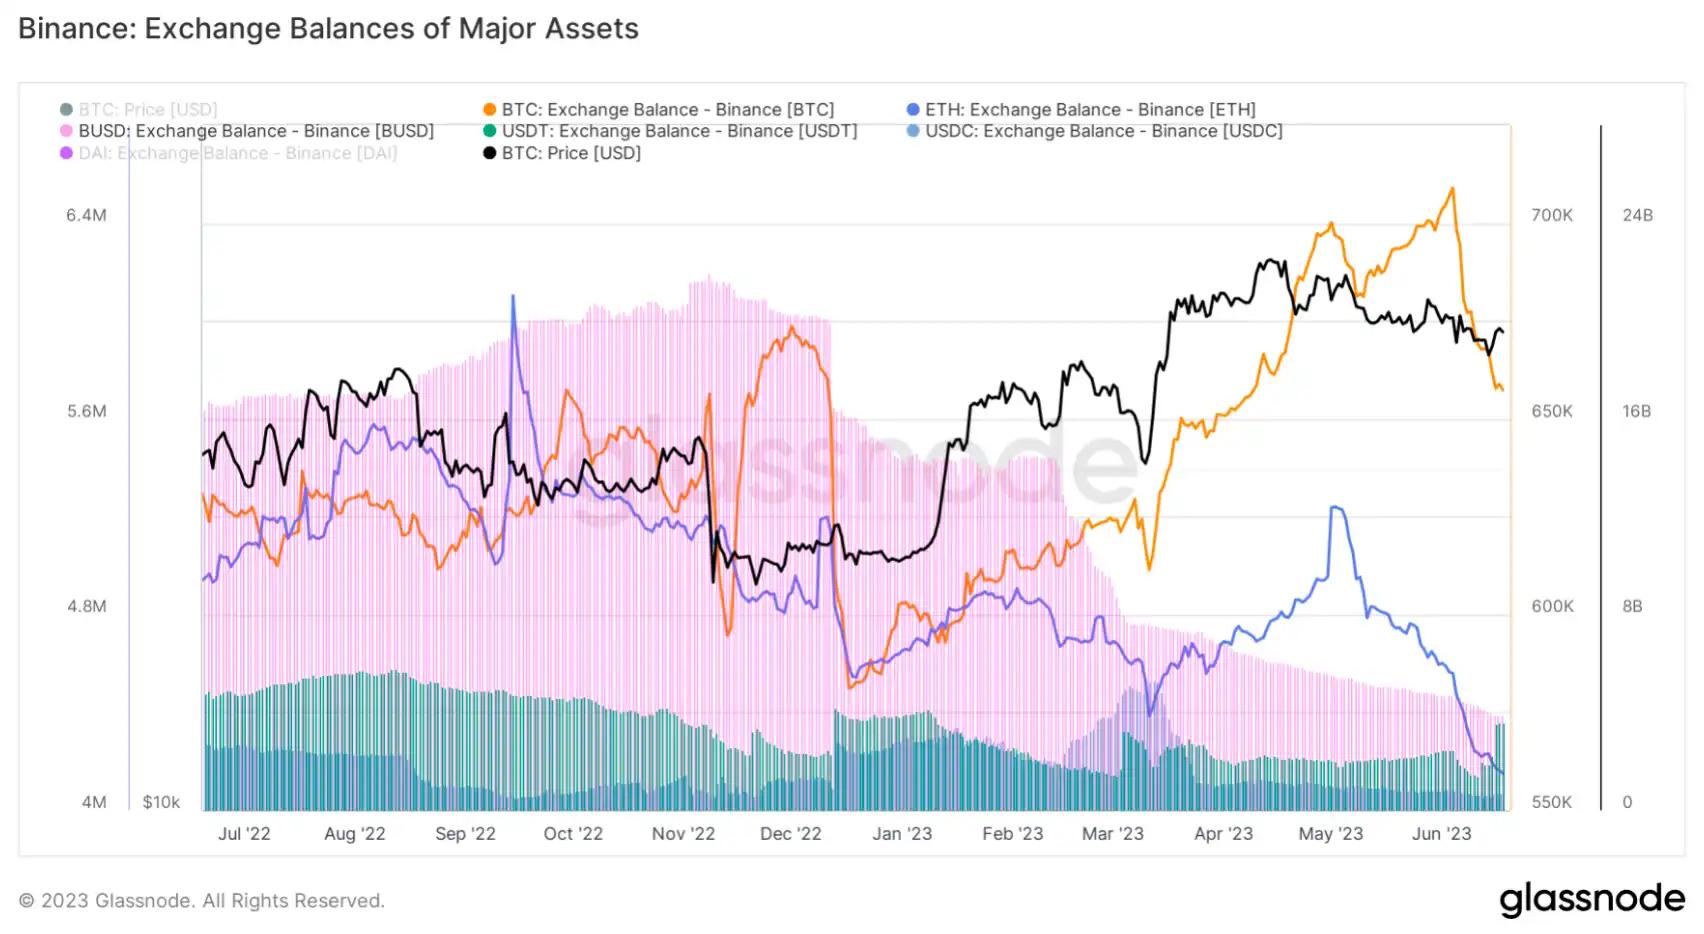
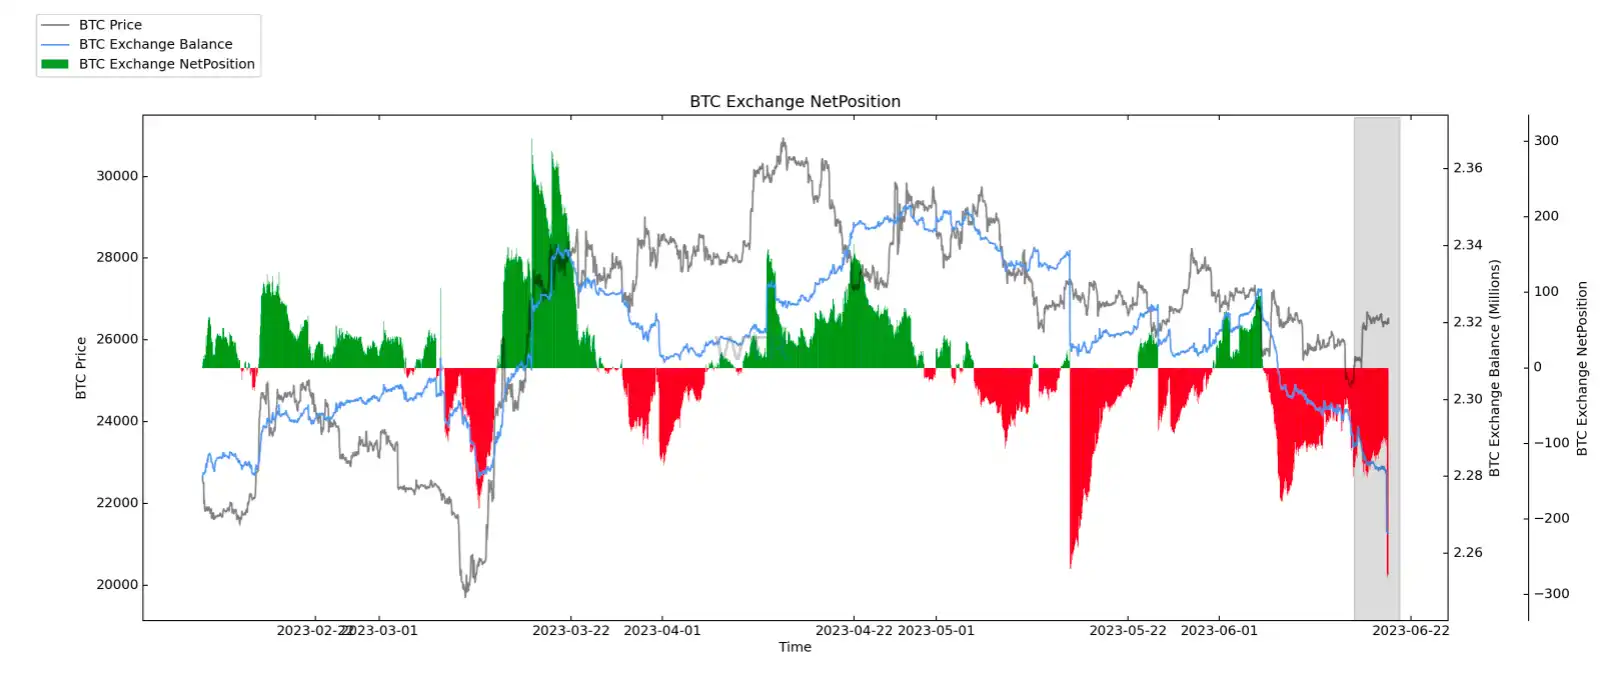
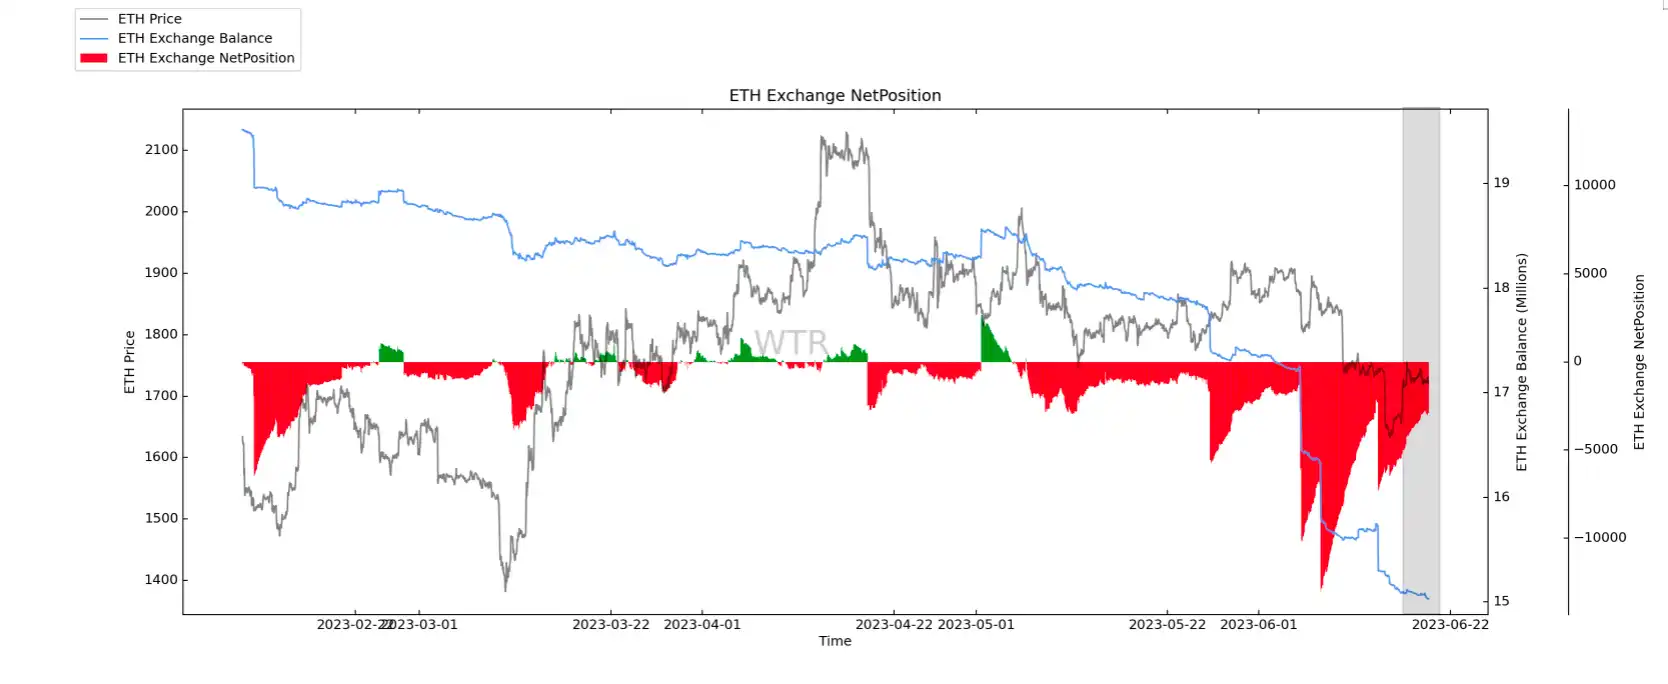
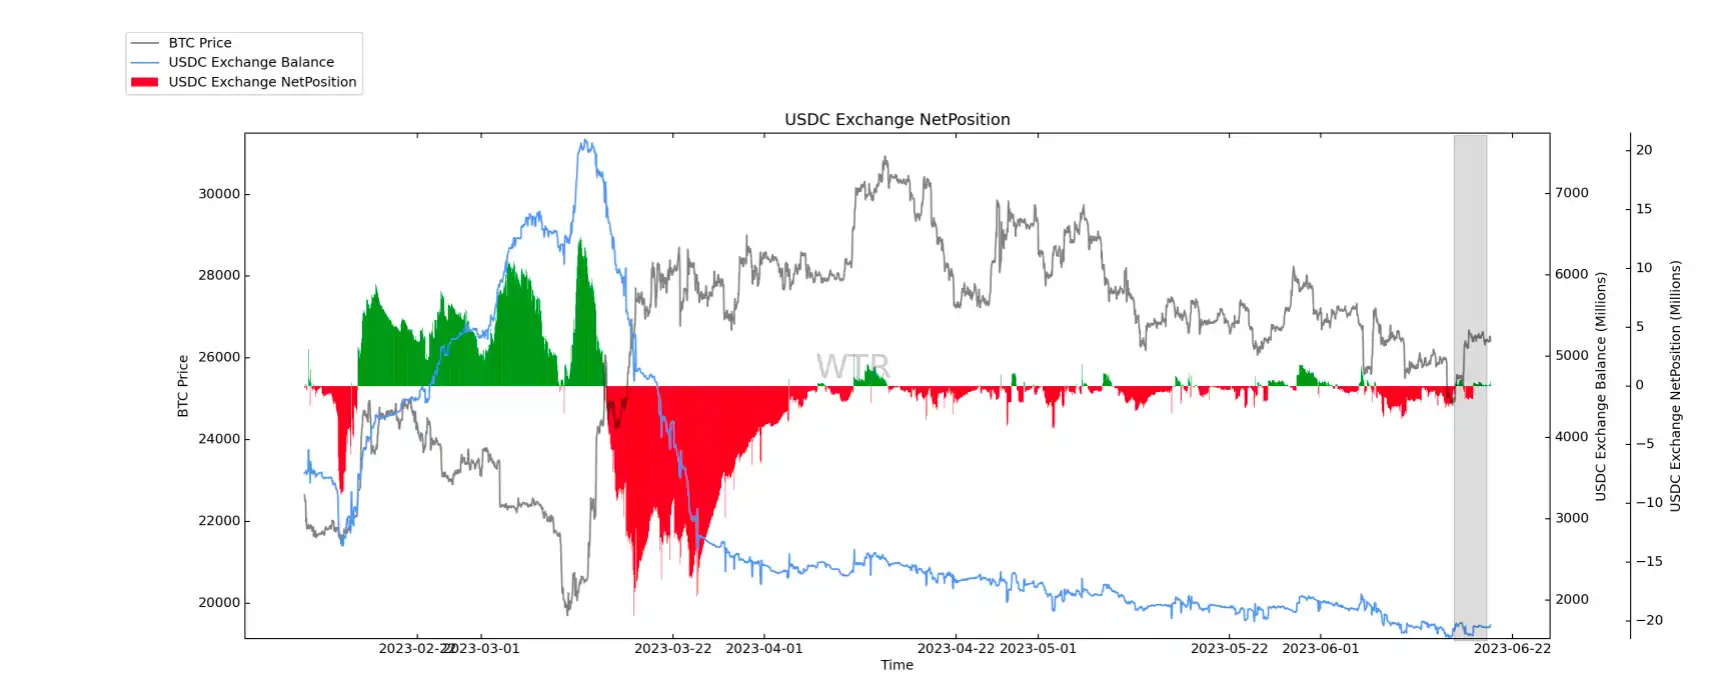
BTC and ETH both show a trend of outflow from centralized trading platforms. USDT has a significant increase, while USDC has a certain decrease, which may be due to the recent bearish expectations of USDC, leading to the situation of stablecoin replacement in the market.
If given enough time dimension, recent stablecoins have not yet shown strong recovery status.
It is possible that the supply available for sale in the compressed field of the medium to long term group may not be a factor that can directly drive the market to improve in the medium to long term. A relatively objective understanding is that the difficulty of short selling has increased, and more dynamic observations need to be added to make up for errors in the future.
(Long-term supply of net positions)
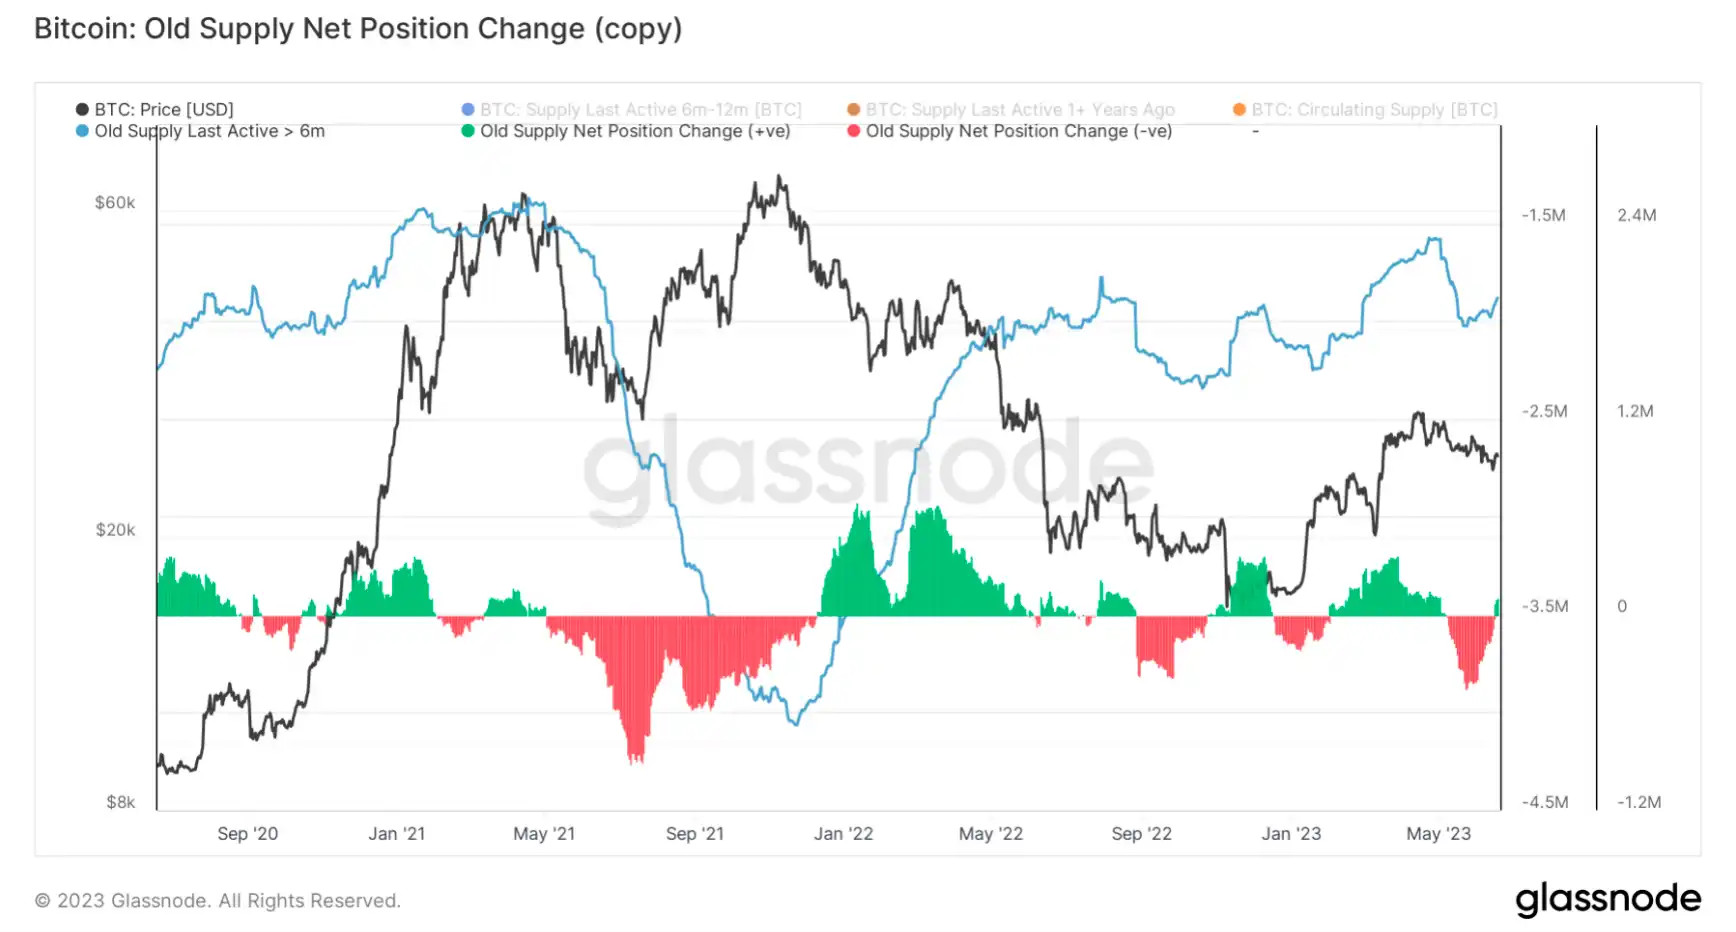
There has been a recent increase in supply for the medium to long-term group of over 1 year, and there may be an increase in the number of people who are willing to hold onto their coins.
(Short-term profit percentage compound model)
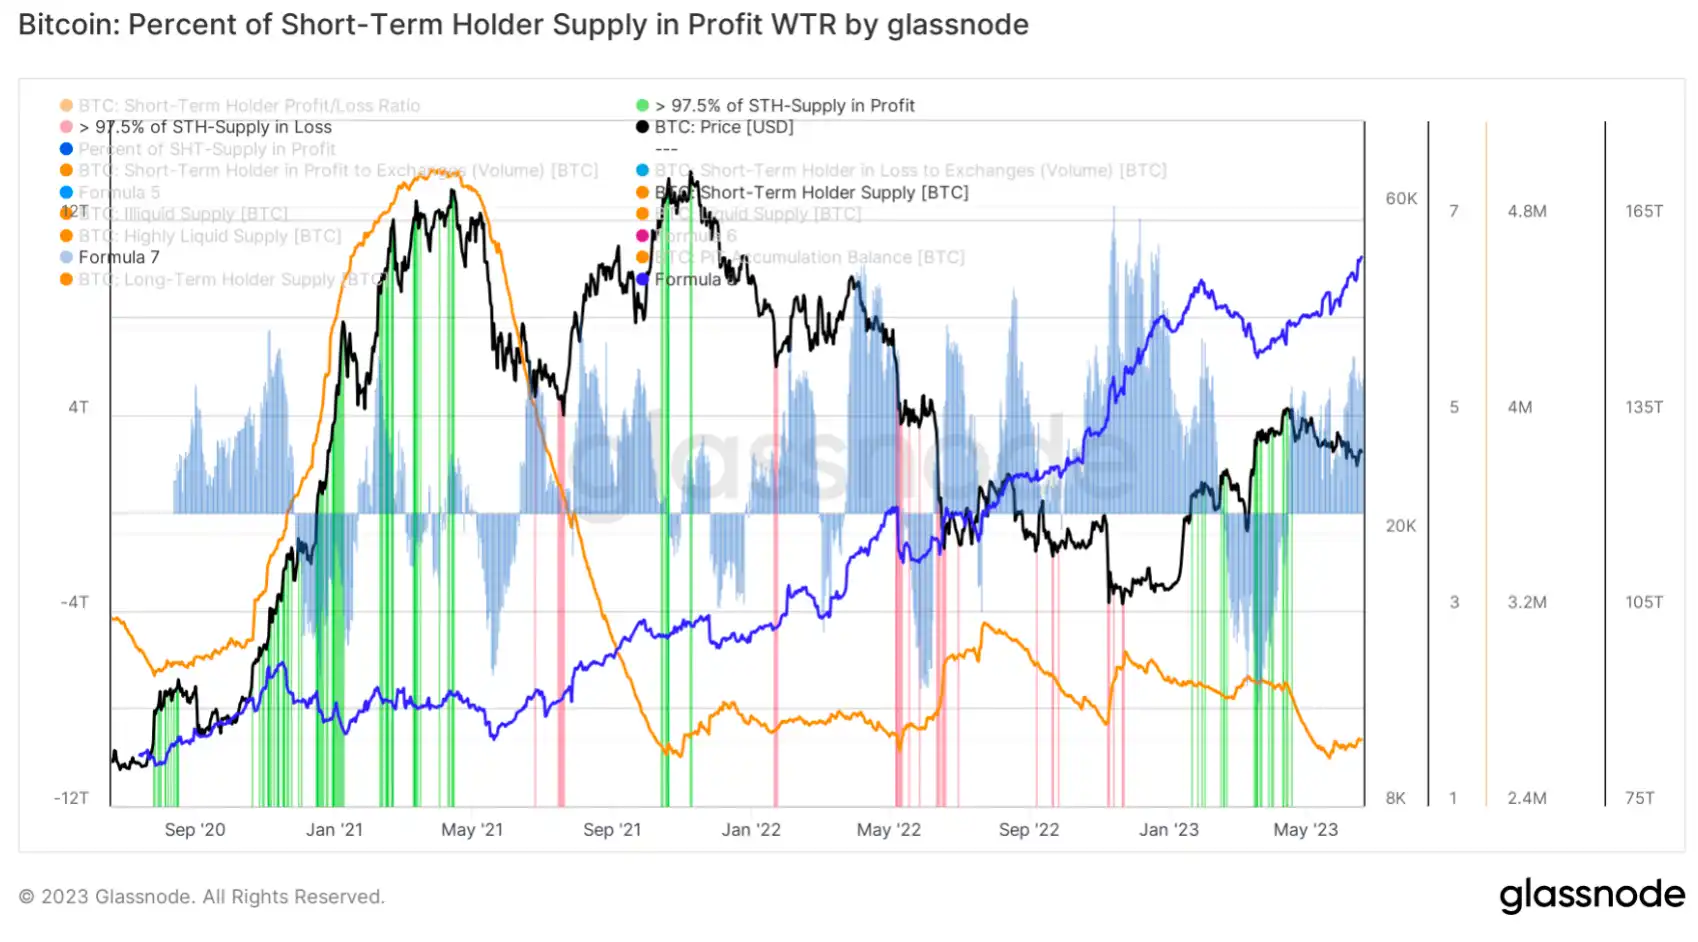
This model is used to observe the cyclical top and bottom states of the market, and secondly, to observe the trends of the accumulated groups and short-term liquidity supply groups in the market.
The group of accumulative investors is still increasing their positions, and there are still few repair links in the short-term supply. It is possible that the market is still in a state of stock and low liquidity.
Short-term Observation
- Derivative risk coefficient
- Option Intention Transaction Ratio- Derivatives trading volume
- Option Implied Volatility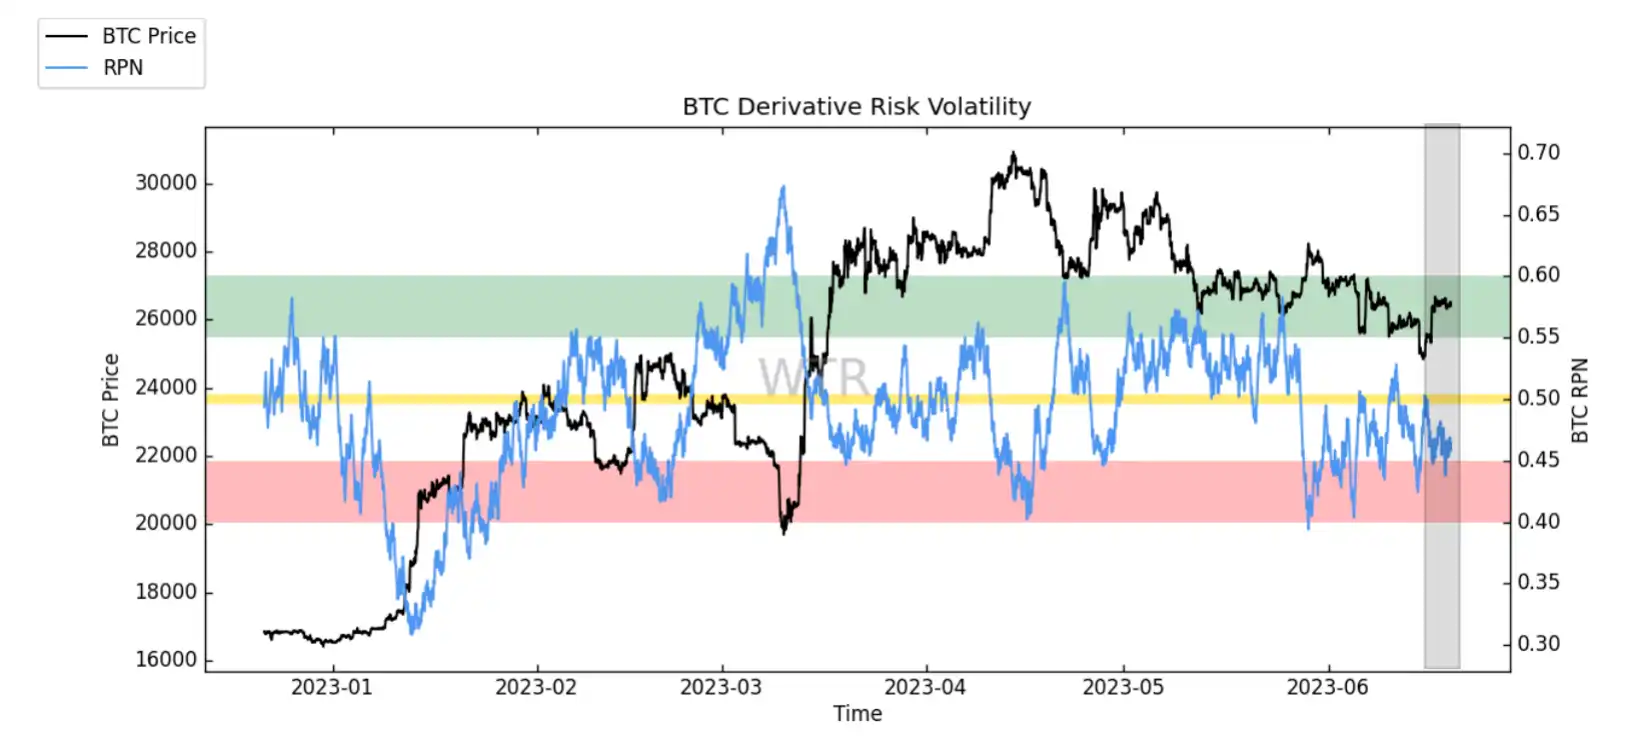
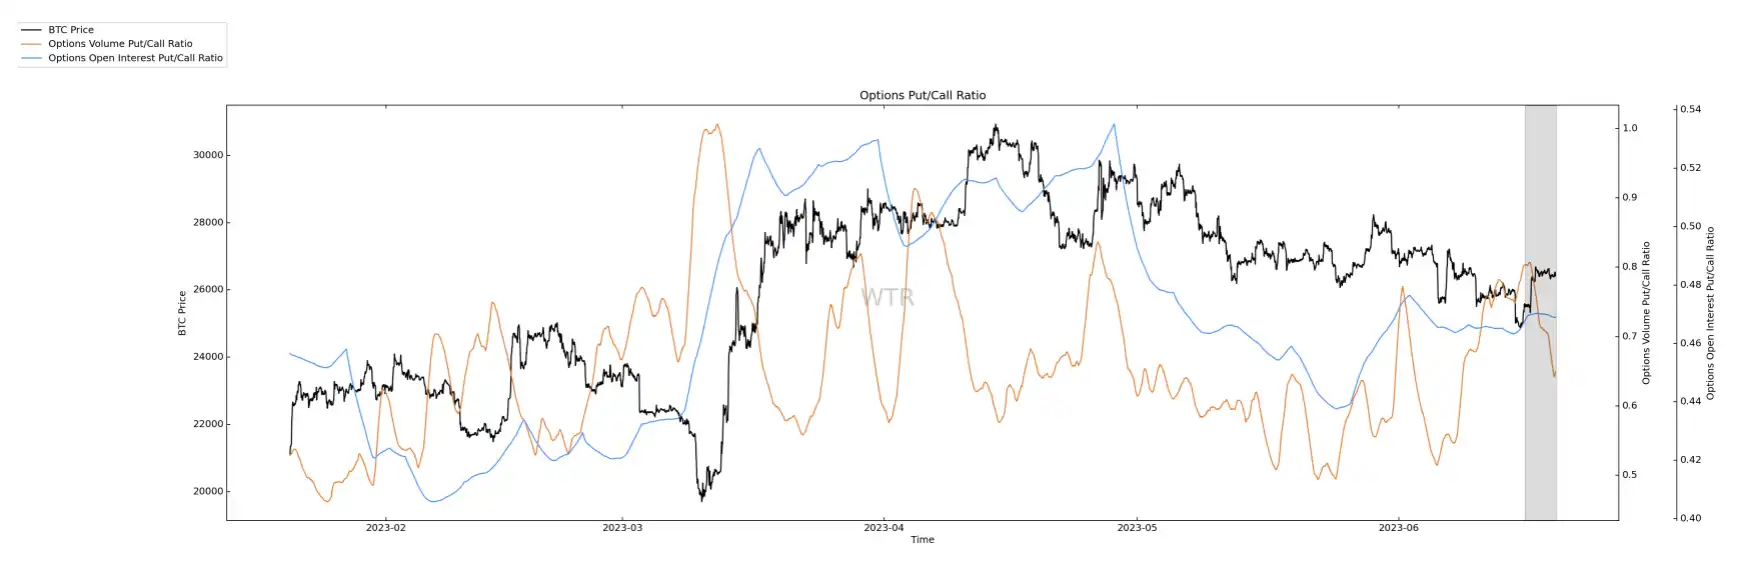
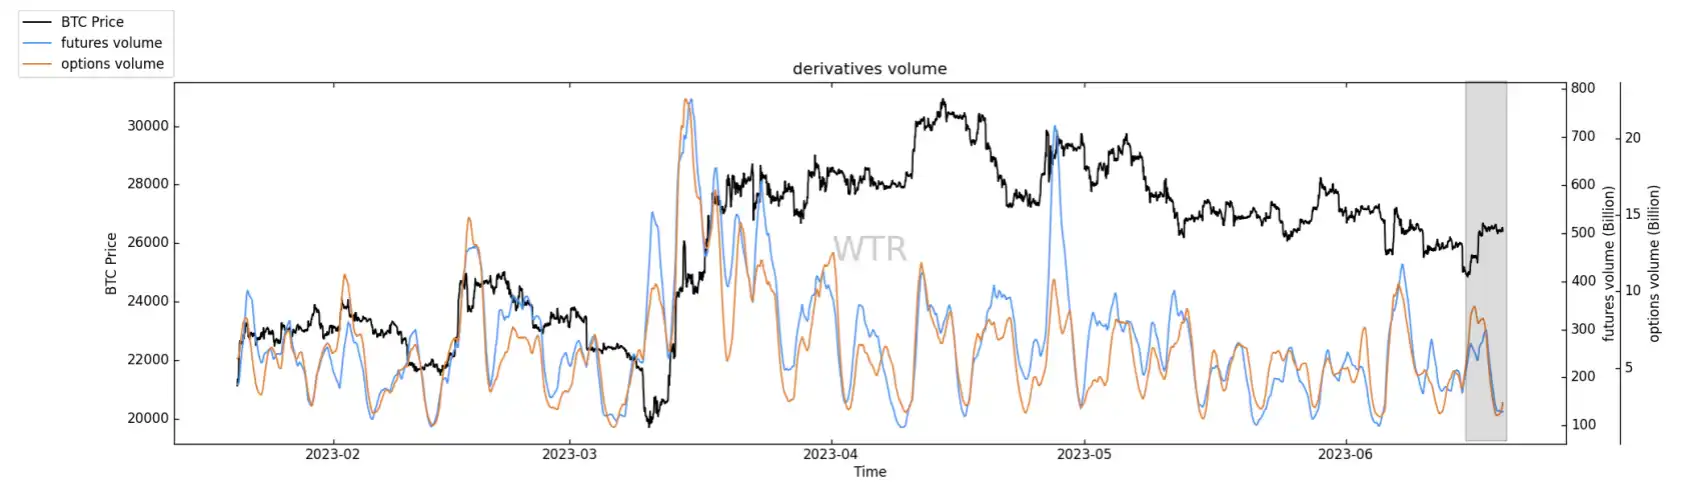
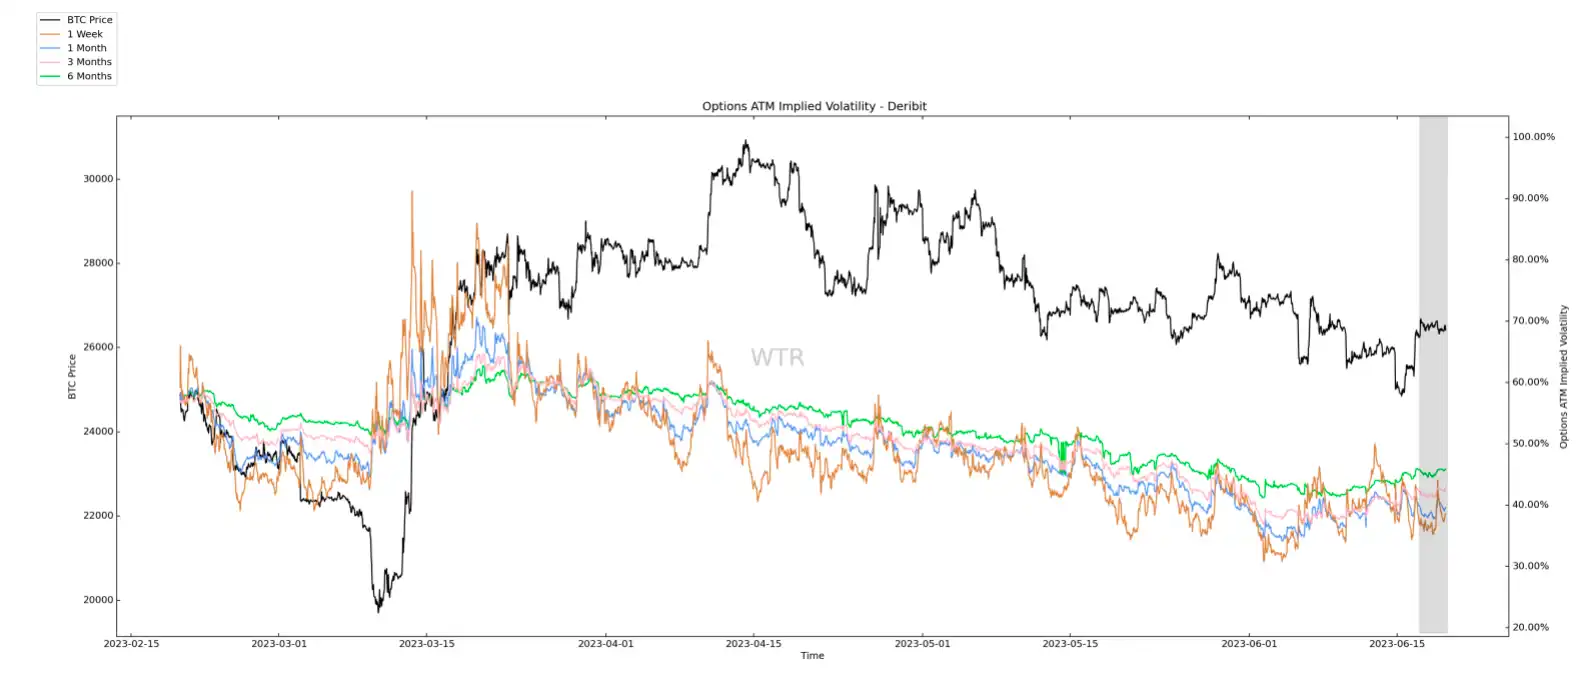
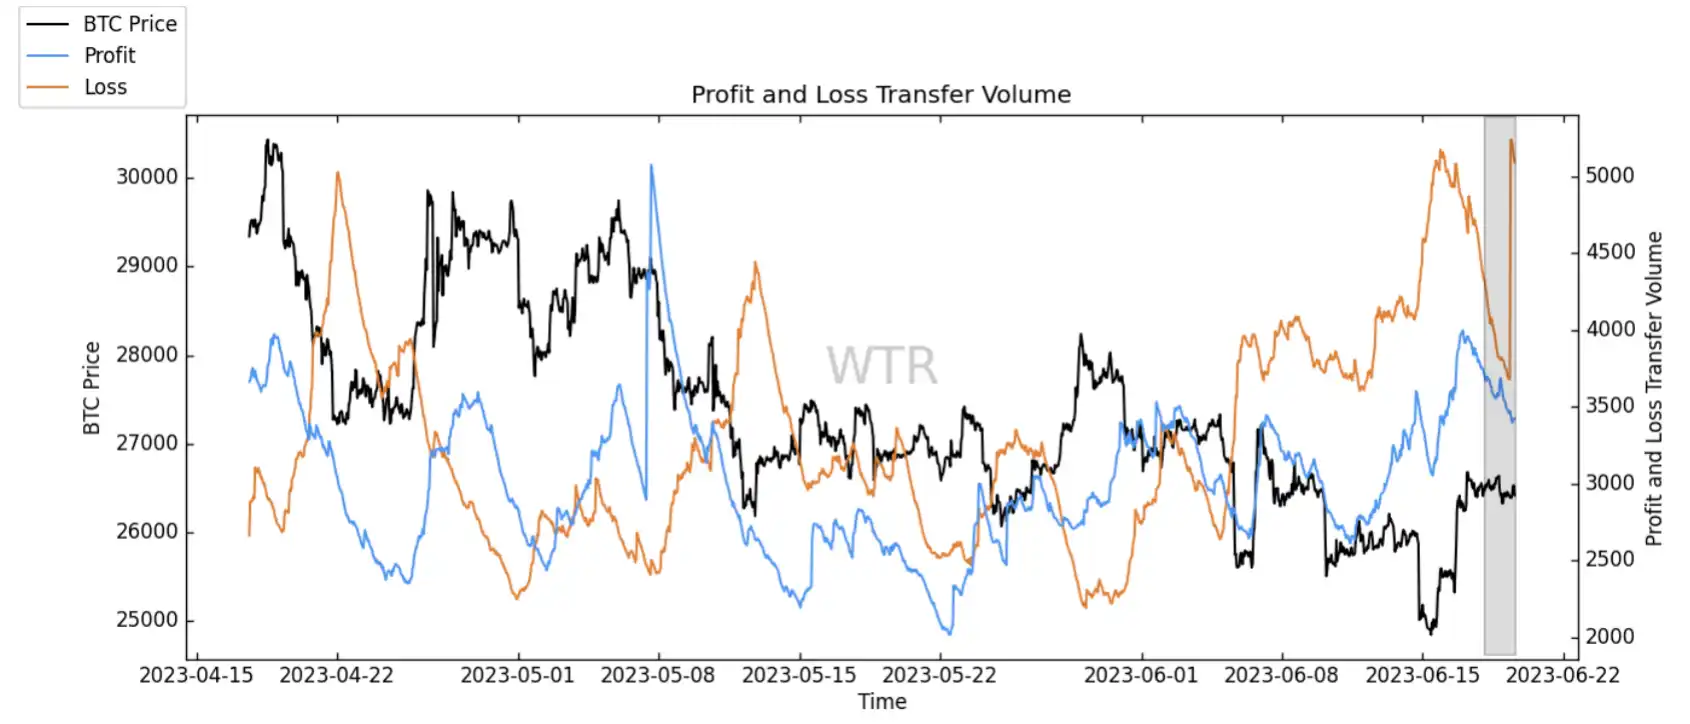
(Net Position of Bingtangcheng Trading Platform)
(Net Position of E-Trade Platform as shown in the following figure)
(Global purchasing power status)
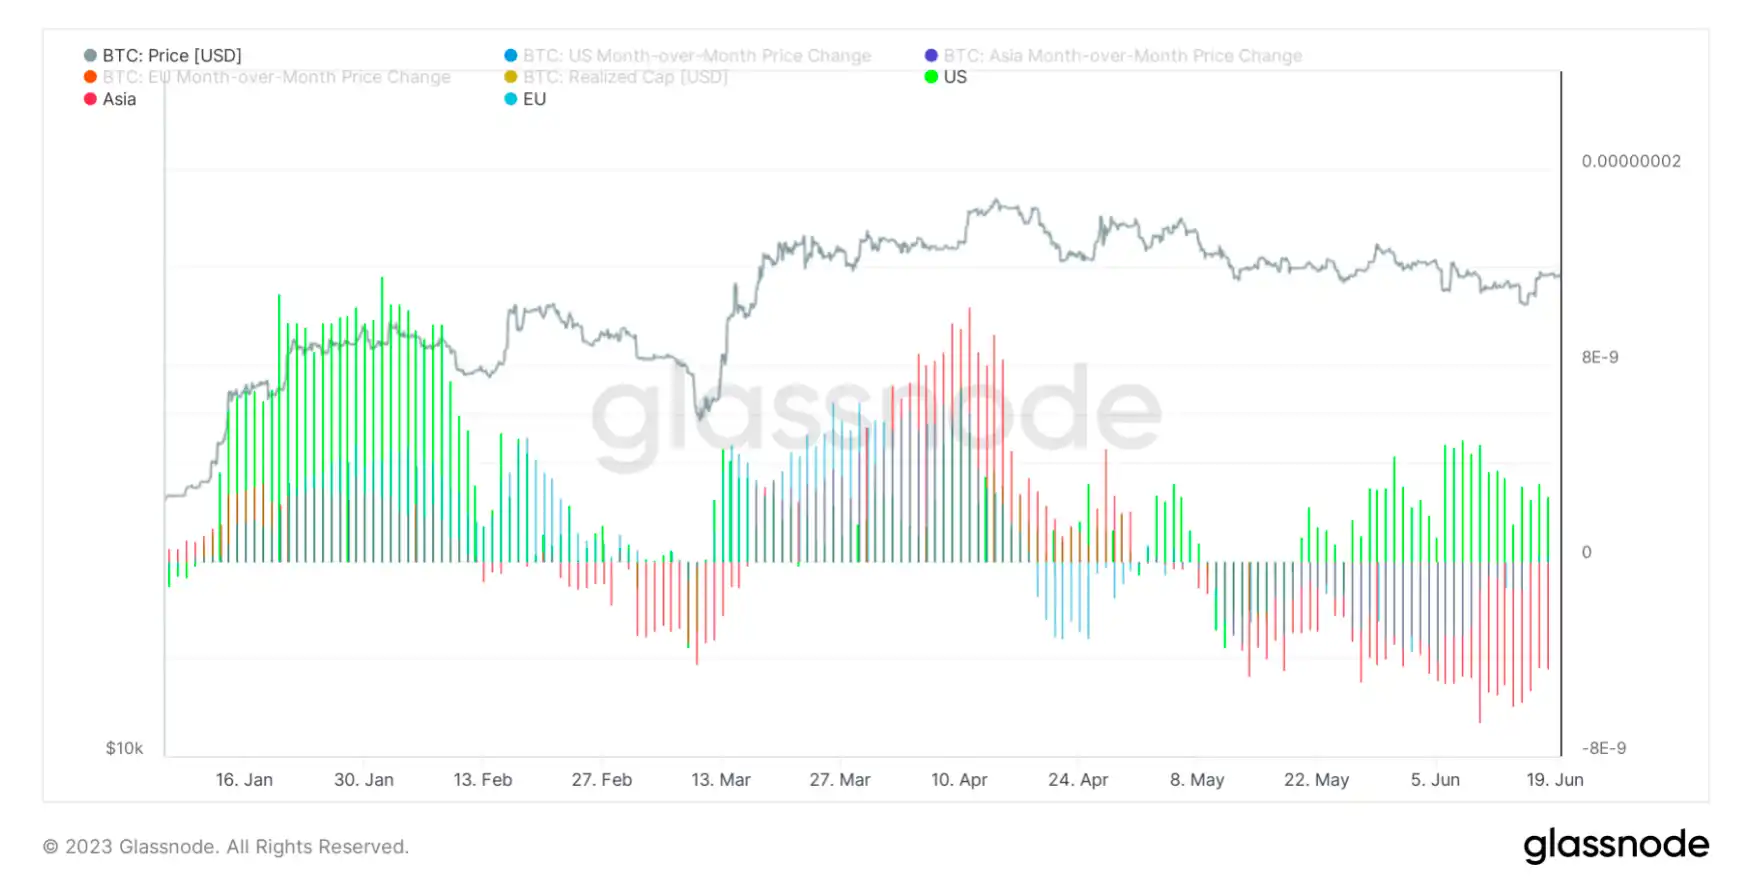
Asian purchasing power remains negative, while European purchasing power has rebounded from negative to positive and American purchasing power has slightly declined.
(Net position of USDC trading platform as shown below)
(Net position of USDT trading platform as shown below)
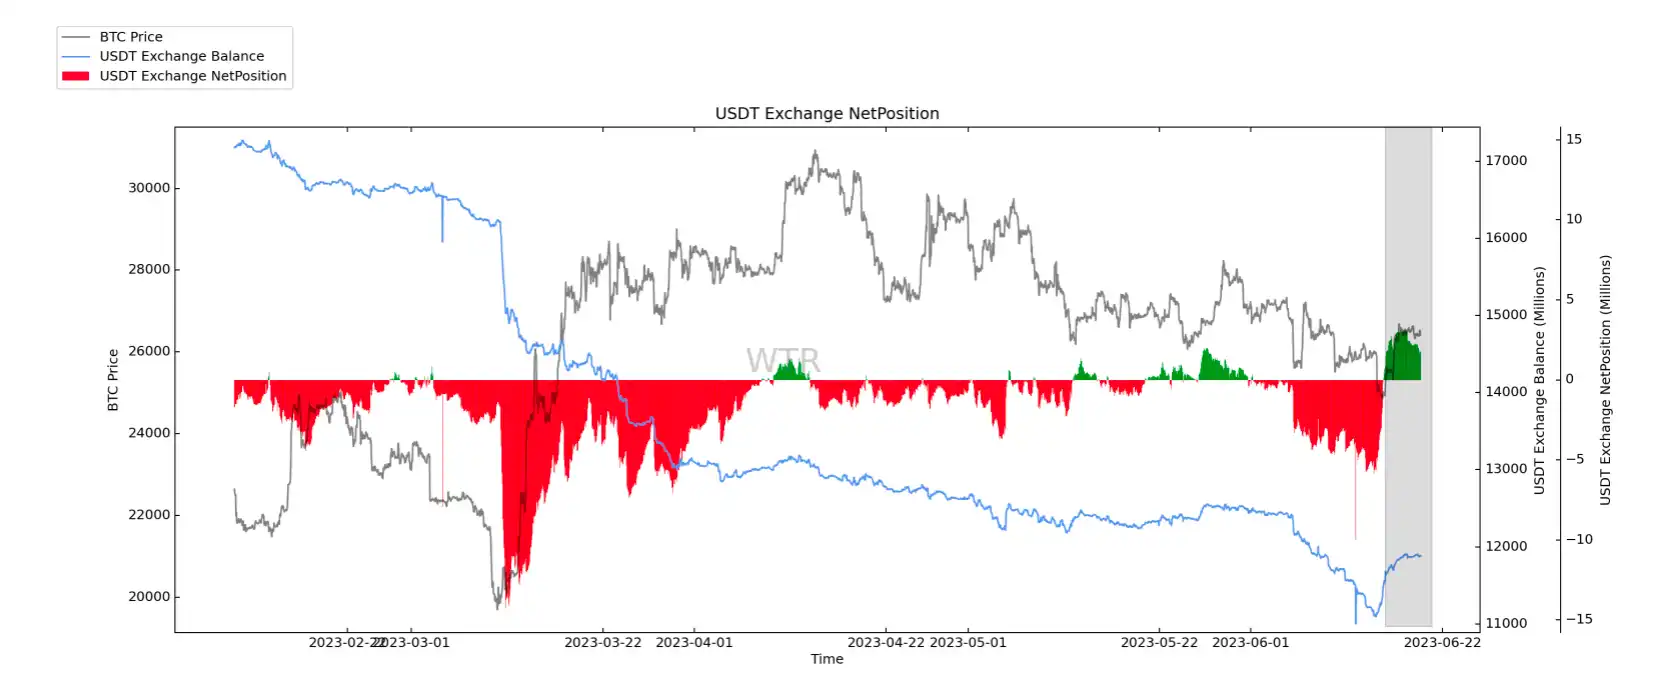
USDT trading platform net position shows a moderate inflow state.
Off-chain transaction data rating: Willing to buy at 24500; willing to sell at 27000.
(Coinbase off-chain data as shown below)
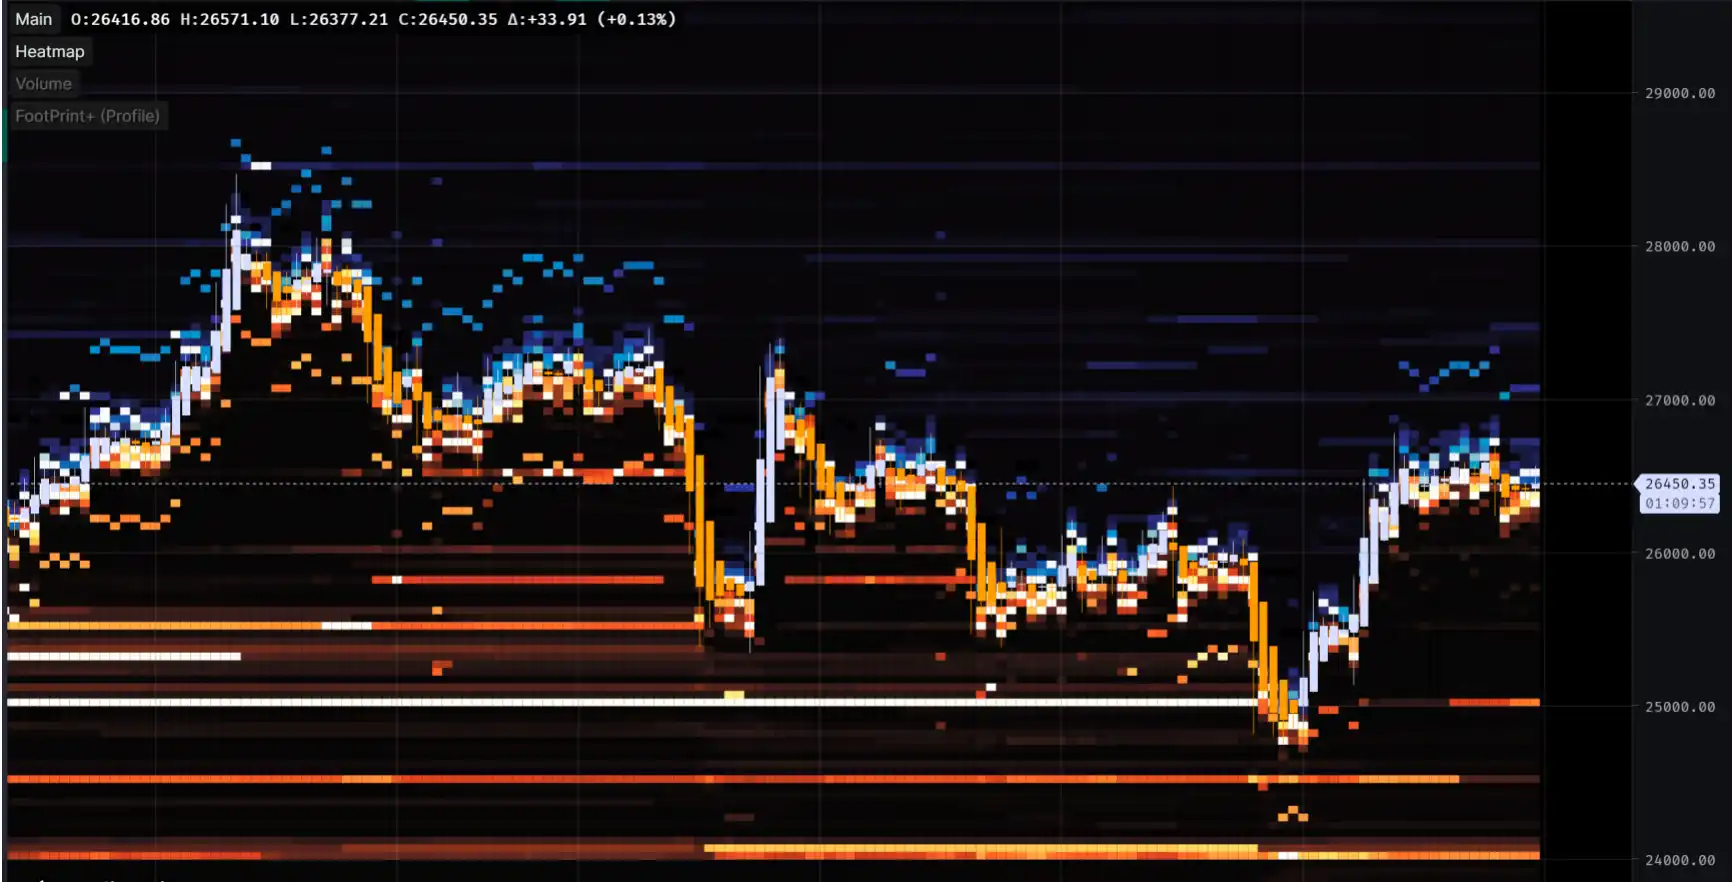
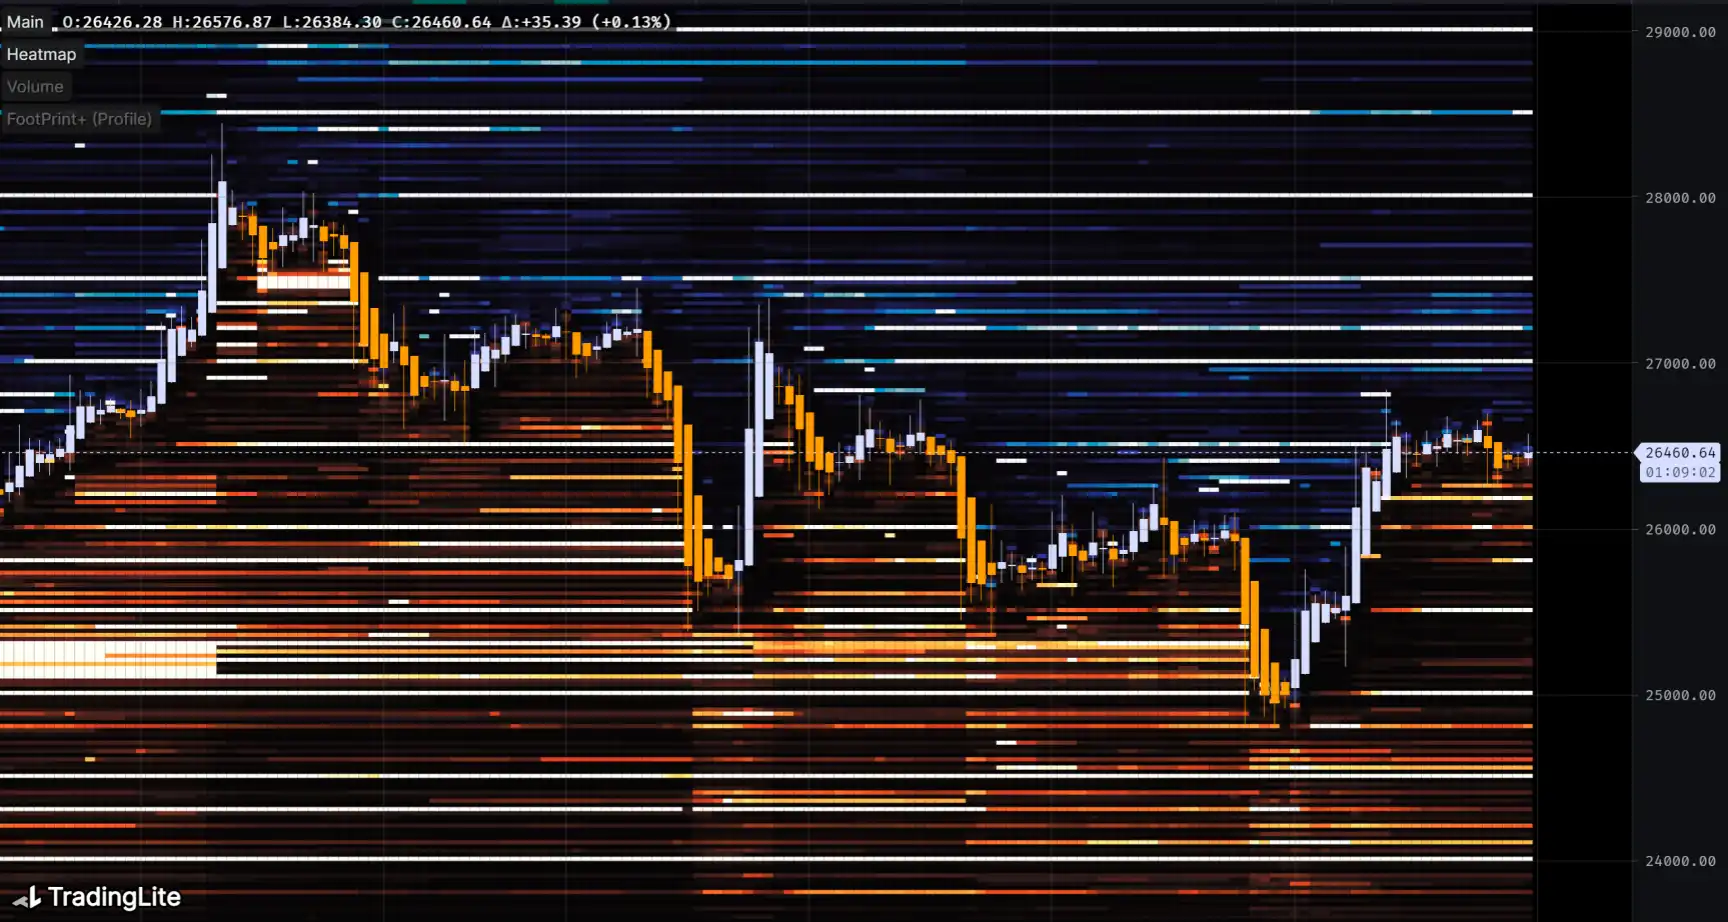
There is a willingness to buy at the price range of 24000, 24500, and 25000.
There is a willingness to sell at prices around 27000, 28000, and 29000.
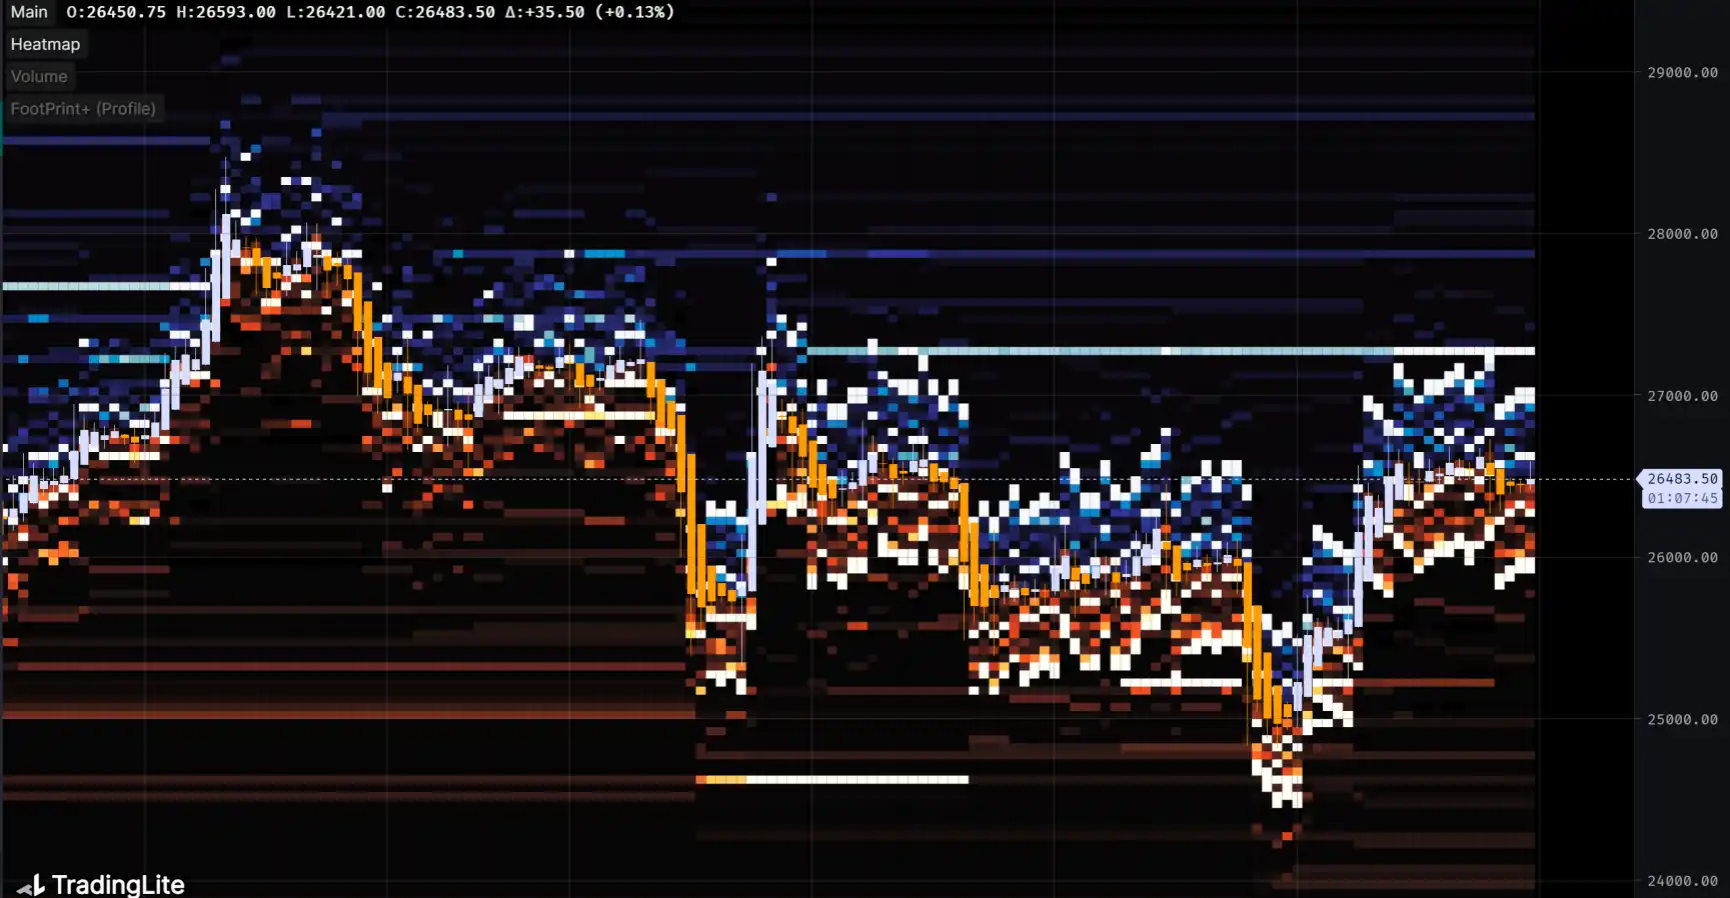
There is a willingness to sell at around 27000 price level.
This Week's Summary
On-chain Long-term Insights:
2. This year's overall upward trend reveals more fatigue compared to some previous cycles.
4. There may also be some discount on future long-term pricing.
Market Orientation:
This year's cycle has more fatigue compared to previous cycles.
1. On-chain transaction status has entered a mild recovery phase.
2. The accumulation status of the group is slowly recovering, and the accumulation of addresses with more than 10k is slowing down.
Market Orientation:
修复、积累 ->
Repair, Accumulation
On-chain short-term observation:
1. The risk factor is in the neutral zone at the lower edge, with a slight increase in risk.
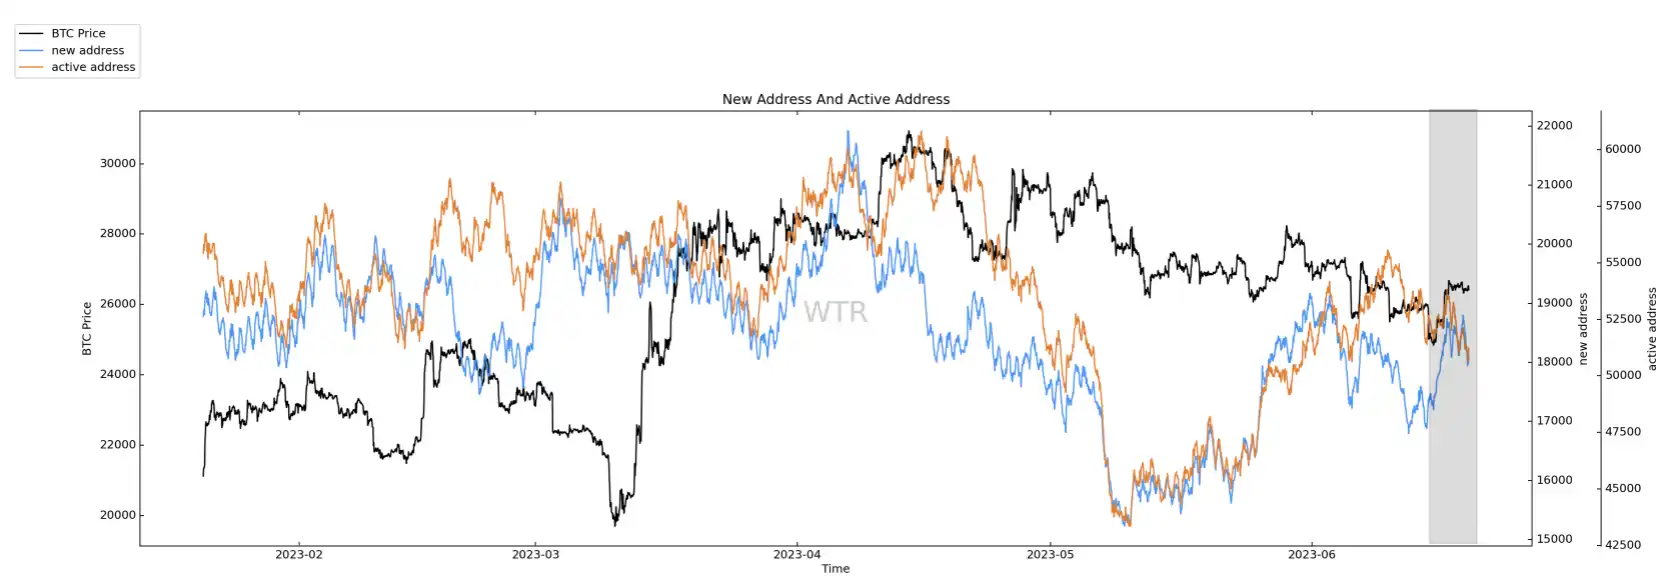
2. The newly added active addresses are in a moderate position, with average market activity.
4. The overall net position of the trading platform shows a large outflow, and the selling pressure has decreased somewhat.
5. Global purchasing power has slightly rebounded, and stablecoin purchasing power has also slightly rebounded.
6. Under-chain transaction data shows a willingness to buy at a price of 24500 and a willingness to sell at a price of 27000.
7. The probability of not breaking below 18000-22000 in the short term is 65%.
8. The probability of not breaking through 26500-29000 in the short term is 70%.
Welcome to join the official BlockBeats community:
Telegram Subscription Group: https://t.me/theblockbeats
Telegram Discussion Group: https://t.me/BlockBeats_App
Official Twitter Account: https://twitter.com/BlockBeatsAsia

 Related Articles