Recovery cycle: Where does the rising power come from?
Original title: 7 O'Clock Capital: Why Halving the Price Is Rising
原文作者:K,7 O'Clock Capital
introduction
In the beginning of 2023, BTC set sail again, and the market began to wake up. Various sectors rose in turn, among which the upgrade of Ethereum Shanghai as this year's narrative thread, the heat still continues. The application of AI is in its infancy, and gradually falls back after the short-term conceptual hype ends. Now BTC also broke through 25,000 dollars after the start of correction consolidation, after experiencing various sectors in the speculation, everyone began to look gradually to the upcoming DASH and LTC halving market, because each halving/production will break the balance of supply and demand, coupled with market speculation, there will be a large amount of market fluctuations.
Throughout the halving/production history of the market, the most attention is bitcoin, although there are other PoW tokens, but basically follow the trend of BTC, not out of the independent market. 7 O'Clock Capital has combed through eight tokens that could halve in production between 2023 and 2024 for miners and investors.
directory
Why would halving production lead to higher prices
Halving/production time line and market changes before and after
summarize
1. Why does halving of production bring price increases
Halving output is a clever design in the economic model, mainly to avoid the inflation problem and to make prices more favourable by controlling supply. Because from the perspective of supply alone, halving/output breaks the dynamic balance of output. When supply halves and demand increases at the same time, the market as a whole becomes bullish. Therefore, halving is seen as a positive boost to market sentiment. But the rise in prices caused by changes in supply alone is superficial, for two reasons.
Halving/production will give the market at least a doubling of expectations, i.e. the hype before the start, will inevitably drive market sentiment, retail investors into the price. Halving is very important for miners, mining pools and mining machine manufacturers, because halving occurs in the Token of POW, which means that the number of mining rewards is reduced and the mining cost is greatly increased. Theoretically, it will drive up the price, but at the same time, it will bring direct negative effects. If the income is reduced, Some miners will leave or turn to other mainstream tokens.
To sum up, it is generally agreed that a rally before halving is a fairly definitive feast.
Second, halving/production cut time line and market changes before and after
Halving will inevitably bring market fluctuations, but what is more worthy of our analysis is the core group behind halving tokens, so that we can concentrate funds in multiple options to ambush more potential projects. The following will sort and analyze market changes in previous years in this way, and extract rules for reference.
BTC - Miners, institutions/capital, OG;
LTC - miners, institutions/capital, OG, but overall core group strength is inferior to BTC;
BCH, BSV - miners, hot money;
ZEC, ZEN, DASH, ETC -- anonymous trading crowd (bottom of the market capitalization rankings, gradually eliminated by the market).
For halving Token, we should not only analyze the core user group, but also pay attention to its narrative. The price rise mainly depends on the entry of large funds and high certainty of transactions. If the project does not have a good narrative, even if there is a rising market, it is difficult for users to judge the expected time of entry and departure. Through the following data analysis, we can carry out the capital ambush in advance.
Halve/reduce production countdown

The impact of halving/cutting production on prices
1, BTC halved the price

summary
Bitcoin's halving cycle is characterized by a halving of bitcoin production every 4 years or so, with the halving interval being based on the halving of block rewards for every 210,000 block height increases.
Bitcoin has experienced three halving of block awards in its history. (Since AIcoin shows the K-line after 2017, the following text describes the market changes.)
In November 2012, Bitcoin block awards were halved for the first time, and a year later bitcoin topped $1,000, an all-time high;
In July 2016, the bitcoin block reward was halved for the second time. The following year (2017), the price of bitcoin rose all the way, finally breaking through nearly $20,000.
In May 2020, bitcoin halved for the third time, reaching its highest rally ever during the bull market.
Through the data analysis after halving, it can be concluded that the increase multiple from the initial stage of the bull market to the peak of the bull market is getting smaller and smaller, and the capital volume is getting larger and larger. The promotion of the bull market requires more funds to enter the market, and the previous retail market has changed to the institutional market, so it is more and more difficult for retail investors to make profits.
According to the price analysis of the early bull market, the early bull market of the next wave is more than twice the low of the last bear market, so it can be roughly predicted that the early bull market price of the next wave will not be lower than $30,000, and the highest will not be lower than $120,000. Therefore, the current price of $16,000 is a reasonable and low price, which can be considered to build positions in batches.
According to past data collection and analysis, 2014, 2018 and 2022 all started the bear market and continued to decline. 2016, 2020 and 2024 were all years when bitcoin halved, marking the start of a bull market; 2017, 2021 and 2025 are bull markets, and prices will hit new highs again.
The following is the comparison between the price of BTC at the beginning and the end of the year from 2010 to 2022. According to the price performance of BTC in the past 12 years, the market has reached a node every four years, and then it may gradually start to rise.

2, LTC halved prices

summary

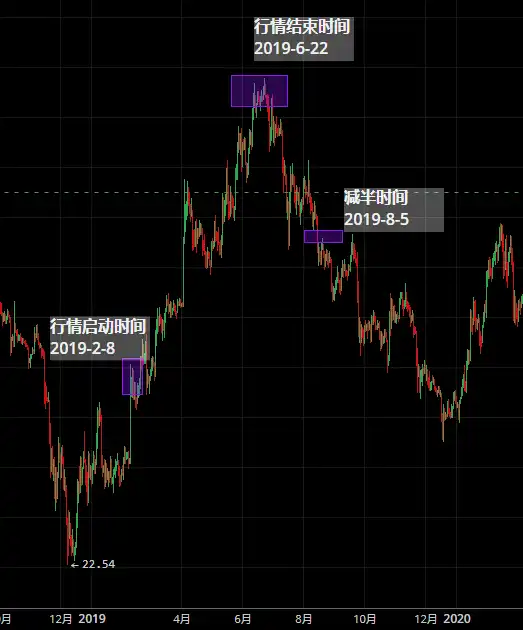
The LTC has been halved twice since its launch in October 2011. As can be seen from the above chart, LTC started 3 months in advance in 2015, and 6 months in advance in 19, indicating that the hype of half is expected to be halved in 3-6 months. The halving chance of LTC is different from the halving chance of BTC. The three halving chances of BTC are bound to start the bull market, while the halving of LTC is only the hyped expectation before the halving, and the market has ended nearly 2 months before the halving.
It can be seen from the chart K that: LTC has been around the price of 55-60 for nearly half a year, and the bottom structure is sufficient, which is the best buying point. Looking back now, with the market speculation and the market in the beginning of 2023, it has doubled fast, compared with the last half. LTC has increased more than six times from $22 in December 2018 to $146U in June 2019. It is expected that there will be two to three times more space before the market ends in June 2023.
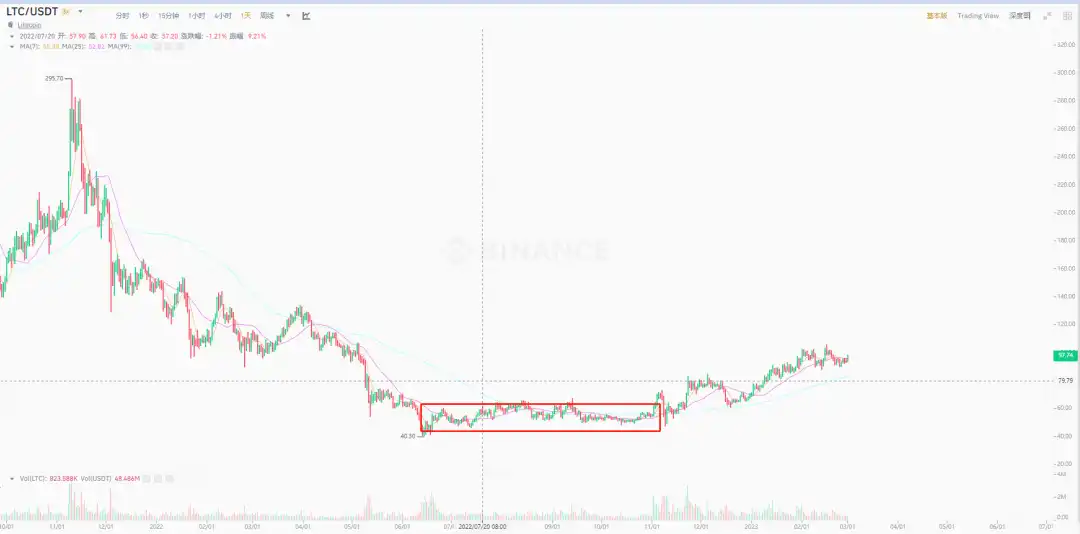
According to the trend comparison between LTC and BTC, it can be predicted that LTC will reach the peak of the band around June 15, 2023, and the distance will be halved by about 40 days:
In 2013, LTC peaked at $53.15 on November 28, while BTC peaked at $1,156.12 on December 4. In 2015, both LTC and BTC reached their lowest point on January 14, 2014, where LTC was $1.11 and BTC was $171.51. There were 408 days between the peak and the low of the LTC. The short-term band high was reached on July 10, 2015, and 177 days between the previous low of January 14, with 47 days to go before the halving on August 26. And at this time BTC market is still at the bottom of the shock, did not usher in a rise in the market.
On December 19, 2017, LTC peaked at $375.29, while BTC peaked at $20,089 on December 17. On December 7, 2018, LTC reached its lowest point at $23, while BTC reached its lowest point at $3,191 on December 15. There were 353 days between the peak and the bottom of the LTC, and by June 22, 2019, the LTC reached the short-term band high, 197 days after the previous low on December 7, with 44 days to go before the second half.
LTC peaked at $413 on May 10, 2021, while BTC peaked at $67,549 on November 9. The LTC bottomed out at $40 on June 14, 2022, and the BTC bottomed out at $15,476 on November 21, with 400 days between the top and bottom of the LTC.
It follows that
In 2015, there was a gap of 408 days between the peak and the low, and 177 days between the short-term band high, a gap halved by 47 days.
In 2019, there was a gap of 353 between the peak and the low, and 197 between the short-term band high, a gap halved by 44.
In 2023, the interval between the peak and the low is about 400 days, and it is expected to reach the band high around June 15, 2023, which is about 40 days in half.
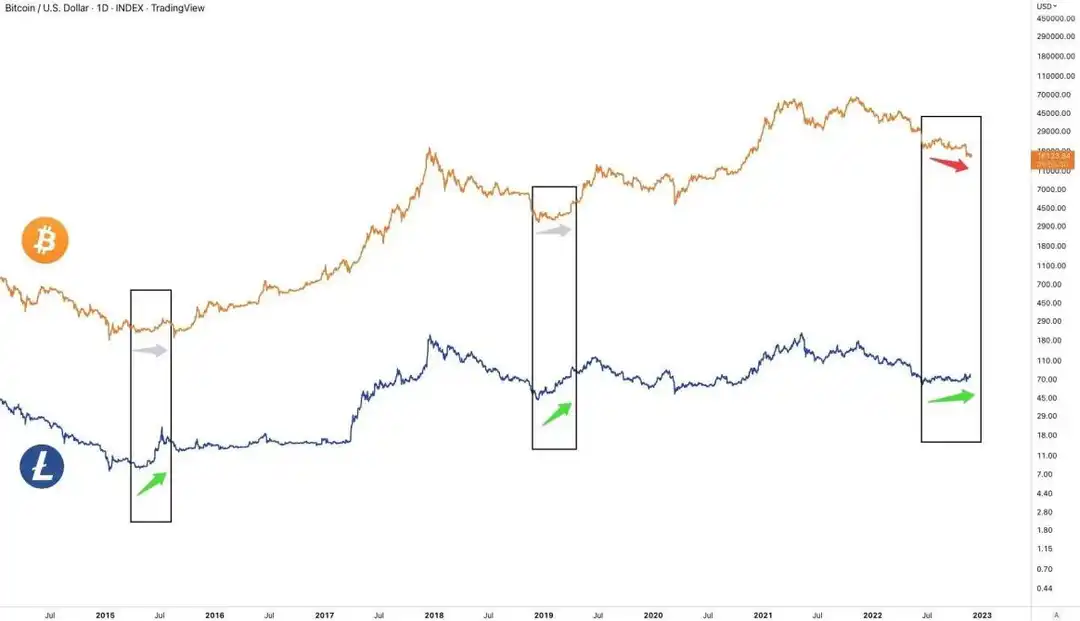
As can be seen from the following chart, in fact, in every bear market, LTC outperforms BTC. After the outbreak, LTC will have a good performance, which mainly comes from Fomo sentiment. LTC is a highly controlled project, and the whale that is highly controlled will leave the market at a certain stage for profit. In addition, LTC will be more dependent on the recovery of the overall market, and Fomo sentiment can be successfully driven. Therefore, close when good, and do a good job in stopping losses.
3, BCH and BSV halved prices

summary
On 8 April 2020 and 10 April 2020, BCH and BSV completed their first production cuts to date, with the block bonus changing from 12.5 BCH to 6.25 BCH.
BSV and BCH are similar in that both ended their halving market two months ahead of schedule.

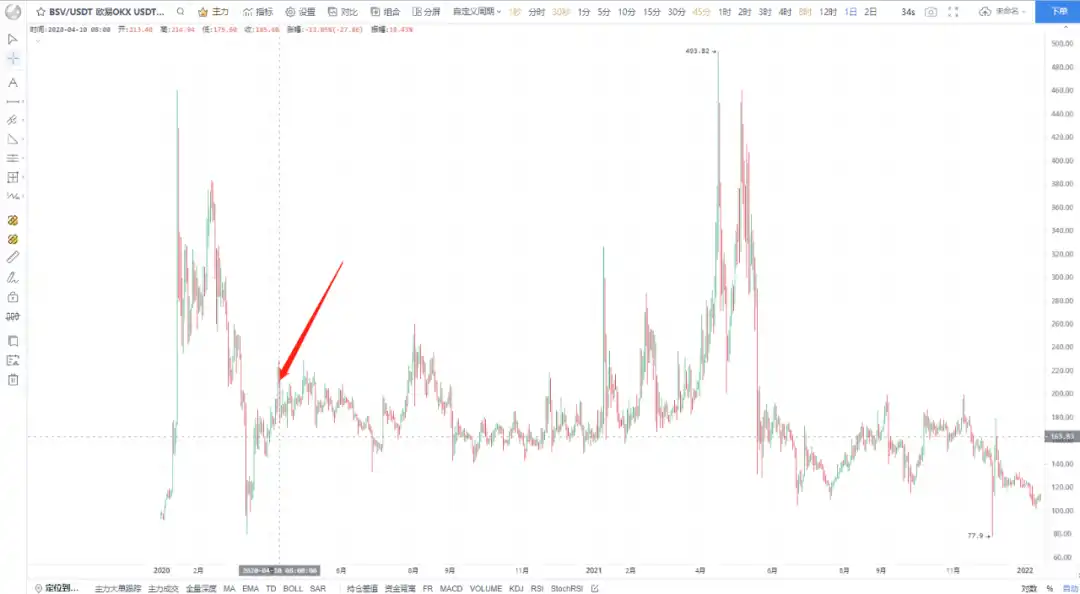
BCH and BSV have only been halved once in history, and there is no good rule to refer to at present. However, as forked tokens, there is no perfect ecology and demand, so there will not be a large upside space in the future. In the past few years, BCH and BSV have been eliminated among the top 10 tokens in market value, and the speculation expectation is relatively low.
4, ZEC halved the market

summary
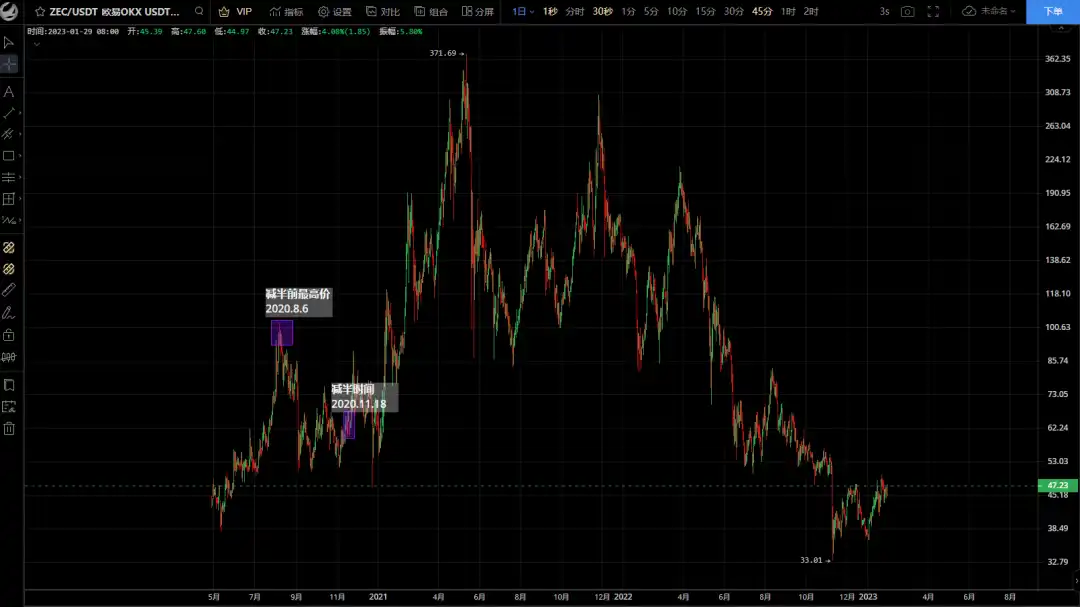
From the beginning of 2020 to the halving period, the highest increase of ZEC reached 501.17%. In the privacy Token, the overall increase was better, but in the three months after the halving period, ZEC fell by 39.47%. Meanwhile, in the nearly one week and nearly 24 hours, ZEC just followed the market and did not go out of its own independent market. After halving, ZEC prices did not show a significant upward trend until they peaked at $371 half a year later, during the bull market in May 2021.
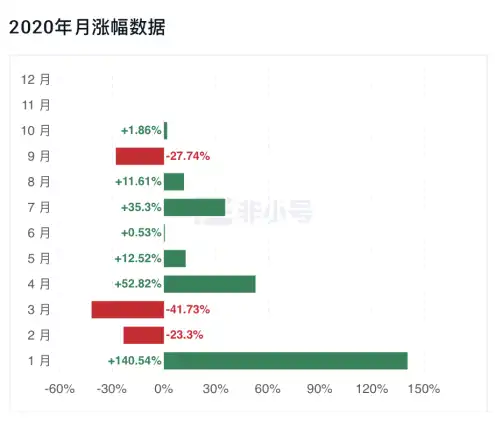
As you can see from the chart below, most of ZEC's gains were concentrated in January, when the halving concept sector was in full swing, and April, although there were also high gains, was mainly a bottoming out from the March 12 sell-off. In addition, ZEC was positively influenced by the market in August of the same year before DeFi hit a new high of half in the summer.
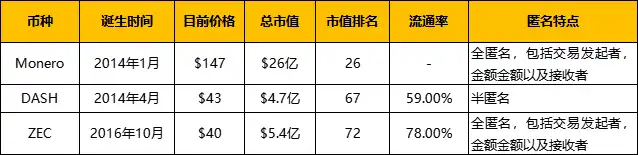
The future of ZEC will depend on whether it can successfully tap into the DeFi ecosystem and develop apps that will increase its value and position in the privacy space in the next bull market. At present, the main trend of the market is DeFi, Web3, Metaverse and other tracks. The rank of total market value of anonymous Token in recent two years has begun to fall. The rank of market value of the three anonymous tokens except for Monroe, the other two tokens have ranked No. 50. The current analysis shows that 2-3 years, it is difficult to usher in the outbreak of privacy plate.
5, ZEN halve the market

summary
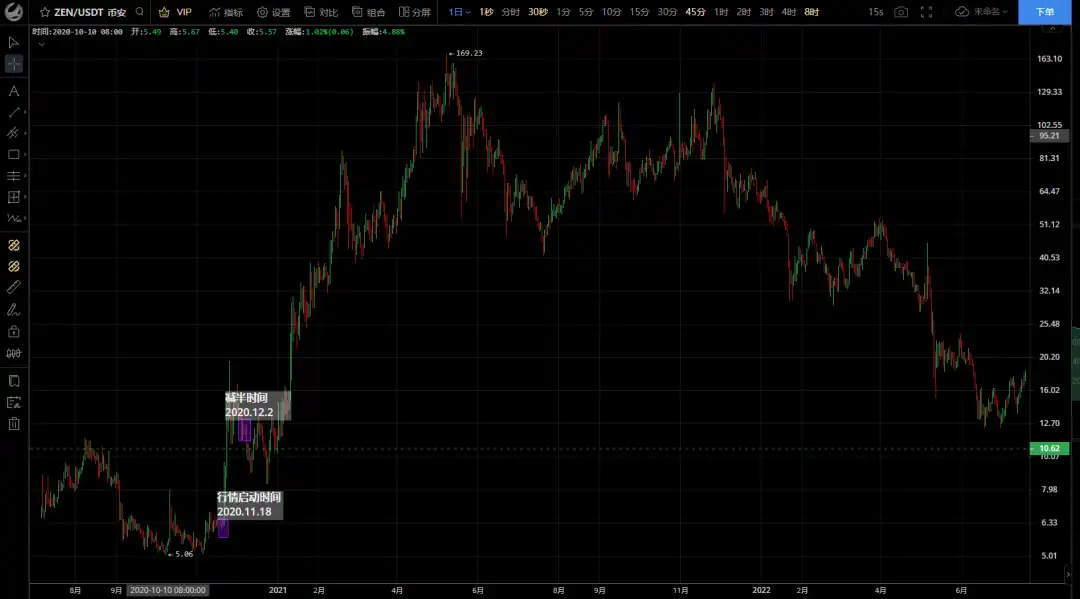
It can be seen from the above data that the performance of ZEN in the month of halving was poor. The price increase in the five months before halving did not fluctuate very much. After halving, the price of Zen began to rise along with the rising price of BTC, reaching a new high of $169 on May 8, 2021.
With the trend of BTC, ZEN's market has not gone out of its own independent market. Currently, it is also the project with the lowest market value among halving tokens. Although ZEN's gold master has ZEN trust, and the whole ecosystem also has many traditional partners, there is little chance in halving market analysis. With the development of Web3 in the future, there may be continued development, which remains to be seen.
6. DASH production reduction

summary
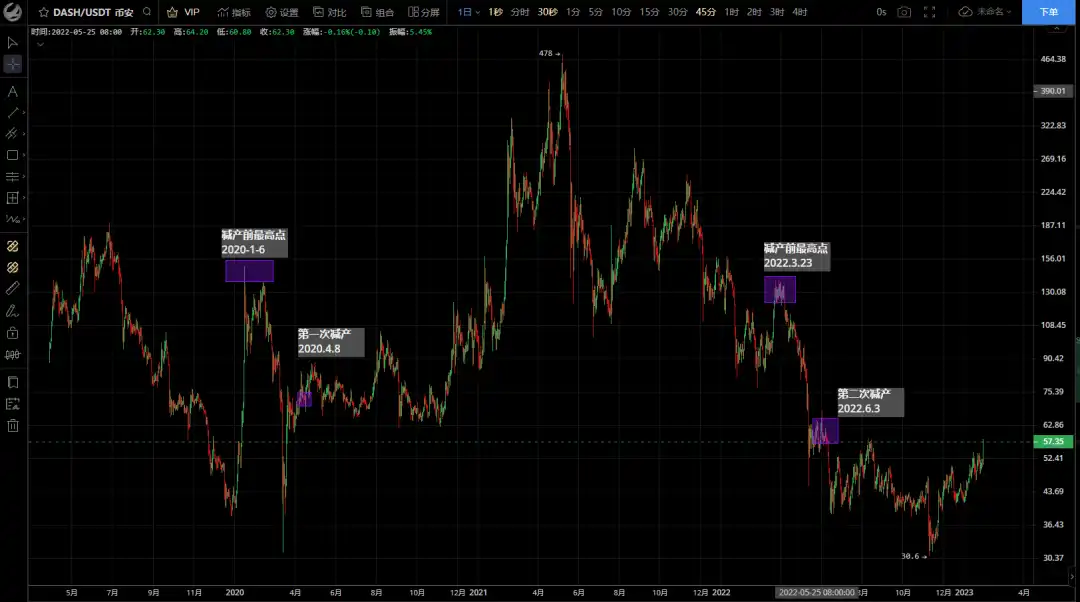
DASH is a yearly production cut, with a reduction rate of 7.14%. Before the first production cut, it reached the highest point within 5 months, with an increase of 232.06%. The trend was consistent with the market fluctuations of BTC at that time, and it did not go out of the independent market.
The second production cut was on March 23, 22, from the high of $138 to the low of $45 (May 12), which fell nearly three times, and more than ten times from the 21-year high of $478. Two weeks before the production cut, the price of DASH reached the bottom of 18 and 19 years. After cutting production, it began to fall. On November 9, 2022, the DASH bottomed out at $30 and peaked at $50 on December 13, nearly doubling in one month. In early 2023, with the rise of BTC, DASH topped $77.9, and now the correction is around $71. If BTC does not plunge, it will probably continue to rise.
From the sideways phase in 2022, DASH's cost of subscription is around $38 to $50, and it has increased by about 35%. Bullish customers can buy in batches, and expect to get about twice the revenue.
7, ETC production cut quotation
summary
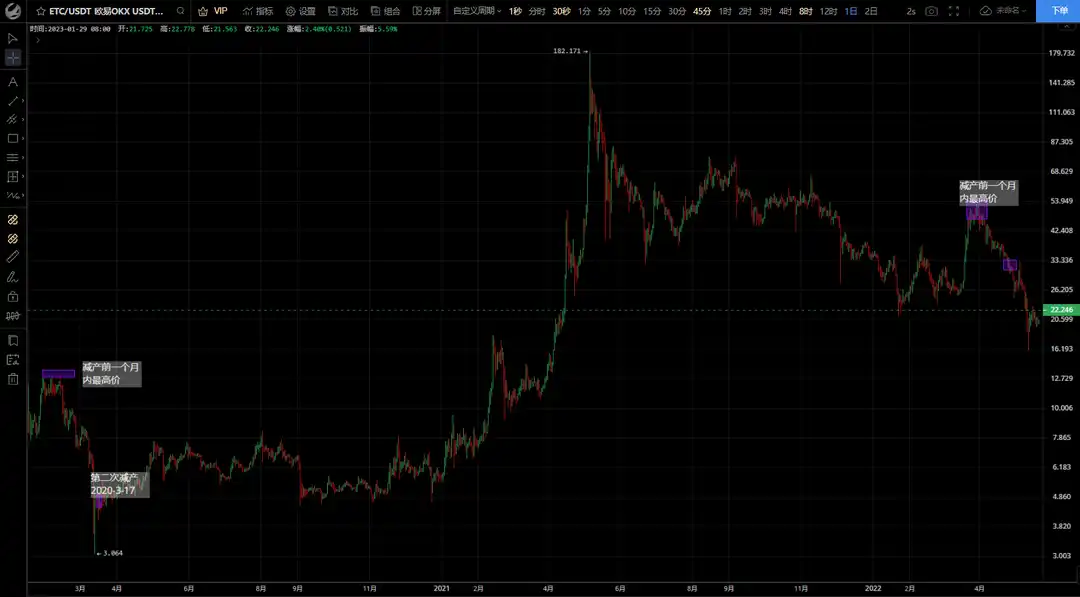
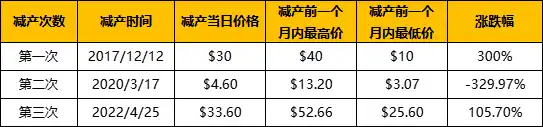
At present, ETC has completed three production cuts, each with a reduction of 20%. The first production cut rose from the bottom on November 3rd, 2017, and reached the peak on December 20th. Before the second production cut, the crypto asset market suffered a "March 12" slump. ETC fell from the highest $13.2 to the lowest $3.1 within 40 days before the production cut, with a decline of -329.97%. The third production cut was on April 25, 22. From March 16 to March 29, ETC rose 105.7% from $25.6 to a maximum of $52.66, becoming one of the few projects that performed well at that time. The upcoming production cut was clearly the catalyst for this increase. Overall performance, ETC production cut before 30-40 days have a band market.
No matter the migration of consensus mechanism, load-bearing power or production reduction, they are only a step in the development process of ETC, which cannot completely promote its better development. Especially, with the ecological development and practical application of various emerging public chains, ETC's development needs to be further improved.
Iii. Summary
Based on the halving time, the halving time will be officially launched next year. LTC and DASH will be the first to be ambushes, but the biggest profit margin should be LTC. Although DASH will be the first to reduce production, the proportion of production reduction in this currency is relatively low, so the impact is not particularly great. And this is a bear market bottoming environment, LTC is halving, DASH is cutting production, compared to the LTC hype expectations of the consensus heat is relatively higher, the last time LTC halving is up more than six times, if you missed the hype last November, the next two months is a good time to lay out.
According to the rule that the bull market starts after the BTC is halved, it can be predicted that 2024 will be the real bull market, namely: May 2, 2024. Meanwhile, in April 2024, the halving of BCH and BSV is favorable, but the halving time of these three tokens is too close to each other, so it is difficult for funds to concentrate speculation. ZEC and ZEN are in the same situation, and ETC has no competitors in halving time. There's still some room for imagination.
Halving output won't actually save prices, it needs good news, consistent with the overall picture and enough narrative.
Original link
Welcome to join the official BlockBeats community:
Telegram Subscription Group: https://t.me/theblockbeats
Telegram Discussion Group: https://t.me/BlockBeats_App
Official Twitter Account: https://twitter.com/BlockBeatsAsia

 Related Articles