Week 5 On-chain data analysis: High weight selling pressure is low and may be guided by derivatives in the short term

原文标题:《 直而不肆,光而不耀|WTR 2.6 》
原文作者: WatchToweR Crypto
Review of the week
This week, from January 31 to February 6, the highest was near $23852, the lowest was near $22715, the fluctuation range reached about 5%.
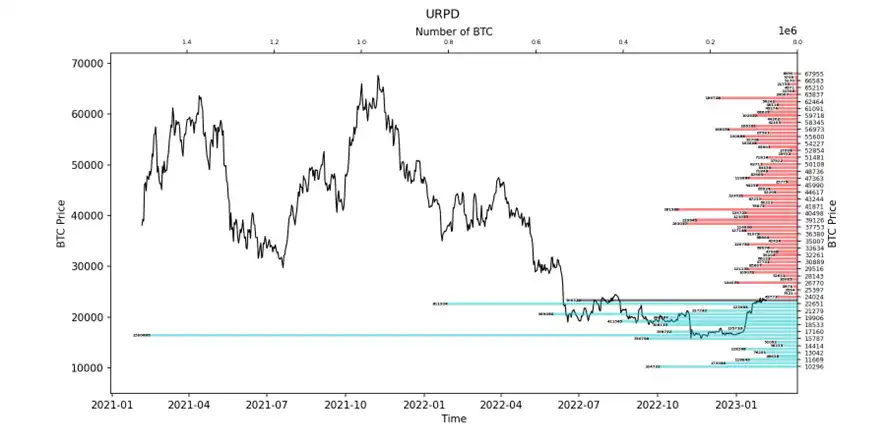
Observing the chip distribution chart, there are a large number of chips traded around $23337, which will have certain support or pressure.
• Analysis:
1. $23,000 ~ $28,000 approximately 770,000 pieces;
2. $18,500 ~ $22,500 about 2.75 million;
• The probability of not breaking 18500~20500 in the short term is 68%.
Important information
Economic news
1. Us Labor Bureau data: 517,000 non-farm payrolls added in January vs. 185,000 vs. 223,000, much higher than expected.
a. Average hourly earnings rose 4.4% year-over-year, slightly above expectations of 4.3%, showing the resilience of the U.S. labor market.
b. January unemployment rate of 3.4 percent, below expectations of 3.60 percent, down from the previous 3.50 percent.
2. Productivity -- output per hour produced by non-farm workers -- rose 3 per cent in the fourth quarter from a year earlier, according to the US Bureau of Statistics, compared with an expected 2.4 per cent.
a. Hourly compensation rose 1%, the first positive increase in the past year.
b. Hours worked edged up 0.5% in the fourth quarter, the smallest increase since the coronavirus pandemic.
c. Unit labor costs rose 1.1% in the fourth quarter, below expectations of 1.5%, marking the slowest pace in nearly two years and down from 2% in the third quarter.
3. Us January ISM non-manufacturing PMI 55.2, above expectations of 50.4, up from 46.6.
4. After the February FOMC meeting, the Fed raised the federal funds rate by 25 basis points, as expected, to 4.75 percent.
a. Terminal rate forecast lowered to 4.89 percent and year-end rate forecast lowered to below 4.4 percent.
5. The U.S. Chamber of Commerce consumer Sentiment Index for January was 107.1, below expectations of 109 and below the previous reading of 108.3.
6. Chicago PMI 44.3 in January, below expectations of 45.1 and below previous reading of 44.9.
7. The Federal Reserve's balance sheet shrank by $80.612 billion in January, with its total assets falling to $8.47 trillion from $8.551 trillion.
8. The Bank of England announced its latest interest rate decision, raising interest rates for the 10th time in a row, by 50 basis points, in line with expectations, raising the benchmark rate to 4 percent from 3.5 percent.
Encrypted ecomessaging
1. Damus, a decentralized social Nostr third-party app, has been launched, making it into the top 10 free social apps in the AppStore.
2. Indonesia's trade Ministry said it expects to launch cryptocurrency trading platforms by June.
3. PicknPay, the South African supermarket giant, accepted Bitcoin Lightning payments at all 1,628 stores.
4. German banking giant DekaBank: It will offer Bitcoin and cryptocurrencies to 1.5 million retail customers and 500 institutional customers.
5. Asset management giant BlackRock has increased its stake in crypto-friendly Bank Silvergate Bank to 7.2%.
6. Twitter applied for regulatory permission to enter the U.S. payment business, which currently focuses on fiat payment options, and will support cryptocurrency payments in the future.
7. There will be a competition for currencies, and Bitcoin is part of that competition, says Bridgewater's Dario.
Long-term insight: To look at our long-term situation; Bull/bear/structural change/neutral
Intermediate probe: To analyze what stage we are in, how long will we be in this stage, and what situation will we face
Short-term observation: used to analyze short-term market conditions; And the possibility of certain directions and certain events under certain circumstances
Long-term insight
• Position status of long-term currency holders
• Crypto futures position
• Annual profit and loss ratio
(Chart below shows the position status of long-term currency holders)
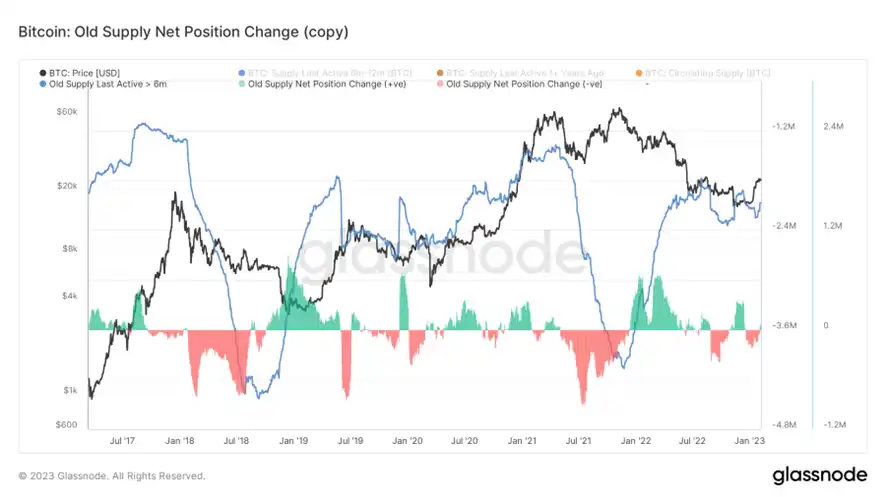
Long-term currency holders mainly show the characteristics of the group that has not sold over June.
Historically, this group has tended to show up in the mid-to-late period as a stalwart, and they sold off substantially by the end of 2021.
The formation of a vacuum zone in the market also brought pressure to the substantial growth, and the lack of support led to the collapse of the market.
After many months of wandering, such groups decided to increase their holdings again.
(Crypto futures position below)
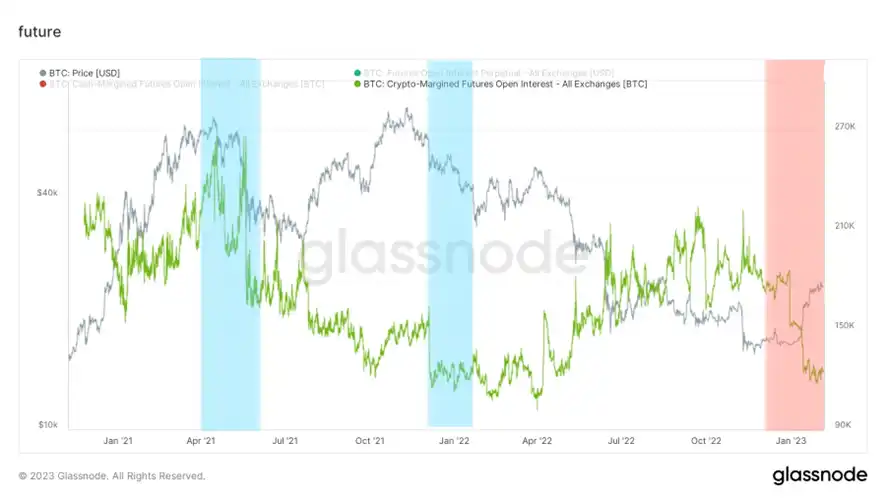
Crypto futures positions tend to represent more aggressive participants;
These participants tend to be big believers in cryptography and are based on coins.
So their directional characteristics will be more valuable for reference.
Specifically plot the corresponding area in the diagram.
• Blue zone: crypto futures hold a large percentage of bias to open long
• Red zone: Large percentage of crypto futures holders lean short
These participants, many of whom like to bet on the bullish end of a bull market, tend to be swayed by emotions.
In recent months, they have placed short bets, but the overall results have been surprisingly negative.
In the crypto futures market, they are the main fuel for this rally.
(Annual profit and loss rate below)
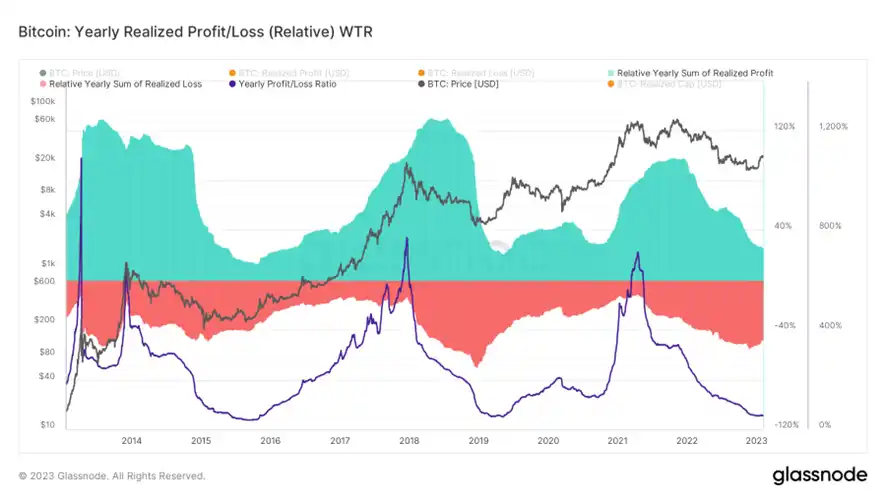
The search for consistency between cyclicality and profitability
• The average profit and loss rate of Bimodal in 2014 was 867.5%;
• Peak profit and loss ratio of 770% in early 2018;
• Peak profit/loss ratio of 709% in early 2021.
Markets have a very subtle correlation with profit and loss rates.
In other words, when the market reaches a strong profit ratio, it can have a very serious medium - to long-term impact on the market.
In terms of the decay rate, the decline of these data has a distinct regularity.
From the point of view of a certain decay rate, it can be deduced that the next major market impact change or the key point of medium and long-term transition may be more than 600% of the peak profit and loss rate.
Intermediate exploration
• Online emotional positivity
• New force
• Long-term participants and high weight selling pressure
• Illiquid supply
• accumulation coefficient
• Total stablecoins in circulation
• Purchasing power differential
Trading sentiment: Trading sentiment slowed down the growth rate, the ultra - short - term unmoved supply shocks
(The picture below shows online emotional positivity)
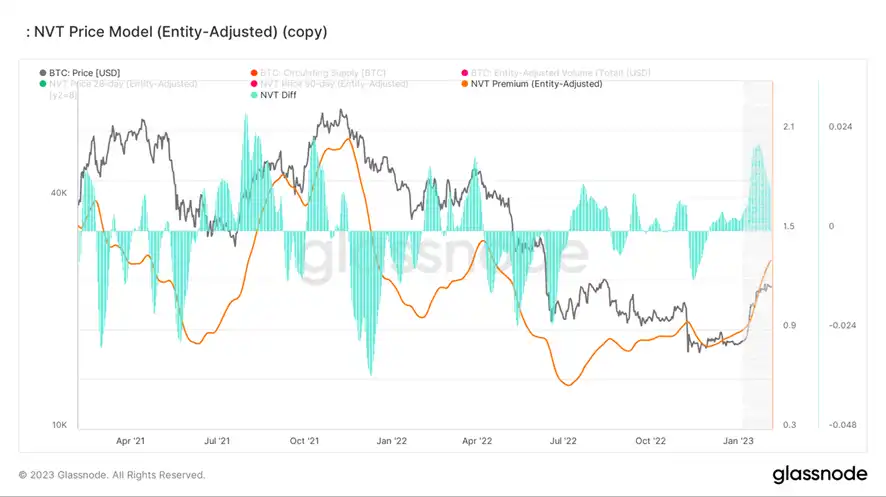
Online emotional enthusiasm is slowing down, but it is still rising.
After a two-week slowdown, floor traders may be gradually moving in the direction of rational trading.
This return to rationality may bring the medium term market into a state of stagnation.
(The picture below shows the new force)
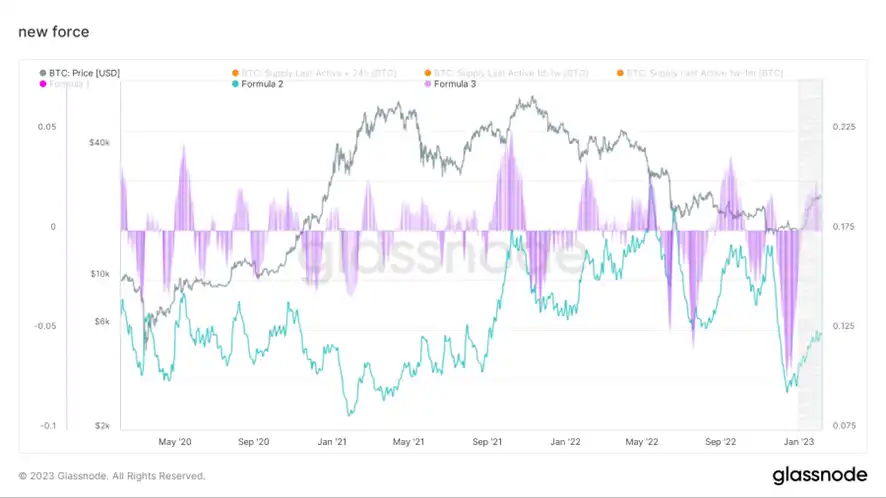
Blue line: ultra short term unoccupied supply
Purple area: ultra short net unmoved supply position
Ultra - short - term unmoved supply has a certain recent signs of turbulence.
Net position slowed slightly.
The current market may be in a state of repair by new entrants, who change their attitude and then continue to swing upward.
Perhaps this for the current market, may be in a state of repair.
Inside selling rating: slightly calm at present
(Chart below long-term participants and high weight selling pressure)
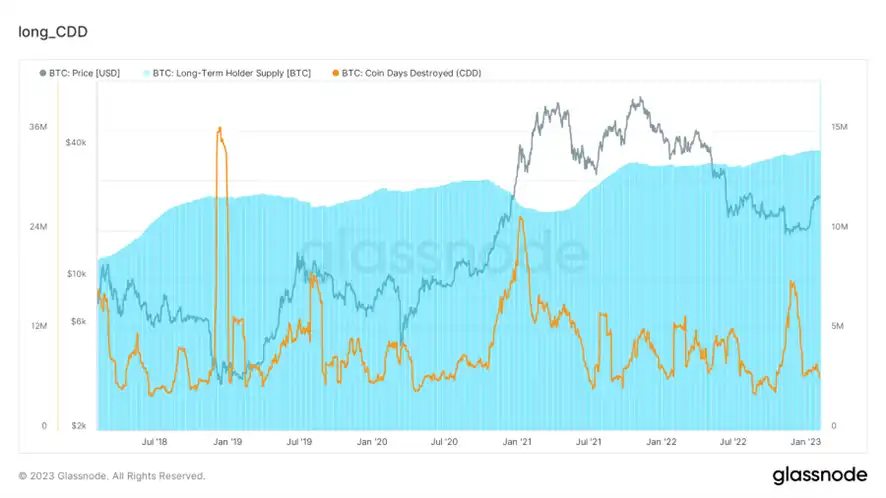
The pace of long-term traders is more gradual, the spot level of high weight selling pressure is low.
The whole course of 2022, accompanied by the imposition of high weight selling pressure.
At the same time, looking at the chart from a medium to long term perspective, it is possible that the current problem is that long-term traders are buying more slowly than in the second half of 2021.
Structural differences, may not be able to form direct guidance for the second half of the market.
But the model is mainly used to judge the conditions on the selling pressure.
Accumulation rating: Accumulation weakens
(Chart below shows illiquid supply)
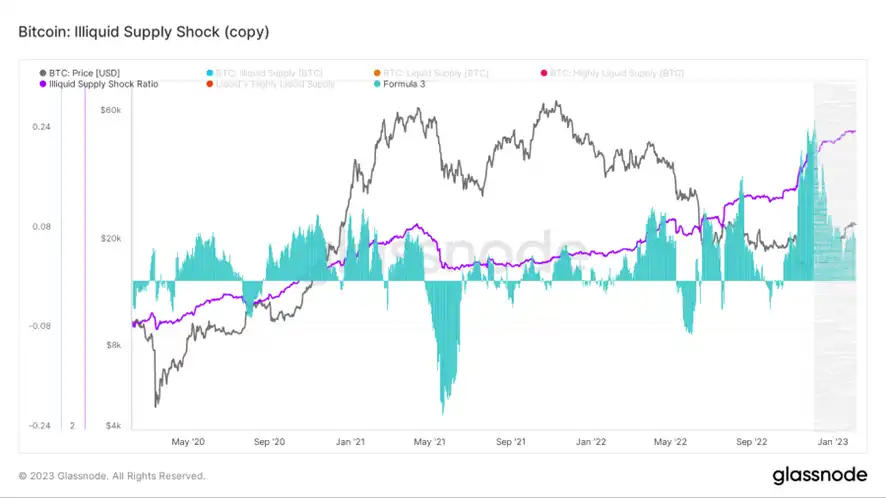
Illiquid supply has been slowly accumulating and is now somewhat stagnant.
Perhaps the current is a kind of time in exchange for space rhythm, but more slowly to kill may make the accumulation of the market speed becomes slower.
Look deep inside the accumulation situation.
(The figure below shows the accumulation coefficient)
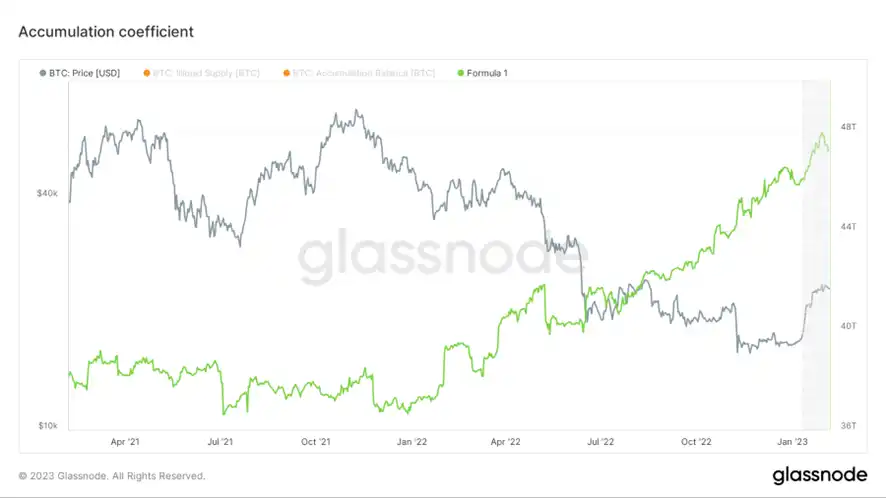
The accumulation coefficient takes into account a combination of low mobility and holding immobile Token addresses.
Judging from the current situation, it has weakened somewhat.
It may be that the return to rationality to a slightly weaker market is slow,
But looking at the current fine structure, it may be the reason why the market has weakened slightly.
Purchasing power rating: The buyers on the floor are biased towards the stock and may be suspicious of each other
(The figure below shows the total circulation of stablecoins)
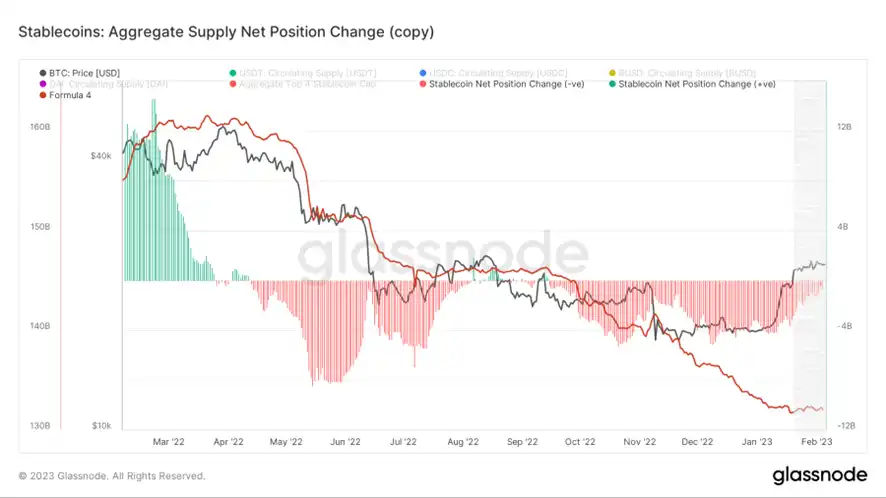
Stablecoin has contracted the outflow situation, currently in a certain range of stock oscillations.
In a stock environment, the investment effect of cryptocurrencies may be reduced.
At the same time, because the market can not constitute a consensus out of the continuity of the market, resulting in the market chips into the anxious and jealous mentality.
Therefore, in the stock state, even if the selling pressure does not appear, can not blindly remain optimistic about the situation on the floor, to take into account the participants in the floor mutual suspicion and doubt mentality, this is not a good thing for the short and medium term market.
(Purchasing power difference in the chart below)
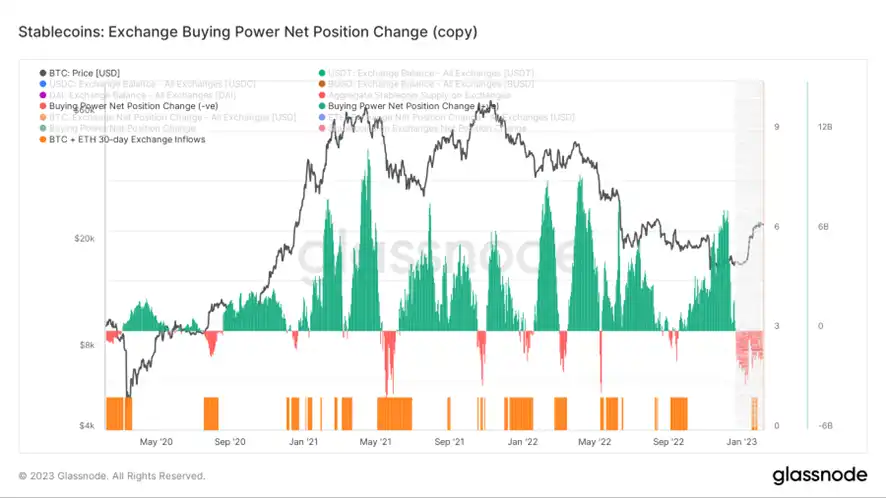
Purchasing power differentials appear to slow the outflow.
Short-term observation
• Derivatives risk factor
• Option intent to volume ratio
• Derivatives volume
• Implied volatility of options
• Option transaction structure and strike price
• Transfer of earnings and losses
• Add addresses and active addresses
• Crystal orange trading platform net position
• Net position of aunt trading platform
• High weight dump pressure
• State of global purchasing power
• Net position on stablecoin trading platform
• Off-chain trading platform data
Derivative rating: The relative decline of derivative risk
(The figure below shows derivative risk coefficient)
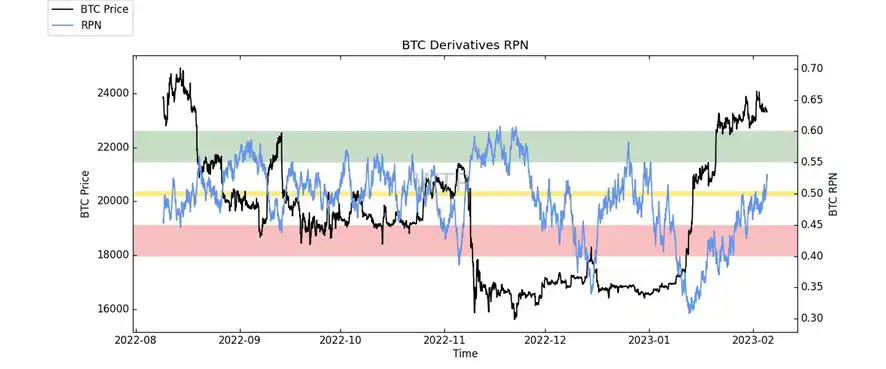
The market has been digesting selling pressure (or blowout by long futures traders) in long futures, and overall relative risk has slowly begun to decline.
The derivatives market appears to be cooling.
(Option intent to volume ratio below)
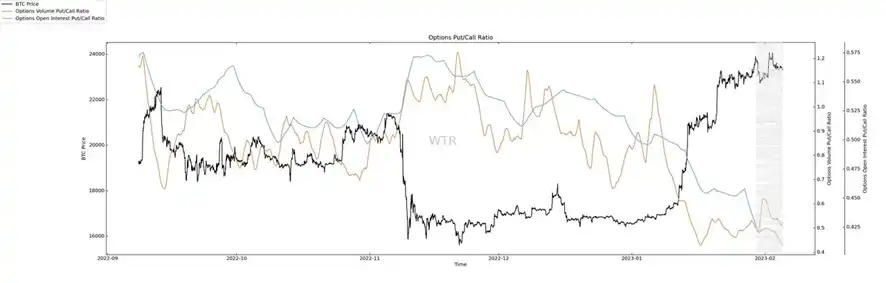
Option interest has not changed much. The proportion of call options continues to be high.
(Chart below derivatives volume)
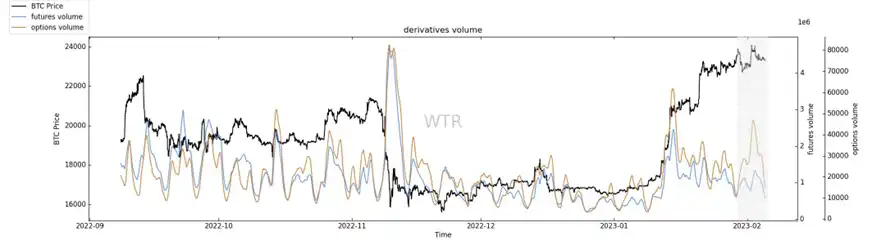
Trading volume began to fall rapidly and traders' enthusiasm for participation began to cool rapidly.
It seems that the choice of the market has begun to become wait-and-see, perhaps some macro data beyond expectations.
(Chart below shows options implied volatility)
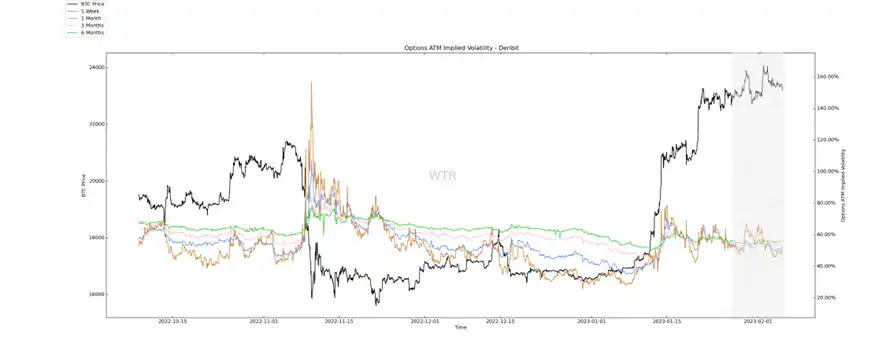
Implied volatility has also started to fall.
(Chart below shows option transaction structure and strike price)
Judging by how options are formed, it's possible that more sellers sold large amounts of call options at the high end of the market.
Concentrated price at 26,000-28000 strike price.
May also be contributing to the recent decline in IV (implied volatility).
However, once the market crosses this overall level, it may also cause sellers to buy more chips from the market to hedge the tail of the current call option due to the Gamma squeeze issue.
It will also have purchasing power.
Emotional state rating: The state starts to improve
(The figure below shows the transfer of profit and loss)
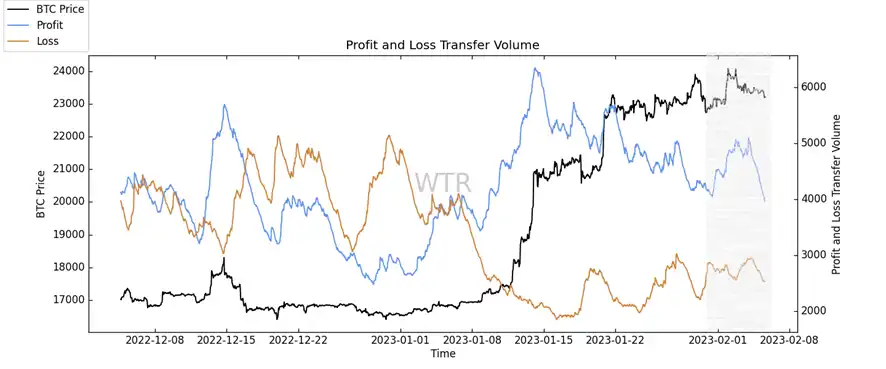
(New address and active address below)
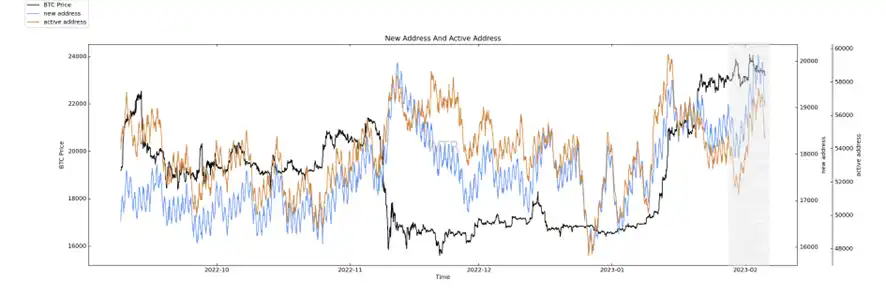
New market addresses began to be active, the overall atmosphere slowly turned stable.
Spot and selling pressure structure rating: start to appear accumulation, no high weight selling pressure
(Chart below shows net position of Crystal orange trading platform)
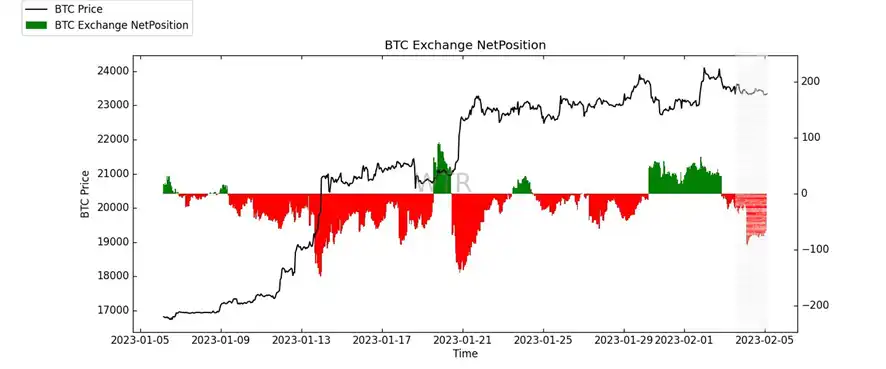
The current state of the trading platform is that there is an outflow, which is more people buying and proposing the trading platform.
It seems a good sign that more people are still willing to buy market chips at these levels.
(High weight throw pressure below)
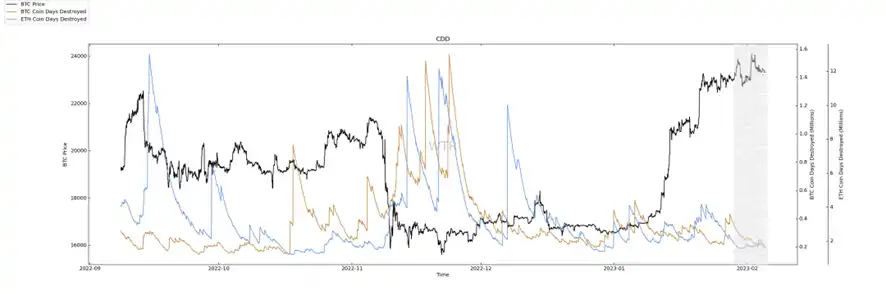
High weight selling pressure fell, and there was too high selling pressure ratio.
The current market environment is relatively good.
Purchasing power rating: Stable currency purchasing power loss, the Americas purchasing power slowdown.
(Chart below shows the state of global purchasing power)
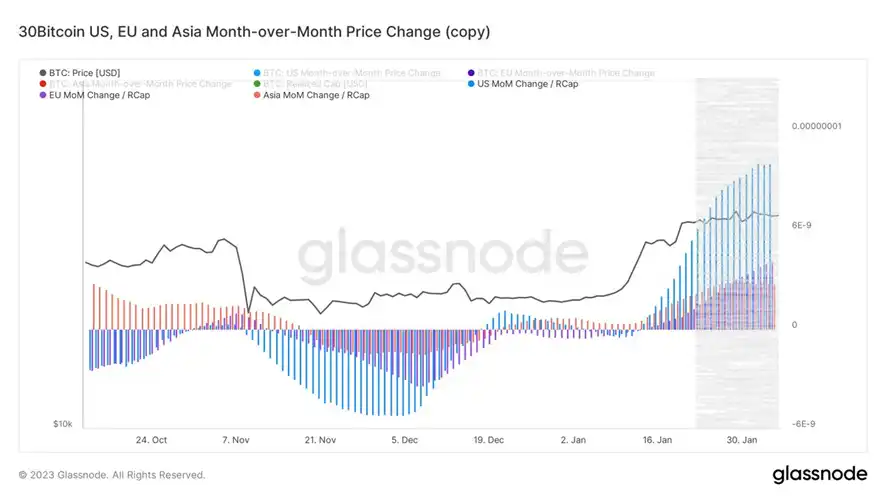
Purchasing power in the Americas continued to be relatively strong last week, but the momentum is starting to slow.
The purchasing power of Europe has a good upward trend, while the purchasing power of Asia has slightly decreased.
(Chart below shows USDC trading platform net position)
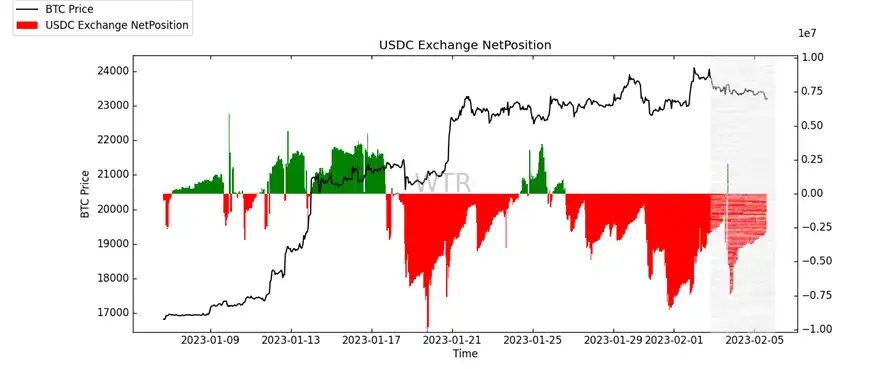
The continuous outflow of USDC in the past week shows that there is too much purchasing power to support at present.
In this case, if there is further derivative impact, the upward space may be relatively limited.
(Chart below shows USDT trading platform net position)
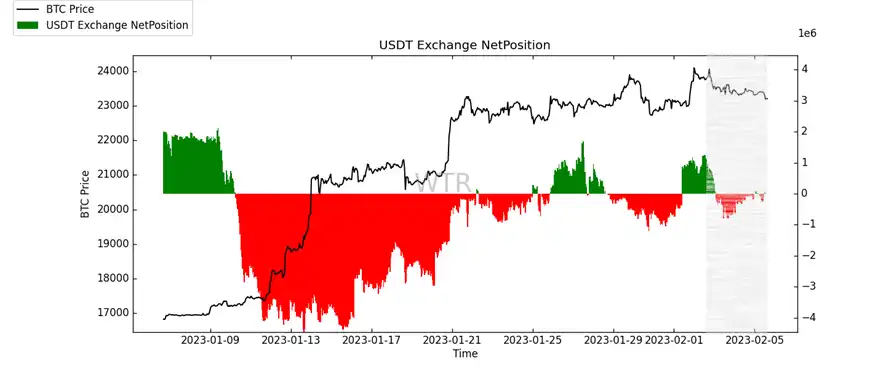
The USDT and USDC styles are different.
The inflow and outflow volume in the past week is relatively small and has no special direction to the market.
Off-chain transaction data rating :20700-21450 with purchase intention
(Figure below shows data from Coinbase chain)
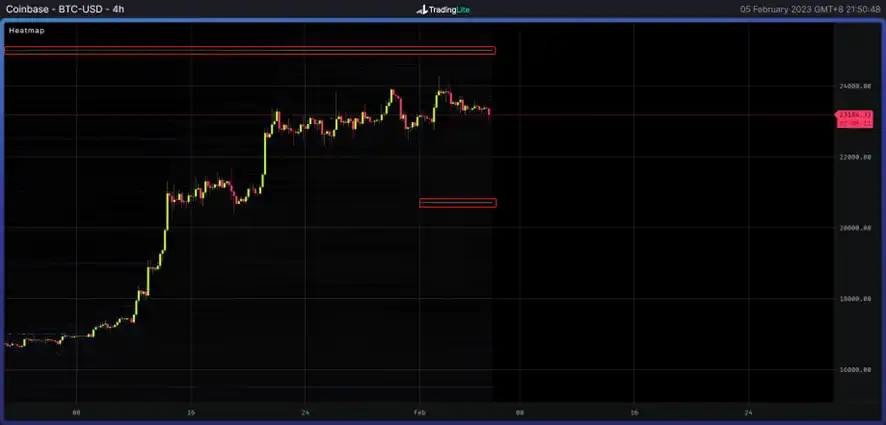
There is selling appetite at 25,000 and buying appetite at 20,700.
(Figure below shows data under Binance chain)
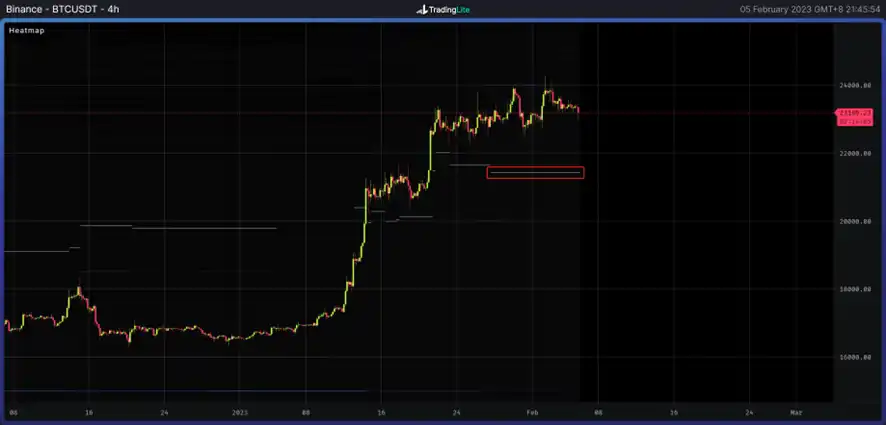
Buying interest at 21450.
(The figure below shows data under Bitfinex chain)
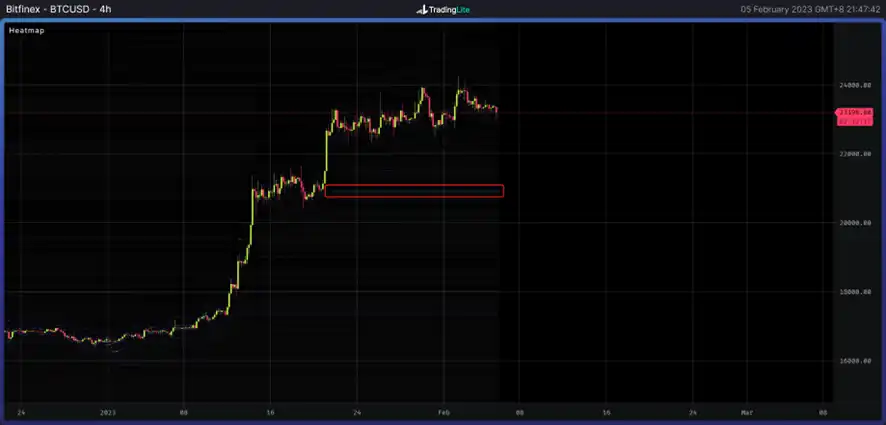
20900 level is willing to buy.
Buying intention levels are little changed from last week, but with a lot of wait-and-see sentiment, these levels are likely to be the key points this week.
Summary of the week:

Summary of message surface:
1. The employment index released this week was strong and well above expectations, the increase in labor costs was smaller than expected, and the deviation between market expectations and reality reflects possible errors and omissions of information.
2. With the decrease of inflation and the arrival of interest rate hike, the market's expectation of the terminal interest rate has been lower than the previous 5%. If this is taken as the standard, it means that there may be a rate cut this year. Watch out for Powell's speech next week and the CPI on Feb. 14.
3. After a year of tightening in which interest rates have been raised, the currency market is waiting for further rate cuts or further easing.
On the one hand, BlackRock, which has built up a 7% stake in the crypto sector of the bank, is not a low percentage for a single stock.
At the same time, some countries in the Asia-Pacific region such as Indonesia began to actively encrypt trading platforms, as well as Germany, one of the leading countries in Europe, also began the deployment of encryption business and retail brokerage.
The overall shift has begun to show momentum, and the gradual shift in national policies is one of the fundamental factors behind the start of the cycle.
The ultimate trend in encryption is still far off, but the most basic financial payment facilities are likely to be rolled out in the next three to six years.
Grasping the turning point of expected transformation is an important factor to magnify the effect of research and judgment.
The worst may already be digesting, perhaps even passing.
Long-term insight on the chain:
1. Long-term currency holders who have not sold in more than 6 months began to increase their holdings slightly after wandering for several months;
2. In the crypto futures market, short selling by currency standard participants is the main fuel for this rally;
3. When the market reaches a strong profit ratio, it will have a very serious medium - and long-term impact on the market;
4. It can be deduced that the top change of the next cycle or the key point of medium and long-term transition may be more than 600% of the peak profit and loss rate.
• Market tone setting:
The initial calm, major futures participants were liquidated, the next big short squeeze may take some time.
Mid-chain probe:
1. Trading sentiment slows down;
2. The ultra-short term unmoved supply presents a shock upward movement;
3. Long-term participants increased their holdings slowly, and the high-weight selling pressure was lower;
4. The accumulation situation is slightly weakened;
5. Stock buyers may be suspicious of each other;
6. Purchasing power differentials within trading platforms slow outflows.
• Market tone setting:
Accumulation slightly weakened, suspicion
In the middle of the last two weeks there has been some change, the market is still relatively slow, at the same time, the stock buyers on the floor may be caught in the suspicion.
Strategy advice: This may not be the time for too aggressive a long strategy
Short-term observations on the chain:
1. The relative decline of derivatives risk, and the market derivatives traders step into the wait-and-see;
2. More sellers are selling call options at $26,000 - $28,000;
3. Market sentiment is in good shape;
4. The data of the trading platform shows an accumulation state, and there is not much high-weight selling pressure;
5. The purchasing power of the Americas began to slow down, and the purchasing power of stablecoin continued to lose;
6. The off-chain transaction data shows purchase intention in 20700-21450;
7. The probability of not breaking 18500~20500 in the short term is 68%.
• Market tone setting:
The market began to gradually stabilize, and there was too much selling pressure, the volatility may not be large in the short term.
In the short term it may be more guided by derivatives.
Strategy suggestion: The strategy with small trading space is better.
Risk warning:
The above are market discussion and exploration, and do not have directional opinions on investment; Please treat carefully and prevent the market black swan risk.
This article is from submission and does not represent the views of BlockBeats.
Welcome to join the official BlockBeats community:
Telegram Subscription Group: https://t.me/theblockbeats
Telegram Discussion Group: https://t.me/BlockBeats_App
Official Twitter Account: https://twitter.com/BlockBeatsAsia

 Related Articles