Bear Market Alchemist: A really active Web3 application in terms of Gas consumption
What are the seeds of the bear Market's Web3 apps still active on the Ethereum chain?
Terry, Blockchain in Plain English
Since the London upgrade on August 5, 2021 (block height 12965000), in combination with the fee destruction mechanism, all types of on-chain activities (Token transfers, NFT casting, etc.) of Ethereum have contributed to the combustion of ETH from an economic model level.
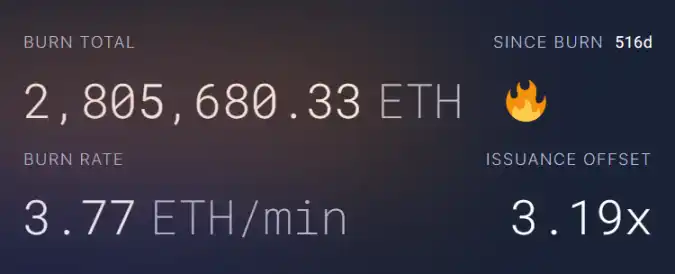
Each "basic commission fee" will be destroyed directly, reducing ETH supply in the whole network, which is equivalent to bringing "deflationary dividend" to all coin holders. According to ultrasound.money:
As of January 4, 2023, the total amount of Ethereum destroyed in 516 days has exceeded 2.8 million pieces, with a total value of nearly $3.4 billion. The annual amount of Ethereum destroyed is about 2 million pieces, with an average of 3.77 ETH destroyed per minute.
01 Overall Gas consumption ranking
The Ethereum network consumes 2 million ETH in a year through Gas fees, which applications (smart contracts) are the main Gas consumption? Let's take a quick look at the top 10 overall.
Unsurprisingly, the largest number of applications that destroyed Ethereum were Gas consumption for Ethereum transfers -- over 253,000 ETH were destroyed since the London upgrade, accounting for around 9.03% of the total.
This is followed by OpenSea (buying and selling NFT collectibles), which has destroyed over 230,000 Ethereum pieces since the London upgrade, accounting for around 8.21 percent of total destruction; Meanwhile, OpenSea (trading contract) also ranked sixth, consuming over 70,000 ETH Gas.
Therefore, if the two are combined, the total Gas cost of OpenSea is more than 300,000 ETH, accounting for more than 10%, surpassing Ethereum transfer, ranking the first place.
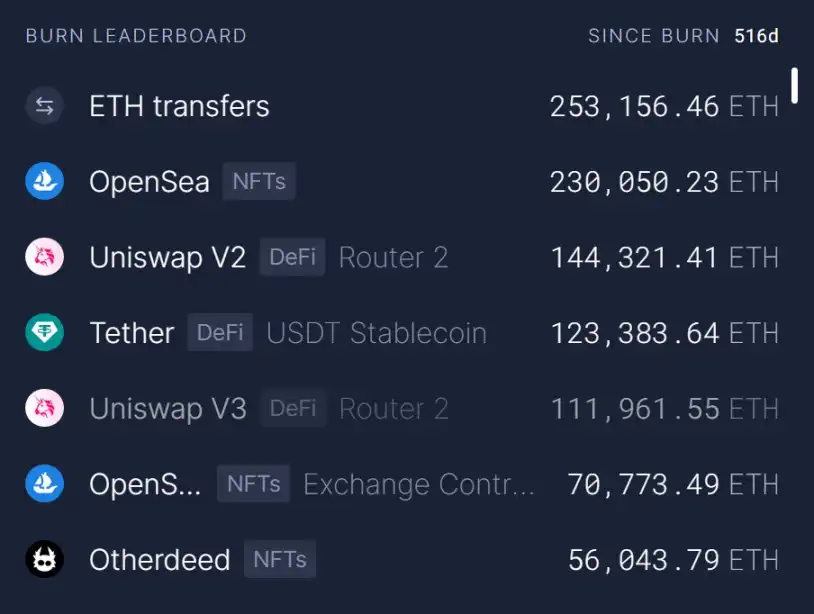
Uniswap V2 and Uniswap V3 ranked third and fifth with 5.15% (144,300) and 3.99% (11,900), respectively. USDT, which ranked fourth, consumed 123,300 units of Gas, accounting for 4.4 percent.
It was followed by Yuga Labs' Otherside metaverse project, which ranked seventh with 56,000 ETH. MetaMask built-in Swap also consumed 54,000 ETH, ranking 8th. USDC ranked ninth with 51,000; Another routing contract from Uniswap V3 ranked 10th with 47,800 units.
In terms of the total data, in addition to the basic Ethereum transfer, the top of the overall leaderboard are OpenSea, Uniswap, USDT and other well-known head projects. The total consumption of top 10 Gas in the leaderboard is basically more than 50,000 ETH. The top 27 applications all consume more than 10,000 ETH.
02 Which tracks have the highest Gas consumption?
Further, we can analyze and observe the specific distribution track of ETH Gas consumption and head items, which also hide the most active seed players in the bear market.
(1) DeFi track: Uniswap and other DEX are at the core
DeFi is a central pillar of the Ethereum ecosystem, and DEX, which is used to facilitate the exchange of assets and liquidity flows across DeFi, is central to DeFi.
So Uniswap, as the "DEX carrier", contributes almost the majority of DeFi's Gas consumption. If all data from V2 and V3 (including routing contracts for different transactions) are combined, Uniswap's total Gas consumption is over 300,000 ETH. It accounts for 10.86% of the total ETH consumption of Ethereum.
After Uniswap, the next DeFi project is the DEX aggregator 1inch v4 with a total Gas consumption of over 25,000 ETH; This was followed by 23,000 ETH for SushiSwap and about 16,000 ETH for 1inch v3.
Other than DEX, DeFi also has few other categories on the list.
(2) NFT track: Otherdeed stands out
In the NFT circuit, OpenSea, as the leader of the trading market, has a relatively stable position, so we analyze it by specific NFT projects.
According to Oklink's statistics, we can intuitively see from the chart below that the daily Gas consumption of Ethereum network is closely related to the trend of the market -- it was high almost simultaneously in 2021, but since 2022, especially after the crash of Terra in May 2022, Prices and sentiment in the secondary market are down, and Gas consumption is down a notch.
However, May 1 was an exception, with 80,000 ETH consumed in a single day, a record high and far exceeding other highs.
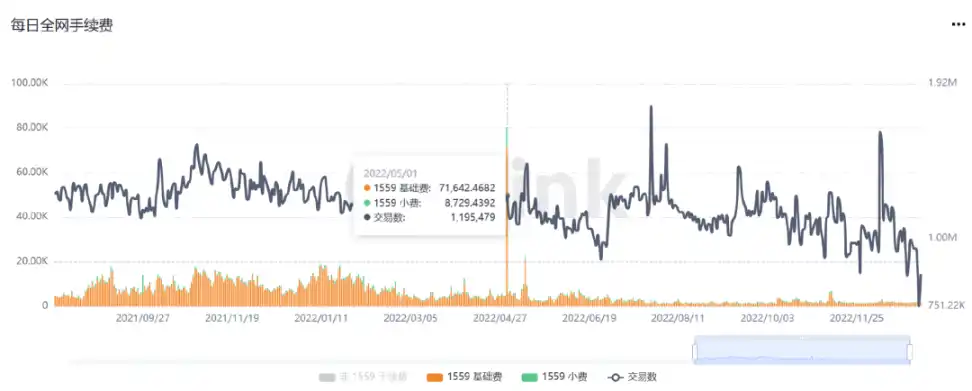
However, as can be seen from the above chart, the number of Ethereum network transactions did not surge significantly on the same day, so it can be seen that Ethereum transfers were not the main force of ETH consumption on that day. So what happened on May 1st?
At 9:00 on May 1, Yuga Labs metaverse project Otherside block NFT Otherdeed opened casting, a total of 55,000.
This caused Ethereum Gas costs to rise to nearly 10,000 Gwei at one point, contributing to the absolute proportion of Gas consumption. For the eight months to date, Otherdeed ranks seventh with 56,000 ETH consumed. If the average monthly consumption is measured, Otherdeed was also able to leapfrog Uniswap V3 into the top five.
After Yuga Labs launched Otherdeed for Otherside, weekly transactions on Ethereum hit $1.6 billion in early May, well ahead of any other month last year, according to Nansen.
In addition, the second ENS series Gas consumption of 24,000 ETH, Otherdeed in the entire NFT circuit is unique.
(3) Stablecoin track: USDT and USDC remain at the forefront
While NFT, DeFi, and DAO have taken center stage in cryptocurrencies over the past few years, Stablecoins have been quietly growing in the background.
The USDT ranks first with 123,300 ETH total Gas consumption, followed by USDC with 51,600 ETH total Gas consumption. Other stablecoins are hard to find.
ultrasound.money data also show that USDC surpassed USDT ($32.29 billion) at $41.12 billion, as measured by TVS.
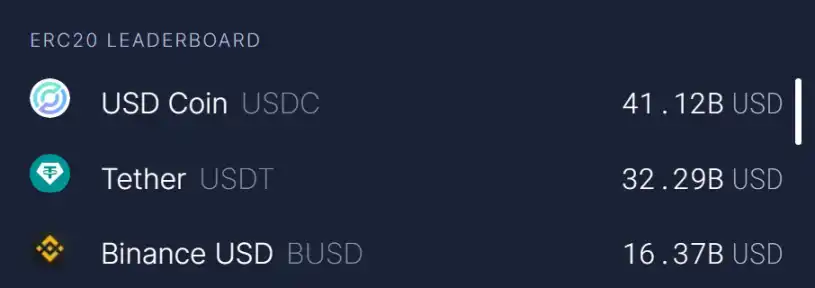
Overall, the USDC leads by a wide margin in many on-chain data dimensions. As the most liquid stablecoin on DEX, the most deposited in the money market, the third most liquid across the chain bridge, and the most widely used stablecoin by DAO Treasury and asset backing, it is clear that while the USDC is only the second largest stablecoin in the market by market capitalization, to date, USDC is the most used on-chain stablecoin in the crypto world.
Other track applications such as the MEV Bot and Polygon Bridge also consume more than 10,000 ETH.
03 summary
To sum up, in 2021, Ethereum completed the London hard fork upgrade and opened the era of Gas destruction; In 2022, it will enter the PoS era through merger. From November 9 to December 1, 2022, ETH supply entered the deflationary zone for the first time since the merger, and changes took place in a difficult and gradual fashion.
In the New Year of 2023, the foreseeable Shanghai upgrade is expected to take place in March, when the planned opening of the beacon chain pledge ETH withdrawal, and what kind of impact on the Ethereum network and the track, let's wait and see.
Original link
Welcome to join the official BlockBeats community:
Telegram Subscription Group: https://t.me/theblockbeats
Telegram Discussion Group: https://t.me/BlockBeats_App
Official Twitter Account: https://twitter.com/BlockBeatsAsia