22 charts defining the crypto market and Web3 development in 2022
2022: 22 Graphs That Defined the Year for Crypto
Original article by Lewis Harland
Kate, MarsBit News
Every year at this time, Decentral Park takes a step back and reflects on the crypto market and the evolution of Web3 over the past 12 months.
2022 has been a remarkable year for cryptocurrencies.
Following tradition (and popular demand), we've compiled a list of the year's key trends, why we think they're representative, and where we see the future.
Without further ado, we bring you: "2022:22 charts that defined the year of cryptocurrencies."
"Happy holidays and happy New Year!
- The Decentral Park Team"
1: Daily trading volume
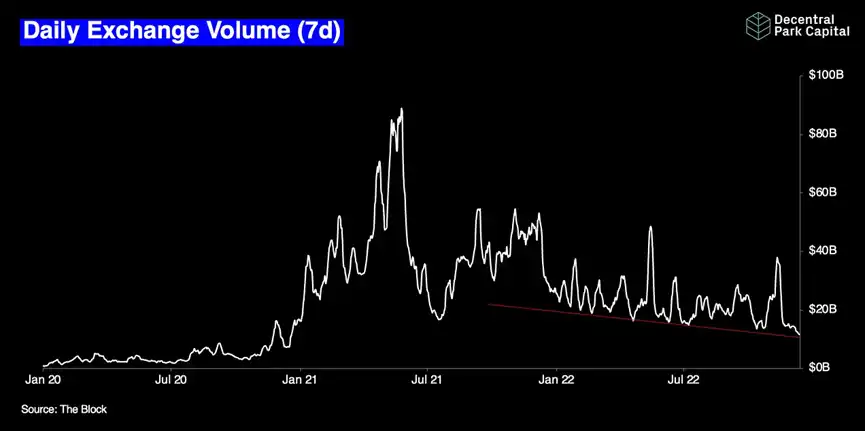
Content: Global daily trading volume (in dollars) on cryptocurrency trading platforms since January 2020. This important indicator has been a good proxy for market interest rates and liquidity. The trough in trading volume coincided with the trough in sentiment.
Defining why: We can see that this indicator has continued to decline through 2022, with low peaks and lows (now $11.7 billion). Macroeconomic factors and a couple of capitulation events in 2022 mean that market rates and liquidity are heading south.
Where do we go from here? Volume will continue to correlate with price movements. With the reasonable possibility of a global recession in 2023, trading volumes in the first half are unlikely to remain above $20bn. As markets expect lower interest rates, economic momentum may shift.
2: Crypto market cap vs. Fed net liquidity
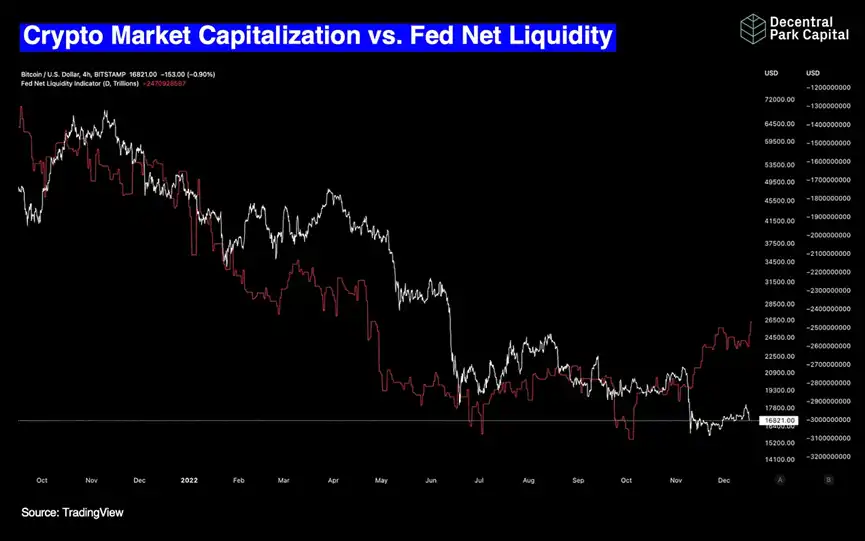
Content: Global cryptocurrency market capitalization and Fed net liquidity. Net liquidity is defined as the Fed's balance sheet, minus TGA accounts and overnight reverse repurchase agreements. The large changes in the TGAs and RRPS since 2020 mean that taking these factors into account is important to actually measure the available liquidity that can circulate in the economy.
Why it's defined: The theory states that market liquidity cycles (and M2 supply) have been driving crypto asset markets since their inception. Central bank tightening to limit prices (e.g. QT) had a negative impact on net liquidity in 2022.
The startling correlation between crypto markets and net liquidity means that a key driver of crypto asset performance over the past year has been the market liquidity cycle -- at least in the US. The recent divergence since November reflects the FTX's impact on the crypto asset market.
Where do we go from here? Greater funding competition (through the combined effects of QT and higher interest rates) could mean more dollars flowing out of the Fed's reverse repo facility. However, more than $2 trillion reflects excess liquidity in the system, and the Fed is likely to do more. The Fed will continue to trim $95 billion a month from its balance sheet in the coming months, which means the market is skewed to the downside. The Fed's net liquidity should return to trend, and cryptocurrencies will face an uphill battle into recession.
3: Cryptocurrencies and the Nasdaq 100
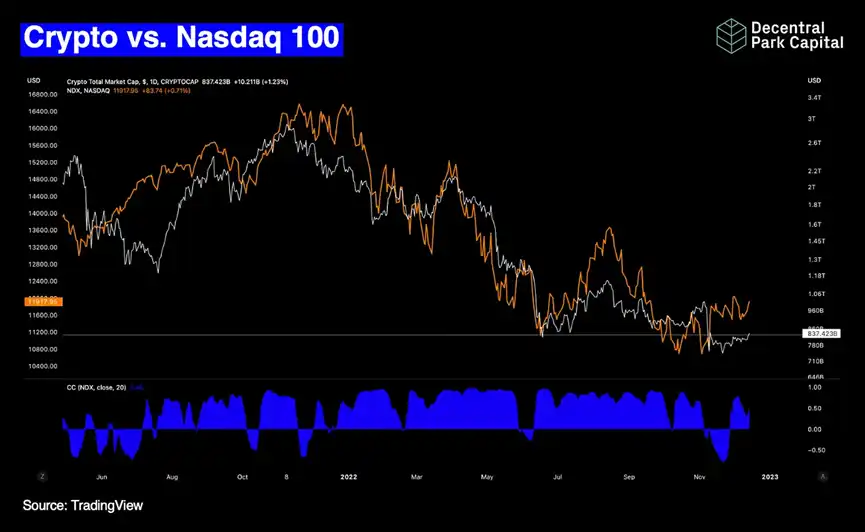
What it says: For most of 2022, cryptocurrency market capitalization was positively correlated with growth tech stock indexes like NDQS, but not always.
Why it's defined: The Terra/Luna/3AC crash caused the cryptocurrency market to drop 23% in May. When LUNA plunged from $82 in mid-May, the NDX fell 8 percent, indicating a relatively close relationship between the two markets.
It also suggests that cryptocurrencies have a negative bias - there are clear examples where the cryptocurrency market will fail to gather momentum after LUNA or FTX crashes, while NDX will recover with more optimistic macro sentiment (see positive correlation breakdown). A down day for NDX could also mean a down day for cryptocurrencies.
Where do we go from here? The same pattern will continue until 2023. From now on, any black swan event or highly contagious event in the crypto space will lead to more negative correlations after the event, as negative sentiment within the crypto space is stickier than outside.
4. Global flow of crypto funds
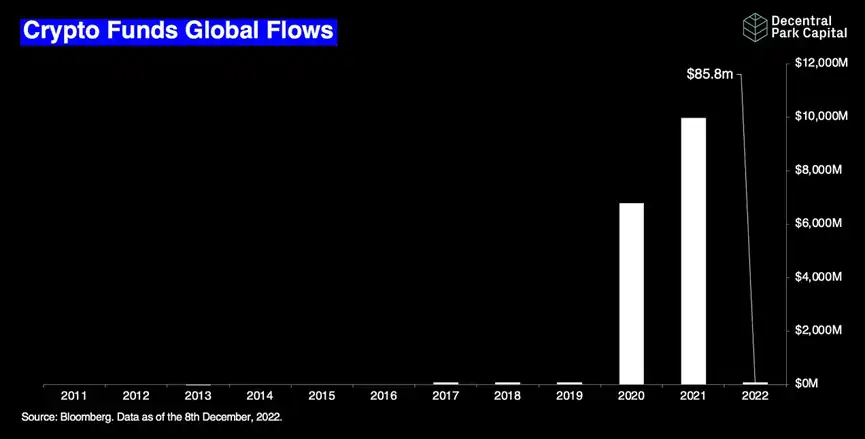
What: Total global inflows into cryptocurrency funds since 2011. Total funding flows were $85.8 million (as of December 8) -- down 99% from 2021's total.
Define why: It reflects a collapse in investor interest in the cryptocurrency market, as risky assets take a "back seat" to allocation. It also shows the popularity of cash carry trades at Grayscale Trusts, which end in 2021. Despite the pullback, there are still plenty of ETPs sucking up cash.
Where do we go from here? If the market expects a rate cut, flows will increase ($1 billion +) in 2023. If the long recession does eventually end, it will take years to get back to 2021 levels.
5: Binance trading volume advantage vs. BUSD supply
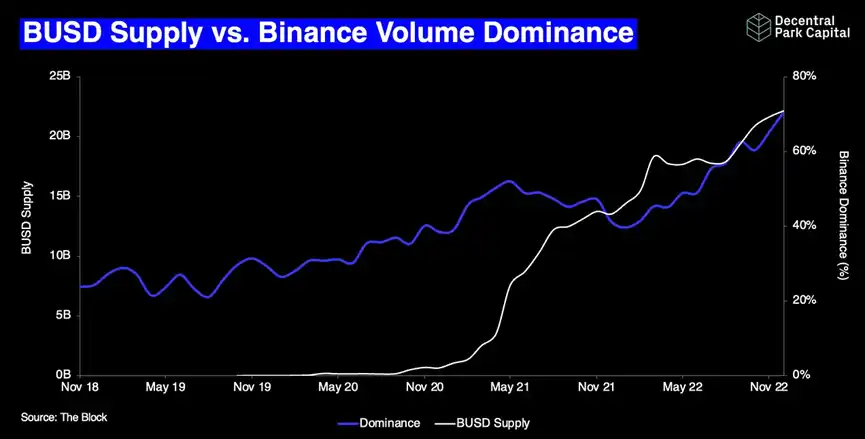
Content: Binance's BUSD supply grew to an all-time high of 22.2 billion, while Binance's transaction volume advantage rose to an all-time high of more than 60%.
Definition: This increase in BUSD supply illustrates Binance's continued blitz of expansion and out-of-the-box product strategy in 2020. This includes the automatic conversion of USdcs to BUSDs for users in September to "improve capital efficiency". Binance, meanwhile, continues to dominate the CEX market in terms of volume. The collapse of its main rival, FTX, certainly helped, but the upward trend was already apparent.
Where do we go from here? Binance's strategy is being questioned as USDC withdrawals are now being generated due to slow traditional banking infrastructure (requiring BUSDs to sell it for cash and buy USdcs). A lack of adequate audits, regulatory pressure and a more sceptical market could see Binance's dominance eventually wane in 2023.
6: BTC to achieve volatility
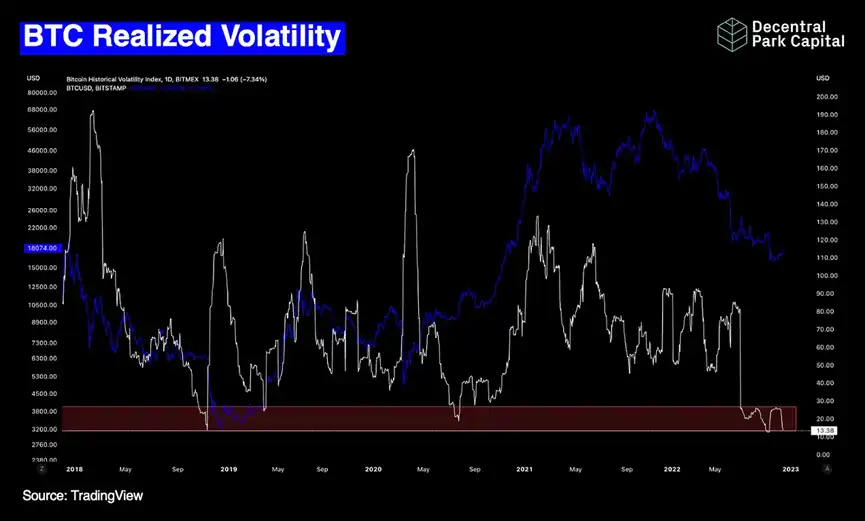
Content: Bitmex's 7 D BTC achieves a low VIX in the second half of 2022.
Why it's defined: BTC (beta) vol remained relatively high in the first half of 2022 and continued the same pattern throughout 2021. Strong deleveraging events (including LUNA, 3AC) since May have reduced speculative activity. The clearing of user account balances, such as FTX, could further dampen volatility in an already fraught market.
Where do we go from here? Actual volume has fallen to near year lows (13.5) and remains in areas that typically precede high volume actions. Given the ongoing macroeconomic, regulatory, and collateral pressures in the crypto asset market, the tilt is downward.
7: UST/USD vs. LUNA
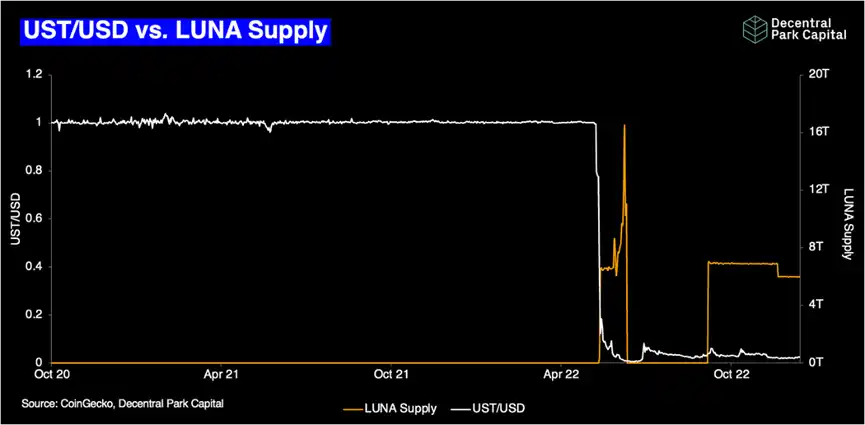
Content: Terra's UST pegged to the dollar vs. LUNA Supply. On May 7-8, UST began to lose its hooks as a large number of stablecoins began to leave the Curve. On May 9, the Luna Foundation Guard attempted to protect the UST peg by deploying $1.5 billion. With LUNA as the ultimate backer of UST, we've seen LUNA's new circulation skyrocket. 16T units.
Why it's defined: It represents the final nail in the coffin for the "pure" algorithmic stablecoin experiment. The "pure" aspect means that in just 4 days, it's all over for Terra.
It has also drawn the attention of regulators and investors. Just four months later, a House committee drafted legislation to regulate stablecoins, imposing a two-year ban on algorithmic stablecoins like UST.
Where do we go from here? A market increasingly hungry for fully secured stablecoins. Companies such as Circle will use this momentum to double down on their existing TradFi relationships. As for Terra - but a distant memory. We also found evidence of FTX's role in the network crash.
8: L2/ Ethereum L1 TVL ratio
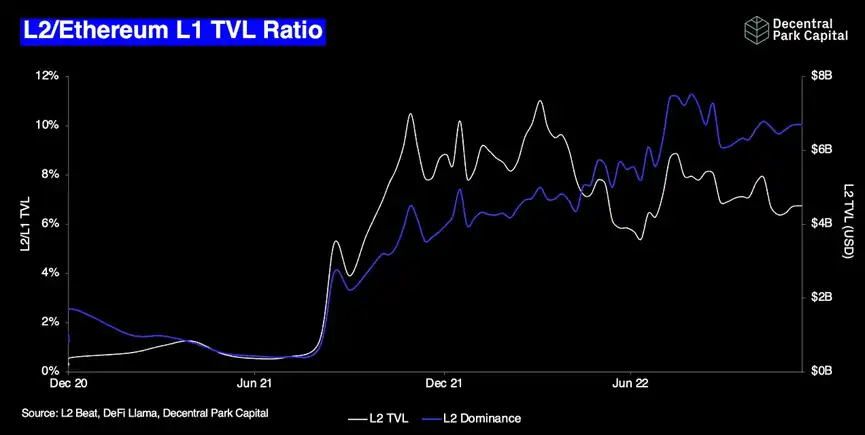
What: The total value lock (TVL) on L2 exceeds the TVL on Ethereum L1. Despite the decline in dollar-denominated TVL (in line with the direction of the broader market), L2's dominance climbed to an all-time high (7.8%).
定义原因:它表明,在 2022 年,L2 比 L1 保留了更多的锁定价值。新 L2 网络 Token (例如 Optimism)的推出及其流动性激励模型是 2022 年持续增长的关键驱动力。L2 正在成为以太坊的未来。
Where do we go from here? The L2/L1 TVL ratio climbed to a record high in 2023. 15%), due to the fact that gas costs may be lower in L1, but there is still a desire to trade on a more scalable basis (as has been the case for multiple periods throughout 2022).
9: L2 TVL/Alt L1 TVL dominance
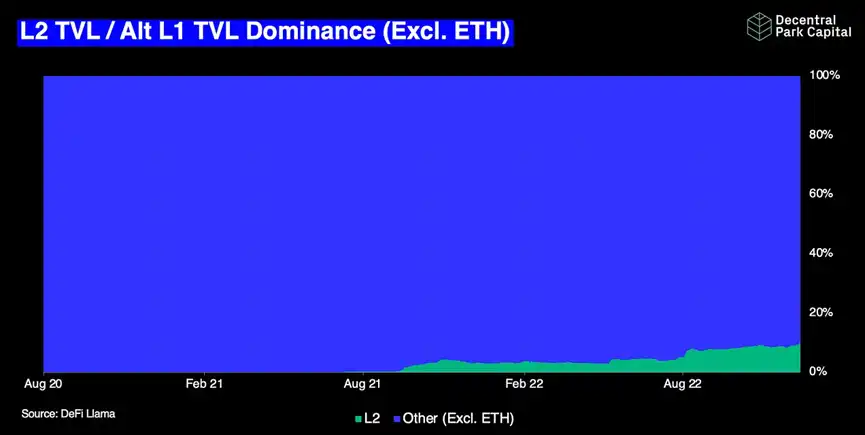
Content: The dominance of L2 total value lock-in and Replacement L1 (Alt L1) grew from 3% to 10% in 2022.
Why it's defined: The technical and philosophical battle between Ethereum L2 and alternative L1 has intensified over the past 12 months. Due to the continued growth of rollups, 2022 marks the first real increase in L2 liquidity relative to the alternative blockchain. This chart implies that all roads lead to Ethereum based on current trends.
Where do we go from here? A proliferation of rollups and incentive schemes will push this up through 2023. TVLS outside L2 will begin to consolidate around app chain structures like Cosmos, where a data availability layer like Celestia can support growth in both segments.
10: GBTC premium vs. BTC/USD
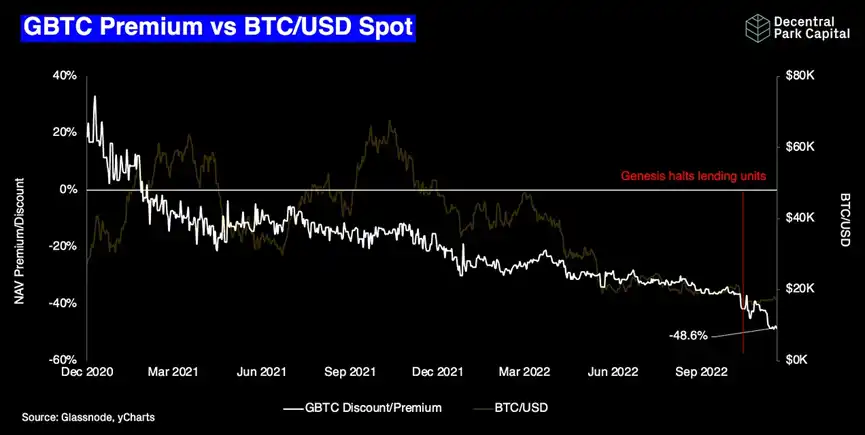
What: Grayscale's GBTC premium to NAV makes new ATL in 2022.
Defined Reason: Grayscale's cash carry trade is no longer viable in early 2021 due to oversupply. The bear market has deterred net new investors, who have access to better alternatives to cryptocurrency investments, while private investors continue to sell their shares.
In 2022, it was revealed that a large number of GBTC shares had been used as collateral for large funds, such as 3AC, which had fallen 85% in value from their peak in February 2021. The widening of the discount accelerated after Genesis discontinued its lending business and investors feared that DCG/Genesis might be forced to sell ($600 million to $800 million in encrypted collateral) to raise cash. The truth is that these events have only accelerated the previous discounting trend.
Where do we go from here? The lack of public information makes it difficult to predict the outcome. If the GBTC collateral comes from Genesis (as opposed to DCG), there is a greater risk that the lender will be forced to sell more than 2.5 years of stock to repay creditors. The unwinding of Reg M or Grayscale trust would result in up to $11.2 billion of bitcoin being sold on the market. Oh, and the Securities and Exchange Commission won't be approving the switch to physical ETFs anytime soon.
11: ratio of DEX to CEX trading volume
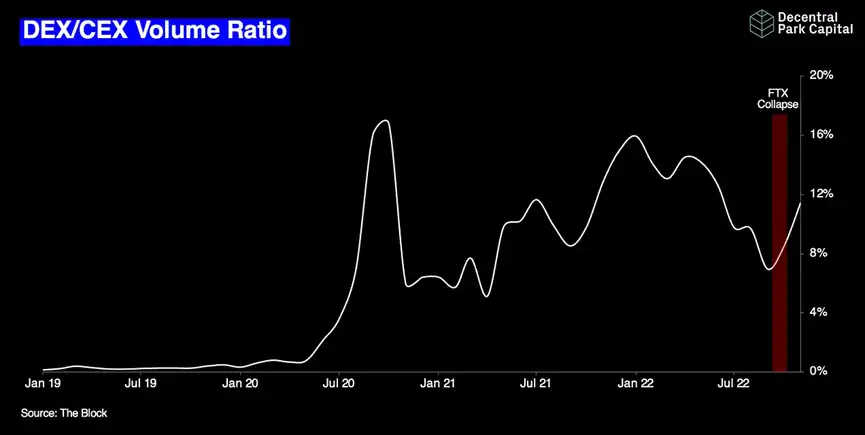
Content: Global decentralized trading platforms outpaced centralized trading, growing from 9% in September to 11.7% in November.
Defining reason: After a bear market in DEX activity, growing concerns about centralised participants and asset safety drove a reversal in the DEX/CEX ratio, with the biggest jump occurring in the month of the FTX crash. By the end of 2022, the change in the ratio reflects a change in self-hosting sentiment among users.
Where do we go from here? A market that readdresses the issue of trading security. The DEX/CEX ratio is likely to stay below 15% for a while, but the ratio is unlikely to fall to new lows since 2020. If that happens, regulatory pressure on DEX teams and users could be the driver of the latter.
12: Bitcoin STH-SOPR
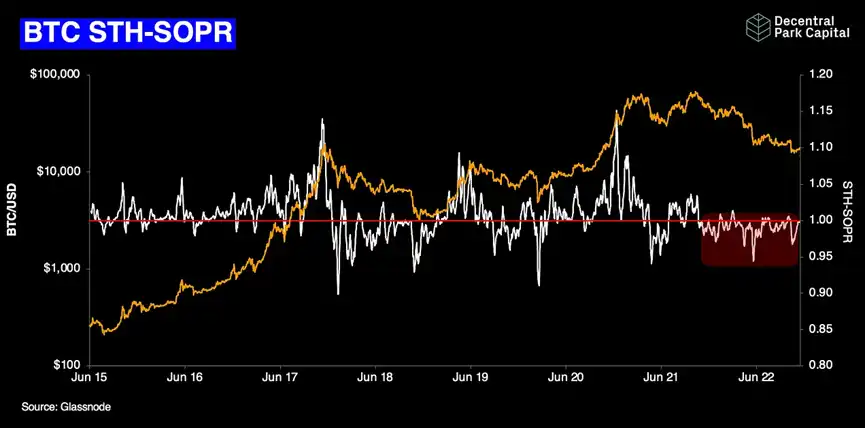
内容:到 2022 年,比特币的短期持有者支出产出利润率 (SOPR) 将被抑制在 1 以下。该指标反映了链上所有 Token 的实现利润程度。
Definition: The use of short-term holders of SOPR provides insight into the mood and behavior of traders who have just entered the market. SOPR uses 1 as resistance for a secular bear market, while using 1 as support for more bullish periods. Every rejection 1 in 2020 shows that, on average, short-term traders are selling bitcoin near their cost basis or at a loss at every opportunity (every market rally during the year).
Where do we go from here? STH-SOPR has been held back below 1 until more constructive markets develop, which may start when markets first "smell" looser monetary policy.
13: Global stablecoin quantity and supply
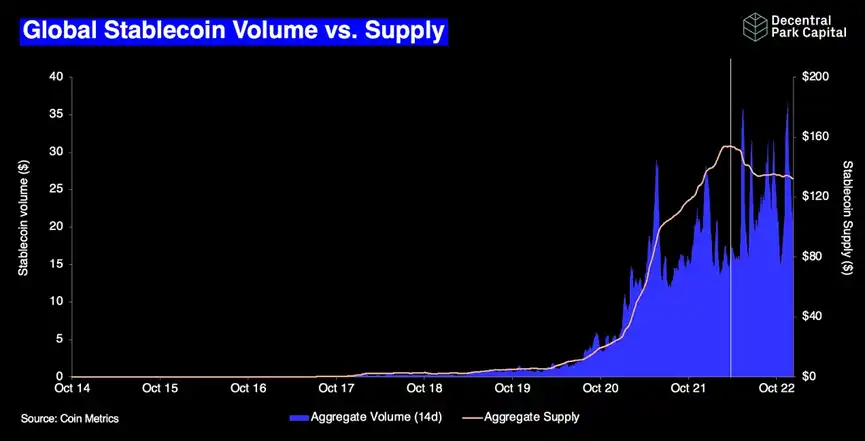
Content: Total amount and total free circulation of stablecoins. The total will triple in size by 2022 ($35B; 14d MA), while the global free circulation of stablecoins fell 14 percent over the same period.
Why it's defined: In 2022, Stablecoins showed that they achieved true product market fit even during bear markets. Despite severe deleveraging and the collapse of primary trading platforms, we are seeing higher volumes. Higher volumes and lower supply mean that fewer stablecoin units are traded more frequently (at higher speeds).
Where do we go from here? Maintain current trends until 2023. Total daily stablecoins peaked at $40 billion, while lows remained above $20 a day.
14: DeFi/ETH ratio
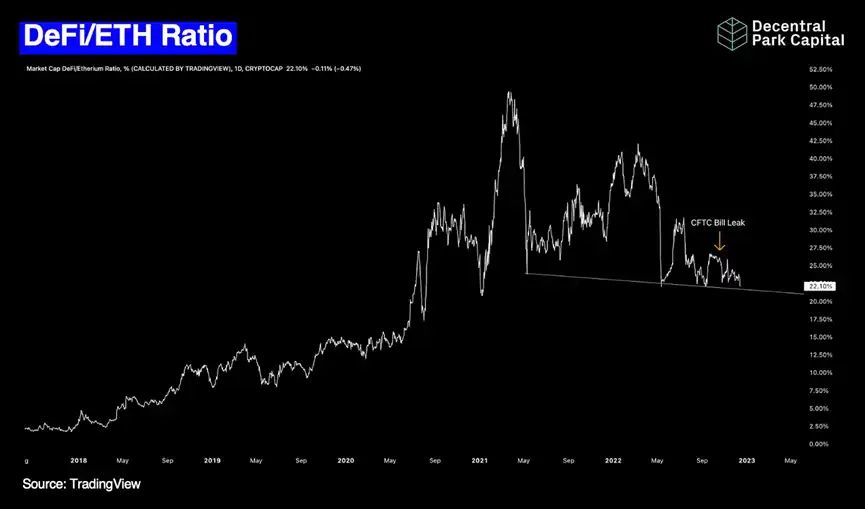
The DeFi market cap /ETH market cap ratio has recorded lower highs and lower lows in 2022.
Defining why: It highlights the struggle the $35 billion DeFi industry in 2022 is going through relative to the broader crypto market. DeFi's market cap has fallen 82% from its November 2021 ATH level ($200 billion), a faster decline than ETH (beta).
This summer, the collapse of Terra and the impact of 3AC and centralised lenders paved the way for the single biggest fall in the ratio. However, regulatory headlines, such as the leaked CFTC bill in mid-October, similarly had an impact, resulting in a 4 percent decline in the ratio, even though the industry grew by $10 billion over the same period. As a result, investors have started to reduce their relative allocations to the sector because of increasing regulatory pressure.
Where do we go from here? The DeFi/ETH ratio is unlikely to exceed 25% in the short term. The deleveraging of the market is likely complete, which means high declines may level off. That said, investors allocate assets to major institutions as more liquid agents kick in during the next adoption cycle, which is likely to put continued pressure on the ratio in the near term.
Still, the industry continues to push ahead, with many household names embracing the blockchain, such as Disney and Starbucks. DeFi has also benefited greatly from the integration of CeFi.
15: U.S. personal income vs. global NFT transactions
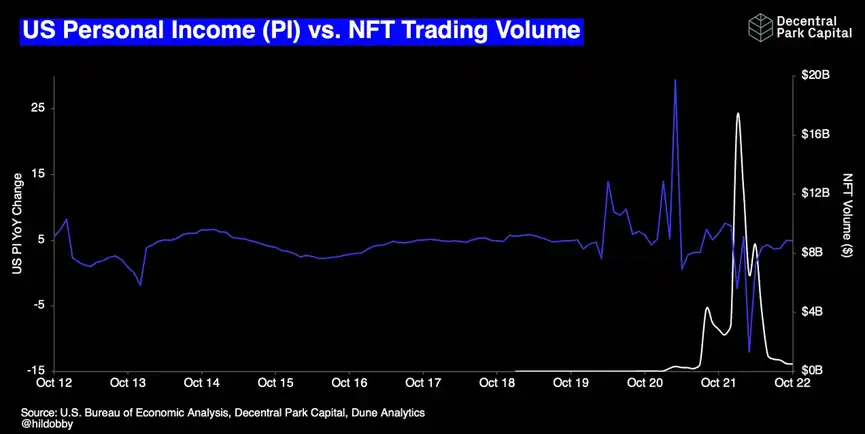
Us personal income change rate and global NFT trading volume.
Definition Reason: NFT represents a high-risk subsector in a high-risk market and should be susceptible to the rate of change in personal income. Rising inflation and slowing real wage growth are the perfect combination for falling disposable incomes.
There is some evidence that US PIs often lead NFT volumes by 4-6 months. Stimulus checks and quantitative easing mean more money is being spent on risky assets.
March 2022 also saw the lowest rate of change in US PI on record, while monthly NFT transactions surged to new ATH (over $16 billion).
Where do we go from here? The model implies that a low or negative PI change rate may hinder significant adoption of NFT. The weakness of the consumer sector is the weakness of the NFT. If the global recession continues, we are unlikely to see a new monthly NFT volume ATH in 2023.
16: FTX Hot Wallet withdrawal
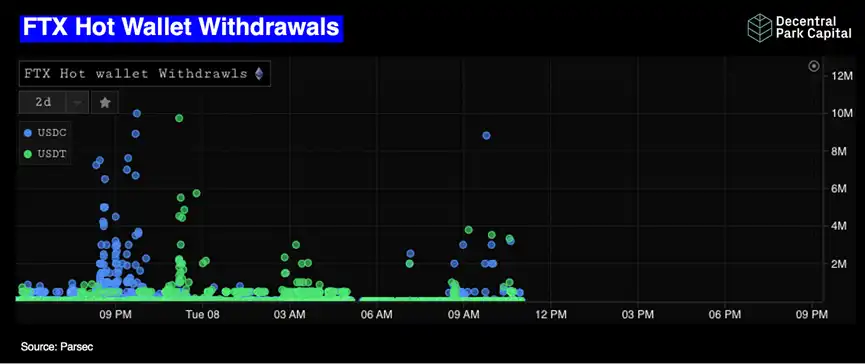
Content: November 7-8, 2022 Pull USDC and USDT scatter charts from FTX trading platform Hot Wallet.
Defining the cause: Data shows that high-value USDC traders initially rushed for the exit on November 7. All this came to a screeching halt on the 8th as low-value traders continued to trade. The final higher-value cluster is for "certain customers," which some people define as Bahamian users.
FTX suspended withdrawals for the last time at noon on November 8, 2022.
Where do we go from here? The years-long bankruptcy process.
17: FTX/USDT Binance order book
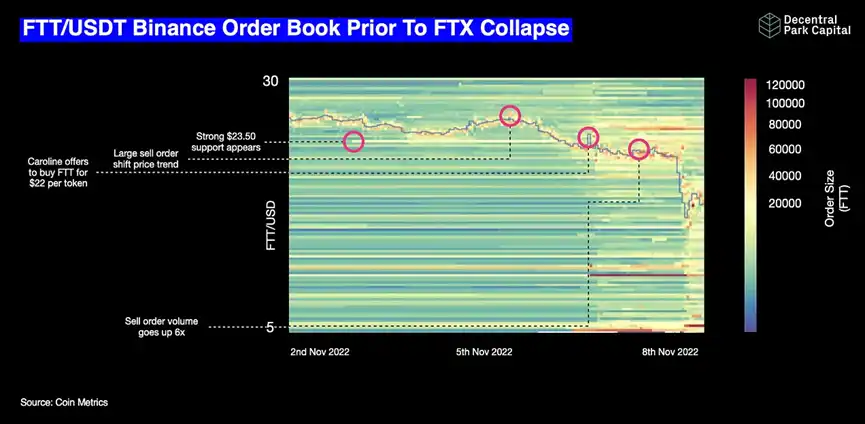
Content: FTT/USD order size of Binance at different price levels from November 2 to 8, 2022.
Definition Reason: It provides on-chain evidence (in the context of off-chain data) that at least one market participant wants to support the price of the FTT, the original crypto asset on the FTX trading platform. Strong support at $23.50 before Caroline (CEO of Alameda) offered to buy FTT at $22 / unit. It's a damning pile of evidence - you don't publicly tell people a price level unless you're very confident you need it.
Where do we go from here? Over time, FTT trading approaches zero in an asymptotic fashion, with limited venue access outside of decentralized trading platforms.
18: Solana asset performance after FTX collapse
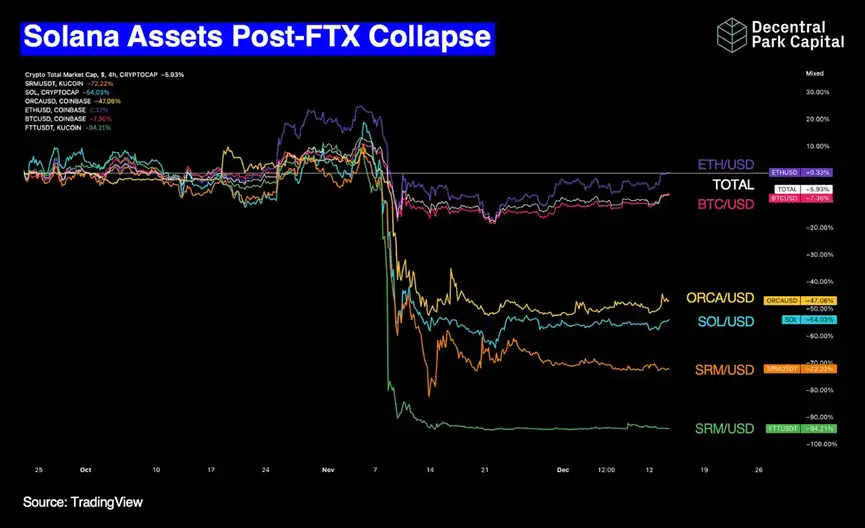
Content: Solana and Solana-based Ecosystem Assets and market beta (BTC, ETH, Total MCAP). Solana-based assets fell more than 50% after the FTX collapse, while SOL itself fell 60%.
Definition Reason: The clustering of Solana asset performance and beta highlights the FTX/Alameda vulnerability that has been present in Solana and its ecosystem.
Where do we go from here? Trust and investment in Solana slowly recovered, and many of Solana's assets will be tied up in several bankruptcy proceedings.
19: Bitcoin hash price and mining difficulty
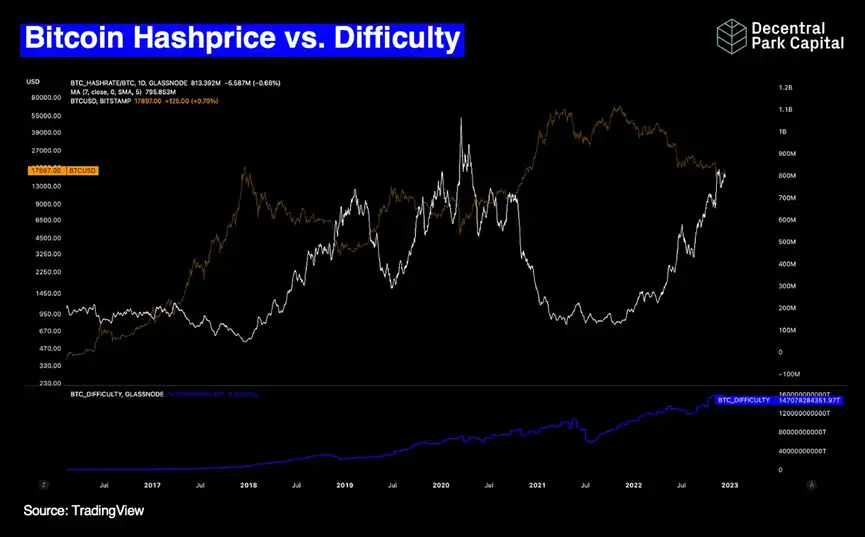
Content: Bitcoin's rising hash price (hash rate/price) versus the suppressed BTC/USD ratio and the rising difficulty of mining.
What it means: The bitcoin mining market is in extreme trouble. Bitcoin hash rate surged 61% from January to ATH peak (273m TH/s), while BTC/USD fell 62% (divergence).
The hash price ratio rebounded to 2020 levels and entered a zone that coincided with the bottom of the local market (miners complete surrender). However, the convexity of the mining market meant that unprofitable miners were forced out of business.
The big difference between then and now is that market conditions are tighter and the macroeconomic environment tougher.
Where do we go from here? The merger of bitcoin miners into 3-5 major (and profitable) players is likely to be led by increased M&A activity. New BTC/USD lows may mean new ATH is hashed price and longer miner surrender period.
20: Ethereum versus Ethereum Classic hash rate
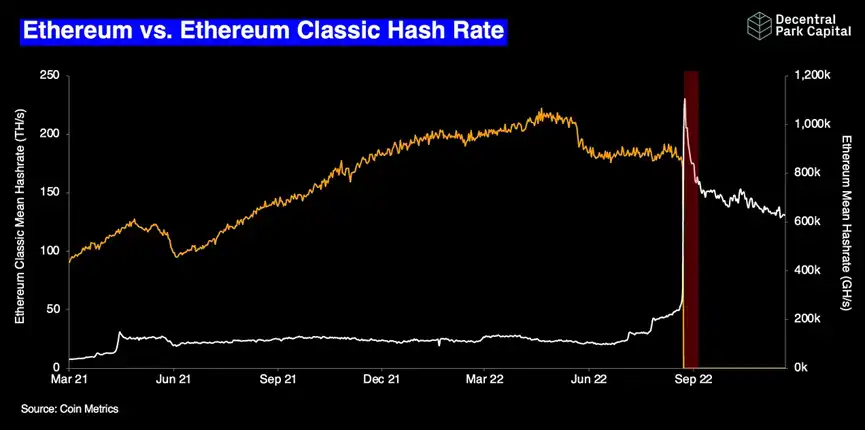
Content: Hash rate trends for Ethereum 1 versus classic hash rate trends for Ethereum since March 2021. The red area indicates ETH merging.
Definition Reason: The ETH merger marks the first mainnet network switch from proof-of-work (PoW) to proof-of-equity (PoS) in history.
The upcoming summer Ethereum transition means miners will soon be out of work. Ethereum Classic, which uses the same mining algorithm, was the next best option and started moving a few months before the September merger event.
The only problem is that ETC's market cap is only about 2.5% of ETH1's, and the network activity is too small to generate transaction fees or sustain interest on the trading platform. Ethereum 1 gets rid of its mining skin and overburdens Ethereum's classic mining environment, relative to the dollar incentives that dollar-denominated operators receive.
Miners began unplugging unprofitable machines, and the network reflected a downward trend in the Ethereum 1 hash rate throughout 2022.
It also emphasizes the self-contained nature of PoW, including mid-consensus layer switching.
Where do we go from here? Ethereum's classic hash rate continues to decline, with resource commitments falling back to the pre-merger 200 TH/s range (all else equal).
21: ETH perpetual contract capital rate
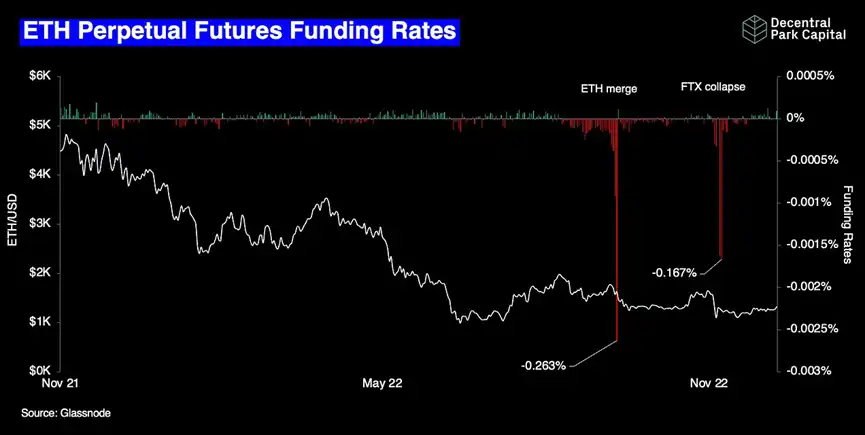
What: Total financing rate versus ETH/USD. The ETH Perpetual Market experienced the most negative funding rates in two separate periods in 2022.
定义原因:第一次极端打印发生在 9 月之前的 ETH 合并期间。交易者将 ETH POW Token 视为免费看涨期权,从而在头寸上变得投机取巧。通过对冲基础资产但持有实物 ETH,他们可以以 delta 中性的方式认领这些单位。
The second is harder to predict. Traders unable to draw assets from FTX also became opportunistic, shorting ETH outside FTX while going long ETH on FTX to construct "synthetic FTX draw trades".
These perfectly capture the growing role of futures markets in cryptocurrencies -- whether for expected events or more temporary ones. Investors have become more sophisticated.
Where do we go from here? The funds rate of ETH is normalised to prevent any negative events (e.g. further trading platform crashes).
22: The performance of newly listed crypto assets since their launch
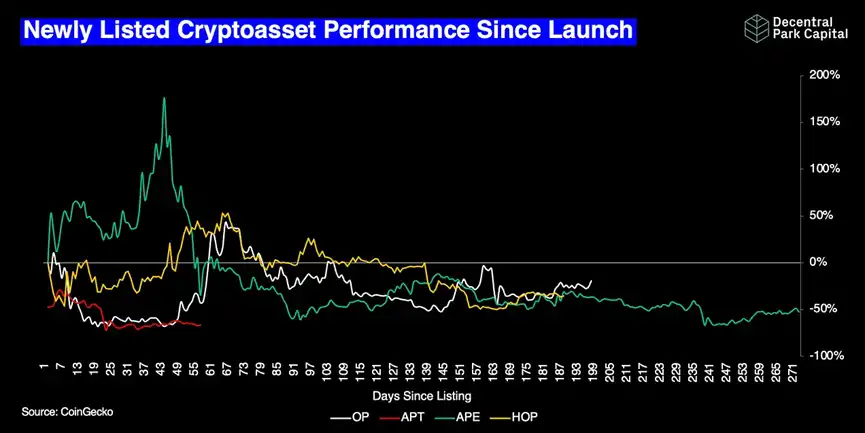
内容:以上市第一天为基准的高调加密资产发布。无论Token发行策略或估值如何,所有 Token 都有望以亏损结束这一年。
Definition: A broad risk-off environment means that investor allocation is insufficient to offset the supply hitting the market (early free float was low).
但这也说明了发布策略的持续无效。OP、HOP 和 AP 等 Token 都是高调空投的例子,但对之前空投的研究得出结论,空投策略在留住用户及其各自的网络贡献方面基本上无效。
Where do we go from here? Developers use this growing list of failed airdrop use cases to iterate on subsequent models, focusing on how to better motivate the community to participate and continue to participate in network contributions.
More: Web3 Vulnerability Count and Value
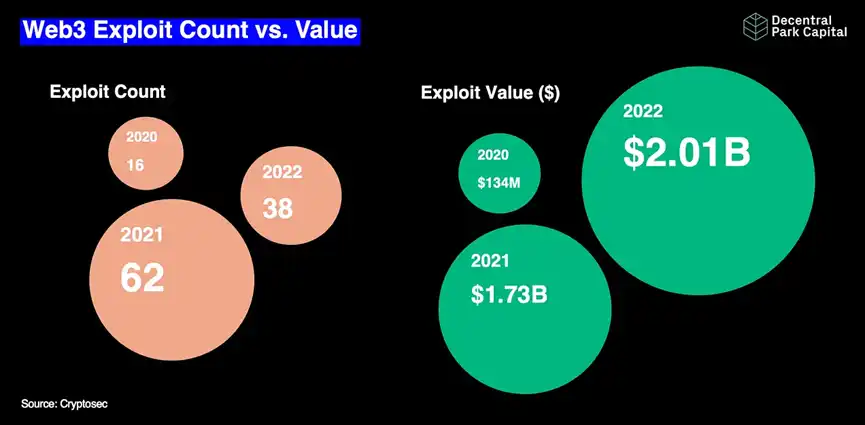
Content: The total number of Web3 protocol vulnerabilities exploited since 2020 versus the total dollar amount. The total number of exploits declined by 39% in 2022, while the total number of exploits increased by 16% ($2 billion).
Defining why: One view is that little has been done to prevent exploitation -- which speaks to the nascent nature of the field.
More interesting, however, is the connection to Web3's multi-chain infrastructure. 2022 is the year we see a rebound in bridge activity. They also represent the clearest honeypot because a lot of value is locked up and presented on their non-native chain. The Nomad and Wormhole Bridge development costs total $526 million by 2022. In other words, we see larger holes in a single high-value corner of the Web3 ecosystem.
Where do we go from here? Despite the best efforts of developers, a similar amount will be developed in 2023. As we've heard so often before -- these things take time to mature.
Original link
Welcome to join the official BlockBeats community:
Telegram Subscription Group: https://t.me/theblockbeats
Telegram Discussion Group: https://t.me/BlockBeats_App
Official Twitter Account: https://twitter.com/BlockBeatsAsia
 Related Articles