Merrill Lynch Clock Model Study: Current Status of cryptocurrencies

Research on Merrill's Clock Model
Original article by Huobi Research
Abstract
At present, the ecosystem of cryptocurrency is becoming more and more rich, the participants are more and more diversified and the precipitation funds are increasing. In this case, we need new investment tools for cycle analysis and variety selection of the entire sector. Therefore, we studied the Merrill Lynch clock model which is relatively mature and well-known in the traditional financial field, hoping to transplant it to the cryptocurrency field.
Merrill Lynch Clock model is a macroeconomic analysis and broad asset allocation model proposed by Merrill Lynch in 2004. It takes output gap and CPI data as two major indicators to measure economic growth and price level. Through analyzing the data of the United States since 1970, it draws a series of conclusions, that is, according to the alternating rise and fall of output gap and CPI data, the economic cycle can be divided into four cycles, namely the recession period, recovery period, expansion period and stagflation period. These cycles appear one after another and form a complete cycle. According to the derivation of clock theory and data verification, we give the optimal category asset allocation in each cycle.
After the global financial crisis in 2008, central banks, represented by the US Federal Reserve, maintained a long-term low interest rate policy and repeatedly used quantitative easing to stimulate the economy. This has some effects on the economic cycle under the Merlin clock. The main manifestations are: the duration of recession and stagflation is shorter, and the duration of recovery is longer; The full cycle of the Merrill clock no longer exists, each cycle alternate; Asset classes have become more volatile and equities have performed well throughout the upswing; But strong assets over different clock cycles still fit the Merrill Lynch clock frame.
We then analyze where the cryptocurrency industry should fit into the Merrill Lynch clock analysis framework, as well as where the current time point belongs in the Merrill Lynch clock and the current optimal asset allocation. We conclude that we are in a period of deflation; The optimal allocation in the current cycle is bonds; Defensive stocks and long-term growth stocks are preferred in the allocation of stocks. Defensive currencies such as BTC and LTC and long-term growth currencies such as ETH and MATIC are preferred in the field of cryptocurrencies.
1. Traditional Merrill clock model
With the rapid development of the cryptocurrency field, its overall market value is increasing, and the types and tracks are becoming more and more rich. In addition, in the past two years, more and more traditional financial institutions and entities have entered the field of cryptocurrency for investment and project development. Faced with the increasingly rich ecology, more and more diversified participants and more and more precipitation funds in the crypto field, we urgently need new investment analysis tools to conduct cycle analysis and variety selection research on the whole field. Therefore, we studied the mature and well-known Merrill Lynch clock model in the field of traditional financial investment, hoping to transplant it to the field of cryptocurrency. Since this is a large and complex project, it will be presented in a series of articles. This article, the first in a series, will begin with an analysis of the Merrill Lynch clock model and how it has changed since the addition of QE.
In 2004, Merrill Lynch first put forward The concept of Merrill Lynch Clock in the report "The Investment Clock: Making Money from Macro". The report calculates the economic data of the United States in the past 30 years, takes the CPI year-on-year growth rate and output gap data as indicators, and divides the economic cycle into four stages: Recovery, Overheat, Stagflation and recession. And calculate the optimal allocation of assets in each stage. This model is further analyzed below.
1.1 Analysis of traditional Merrill Lynch clock Model:
Merrill's clock divides the cycle by two measures: year-on-year CPI growth and output gap data. Output gap data is an economic measure of the difference between an economy's actual output and its potential output at full capacity. The output gap is positive and negative: when actual output exceeds capacity, the output gap is positive, which occurs when demand is high and leads to higher prices; When actual output is below capacity, the output gap is negative, meaning there is spare capacity due to weak demand and prices fall.
The measurement of output gap is a big difficulty of the model. This is mainly because the level of potential output cannot be directly observed and can only be estimated through various methods. The common method of estimation is to select PMI, GDP, labor indicators and capital input indicators to form a production function, and then use the HP (Hodrick-Prescott) filtering method to separate the long-term trend and short-term fluctuations of the function. By filtering out the short-term cyclical changes, an estimate of the potential output can be obtained. In addition, the potential output value can also be obtained through field survey of manufacturers.
However, all the above estimation methods inevitably have errors. In addition, the accuracy of the model will be determined by the data used, the method used to construct the function and the estimate value, which is also the secret of various research and investment institutions. The research content in this area is extensive and complex, and even a separate article can be written to make the research explanation, and will not be repeated here.
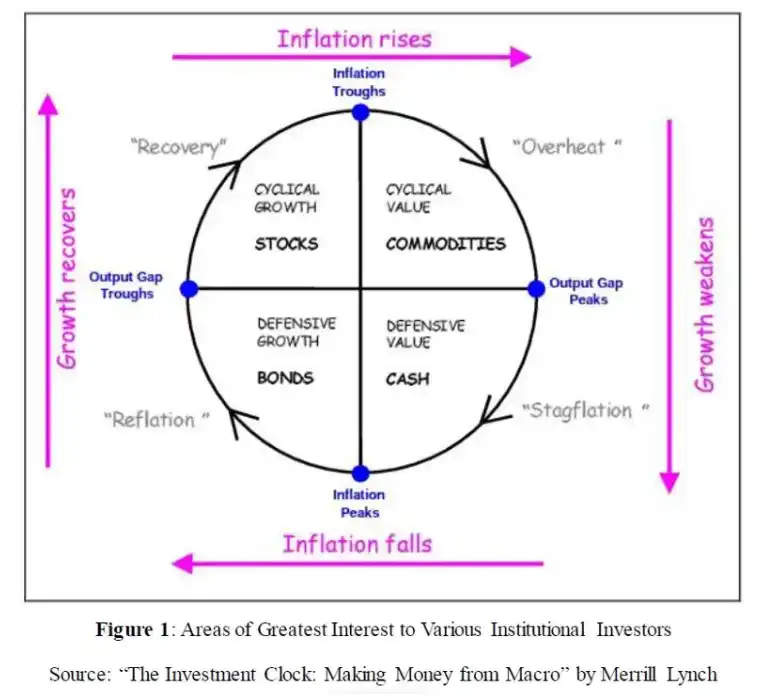
As can be seen from the figure above, the Merrill Lynch clock essentially uses the two major factors of economic growth and price level to divide the economic cycle, and selects different assets for allocation according to the yield difference of various asset categories under different economic cycles. The logic behind this is that macroeconomic conditions in any country affect the performance of various assets in that country's markets and will prompt monetary and fiscal policy adjustments. And adjusted monetary and fiscal policy, while affecting the country's economic conditions in the opposite direction, will also have an impact on various assets in the market. In short, cyclical changes in macroeconomic conditions and economic policies simultaneously lead to cyclical performance of various assets.
According to the Merrill Lynch clock, the economic cycle can be divided into four phases, and each phase corresponds to strong assets:
reflation: Economic growth and price levels fall together, or even at negative year-on-year GDP or CPI growth. During this period, commodities fell, corporate earnings fell and stocks fell, and the bond yield curve moved down and steepened. That's when central banks typically start cutting interest rates in an attempt to get growth back on track. Bonds are the best investment at this stage. In terms of stocks, prefer defensive stocks. In terms of cryptocurrency, BTC and ETH are preferred as industry foundation projects.
Recovery: The low interest rate monetary policy and economic stimulus policy made GDP growth gradually return to the right track, but because the idle capacity was still not fully utilized, that is, the output gap was still negative, the weak demand led to the decline of product prices, and the CPI continued to decline. During this period, thanks to loose monetary and fiscal policies, corporate profits began to recover, and equities became the best investments, preferred cyclical and short-term value stocks.
Expansion (Overheat) : Capacity gradually returns, the output gap closes and inflation starts to rise. That's when the central bank started raising interest rates to keep the economy from overheating, but it's still going strong. This is when bonds start to fall and the yield curve flattens. The equity market faces a balance of corporate earnings growth and high valuations, with cyclical and short-term value stocks doing better. Commodities are the best bet these days, helped by rising inflation.
Stagflation: GDP growth slows and productivity declines but, constrained by a positive output gap and strong demand, firms raise prices to counter a wage-price spiral and protect corporate profits. In the meantime, central banks will tighten monetary policy more tightly until inflation falls, which will weigh on bond performance, while equities will fall on tighter monetary policy and lower corporate profits. Cash assets are the best investment choice during this period, with defensive stocks and long-term value stocks.
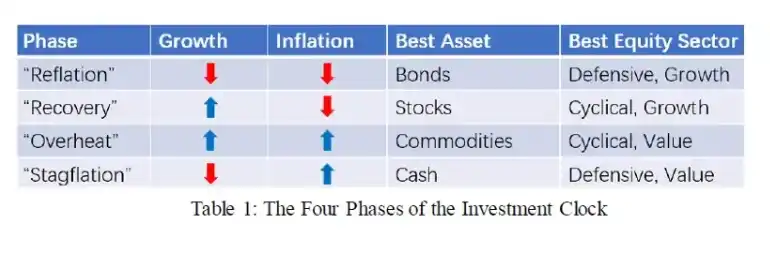
Merrill Lynch Clock's cycle framework also helps us with sector allocation strategies for stocks and cryptocurrencies:
当经济增长加速时,周期性行业股票如钢铁、汽车等表现较好,加密货币领域中优选公链Token、Defi Token 等;当经济增长放缓时非周期、防御性股票相对较好,在加密货币领域中优选 BTC。
当通胀下降时金融成本较低,优选长期成长股和公链等基础项目 Token ;当通胀上升时大宗商品和现金表现最好,这时适合选择有炒作题材的股票和 NFT、GameFi 等类型的 Token 。
In summary, the Merrill Lynch clock model divides the economic cycle into four stages, based on two indicators of economic growth and inflation. And the model combines the economic cycle with the selection of broad class assets. The logic behind it is that economic growth and inflation will drive the adjustment of national economic policy, and together they will drive the cyclical performance of various asset classes. The model will be validated next.
1.2 Merrill Lynch clock model data backtest:
In this section, we'll backtest using the annual nominal output gap data from the Congressional Budget Office and the year-over-year CPI data from the Bureau of Labor Statistics. We analyzed the data from 1970 to 2007. After 2008, due to the emergence of new monetary tools such as QE, its impact on the economic cycle caused changes in the Merrill Lynch clock model, which will be analyzed in the next chapter.
We first divide the output gap and CPI year-on-year data into four cycles according to the model's criteria, as shown in the figure below. Then the duration of each cycle and the performance of various asset classes in each cycle are counted.
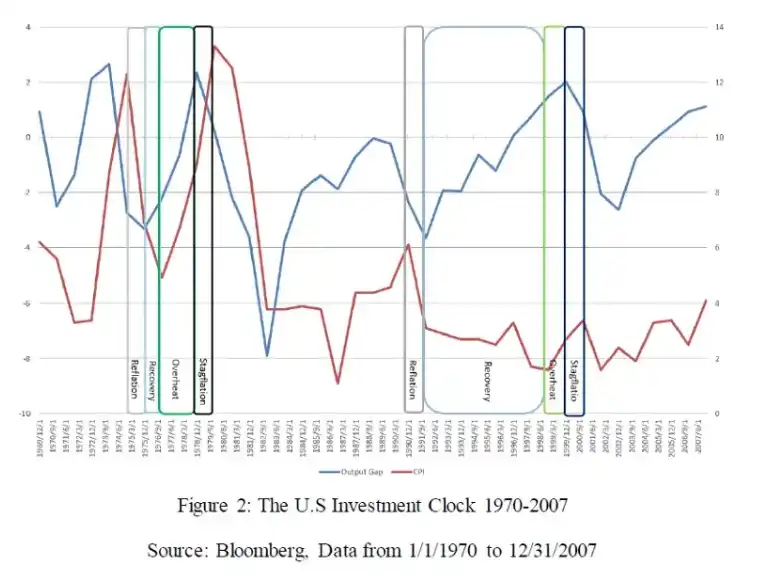
The chart above shows two typical four-cycle Merrill Lynch clocks. Through statistics, we obtained the total duration and average duration of each cycle in 152 quarterly data during the backtest period, as well as the proportion in all samples, as shown in the following table:
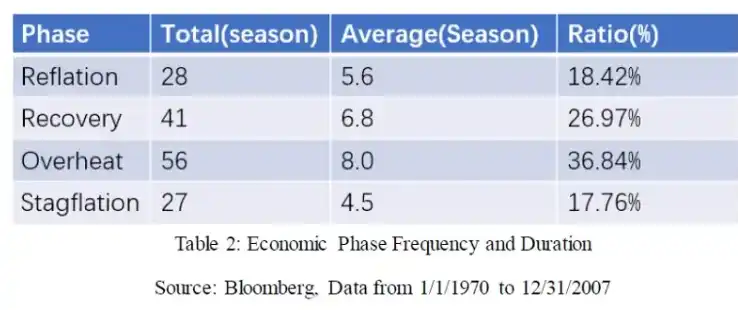
We can see from the statistical data: in the 37 years from 1970 to 2007, the economic uptrend accounted for about 63.81% of the time, while the downtrend accounted for about 36.19% of the time; About 54.6 percent of the time inflation was up, and about 45.4 percent of the time it was down. In addition, from the perspective of the average duration of each cycle, the average duration of recovery period and expansion period is longer than that of stagflation period and deflation period, the average duration of recovery period is more than one and a half years, and the average duration of expansion period is two years. The average duration of stagflation and deflation was about a year and a year and a half, respectively. However, due to the long duration of each cycle and the small number of total samples, the statistical results were greatly disturbed by the extreme sample data. For example, the 1980-1982 deflationary period lasted 11 quarters, and the 1987-1989 and 1994-1996 expansion cycles also lasted 11 quarters. These samples have a great impact on the overall sample data statistics.
Next, we will classify and calculate the performance of different asset categories in each cycle according to the time of each cycle. Among them, the 10-year Treasury data of the United States is used for bond assets and S& is used for stock assets. P 500 Index, using the Bloomberg Commodity Index for commodities, and using the US 3-month Treasury data for cash. We will separately calculate the average quarterly rise and fall of each asset category in different cycles. Because the rise and fall of different periods are greatly affected by the inflation rate of this period, for example, the inflation rate was as high as 20% in the 1980s, and after entering the 21st century, the inflation rate remained below 3% for a long time, the return performance of the same assets in these two periods varied greatly. So we take the real rise and fall after inflation, and the statistical results are as follows:
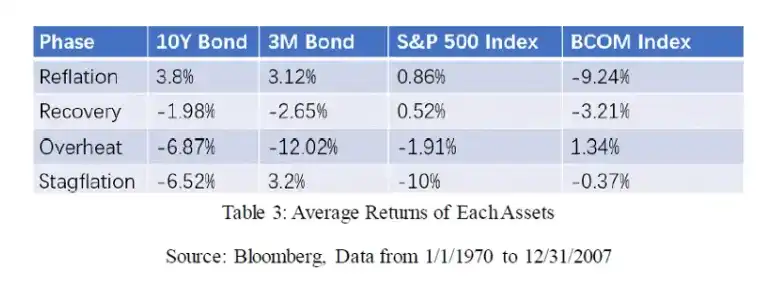
From the above results, we can see that:
reflation: The 10-year Treasury bond has been the best performer, as well as short-term Treasury bills, notably the three-month Treasury bill, as bond yields have steepened again. Correspondingly, commodities have been the worst performers during this period.
Recovery: As corporate profits gradually recover, stocks perform the best, and funds are transferred from the bond market to the stock market, which makes the performance of bonds deteriorate. But commodities are still the worst performers, with inflation continuing to fall because product prices are still falling.
Overheat: As general inflation is high and central banks start to raise interest rates, real yields on bonds, cash assets and equities are all negative, while commodities are strong.
Stagflation: As central banks continue to raise interest rates and economic growth slows, bonds, stocks and commodities all underperform, while cash outperforms.
After data backtest, we verified that the performance differentiation of various categories of assets in different cycles divided by Merrill clock is obvious, and the categories of assets with outstanding performance in different cycles are consistent with the judgment of the model. Therefore, Merrill Lynch clock as a macroeconomic cycle analysis framework and broad asset allocation strategy basis is relatively clear.
2. The Merrill Lynch clock model with QE
In late 2008 and early 2009, the subprime mortgage crisis in the United States triggered a global financial crisis. During that period America's output gap fell sharply, along with inflation, and both turned negative. The Fed responded to the crisis by using a new monetary policy tool called Quantitative Easing. Since then, the Fed has repeatedly used quantitative easing to stimulate the economy. So what does this tool do to the Merrill Lynch clock model? We will analyze this in the next chapter.
2.1 Introduction to QE
Let's start with a look at what the Fed's usual monetary policy tool was before QE and how it affected market liquidity and interest rates. Generally speaking, the traditional monetary policy means mainly operate on the interest rate. Interest rate can be simply understood as the cost of money. When the economy is overheated and the inflation rate is too high, the central bank will raise the financing cost of enterprises and individuals by raising interest rates, thus preventing enterprises from expanding production and personal consumption. Conversely, when the economy slumps and inflation falls, the central bank cuts interest rates to stimulate business expansion and consumer demand, thereby stimulating the economy.
Take the United States as an example, the main interest Rate tool used by the Federal Reserve to regulate the market is the Federal Funds Rate, which is the interest rate of the inter-bank lending market in the United States, the most important of which is the overnight lending rate. By adjusting the interest rate, the Fed can directly affect the cost of funds for commercial banks, and thus affect the whole macro economy. However, interest rate adjustment is transmitted from the overnight interest rate at the shortest end to the cost of funds in various parts of the macro economy. This chain is quite long and complex, and there are many influencing factors outside the control of the Federal Reserve. Therefore, when the financial crisis broke out in 2008, the traditional monetary policy tools partially failed. In order to rescue market liquidity, especially to restrain the surge of long-term interest rates, the Federal Reserve used QE as a monetary tool.
Different from traditional interest rate adjustment, QE refers to the central bank shifting the focus of monetary policy from controlling the cost of funds to controlling the quantity of funds. The goal is to keep the financial system in an easy liquidity environment by injecting funds into the market. QE generally works by allowing central banks to hold down benchmark interest rates while also buying government and corporate bonds to hold down long-term interest rates and keep markets liquid. This monetary policy tool was first proposed by the Bank of Japan in 2001 and was famously adopted by the US Federal Reserve during the 2008 financial crisis. From 2008 to now, the United States has adopted QE policy as follows:

Invented in Japan and made famous by its use in the United States, QE has been used by many countries and economies around the world, so its impact on the global economic cycle is profound and widespread. Let's back test the economic data after 2008 using the Merrill Lynch clock model to see how the economic cycle changed after QE.
2.2 Merrill Lynch clock data back test after joining QE
For this section, we also used the Congressional Budget Office (CBO: Back test the Congressional Budget Office's annual nominal output gap data with the Bureau of Labor Statistics' year-over-year CPI data, Data from 1/1/2008 to 3/31/2022 are analyzed, and the cycle division is as follows:
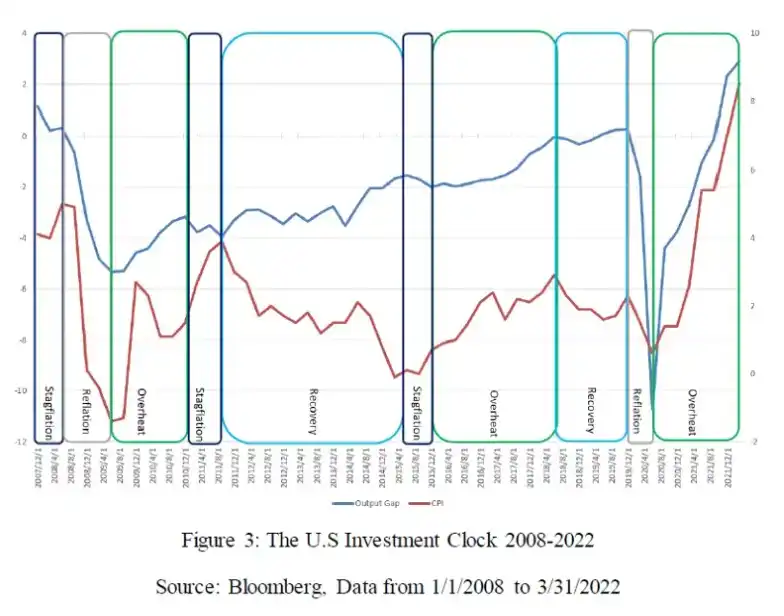
The figure above shows the Merrill clock for each period within the time range, and then we calculate the number of occurrences and average duration of each period, as shown in the table below:
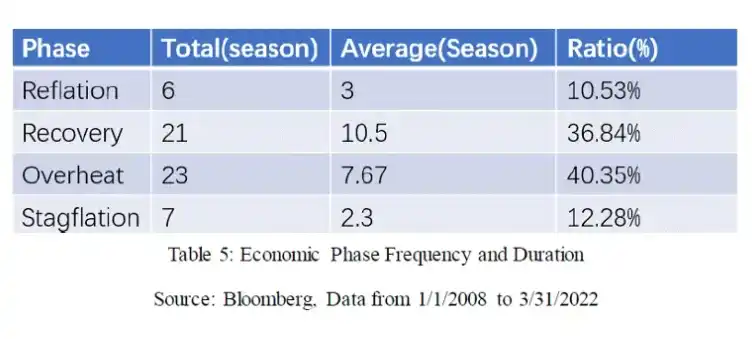
By comparing the data before and after 2008, we can find the following characteristics:
a) There is no complete cycle of recession-recovery-expansion-stagflation after 2008, and the recession is usually followed by the expansion period, or a stagflation period is mixed between the recovery period and the expansion period.
b) During this period, the capacity gap was negative for a long period of time, from late 2008 to early 2019, which is unprecedented in history. In addition, the year-on-year CPI data of the same period remained below 3% for a long time, basically at the lowest level in the statistical cycle. The combination of the two data points leads to a guess that the pattern of economic growth in the United States during this period represented a profound shift compared to history.
c) By comparing the average duration of each cycle and the proportion of total time in the two periods, it can be found that the average duration of stagflation period and recession period decreased from more than one year before 2008 to 2-3 quarters, while the average duration of recovery period increased by nearly one year, and the average duration of expansion period remained basically unchanged. From the perspective of the total time proportion, the time proportion of stagflation period and recession period decreased by about 5.5% and 8% respectively, the time proportion of recovery period increased by 10%, and the time proportion of expansion period increased by about 4%. In short, compared with the previous period, the average duration and total time proportion of stagflation and recession were significantly reduced after 2008, while the average duration and total time proportion of recovery were significantly increased.
Next, we will also calculate the performance of different categories of assets in each cycle. The class asset data and statistical methods used are the same as above. The statistical results are as follows:
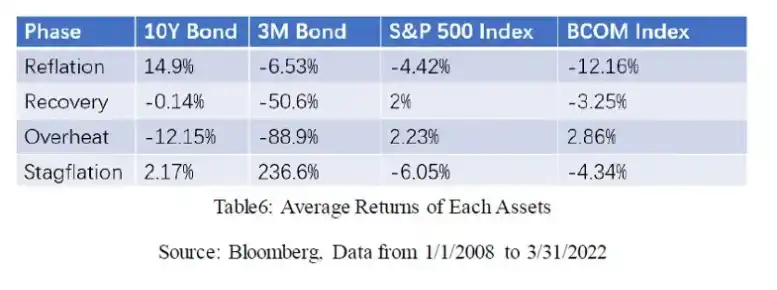
Comparing the above results with the backtest performance before 2008, we can see that:
The asset classes that do best over different cycles still fit the Merrill Lynch clock frame's inference that bonds do best during recessions, stocks do best during recoveries, commodities do best during expansions, and cash does best during stagflation.
The variation of bonds and cash assets in different cycles is much greater than that before 2007. For example, the average yield of bonds in the deflationary period is 14.9%, higher than that of 3.8% in the same cycle before 2007. The 236.6% rise and fall of cash-like assets during the stagflation period was much higher than the 3.2% rise and fall of the same period before 2007. This was mainly due to high inflation in the 1980s, which led the Federal Reserve to raise the benchmark interest rate to more than 20%. After that, the center of the benchmark interest rate has been slowly declining, and it remained at the level of 0.25% for a long time after 2008. In the interest rate raising cycle from 2015 to 2018, the Federal Reserve raised the benchmark interest rate to 2.5%. Due to the impact of the low base, the interest rate increased by 10 times. Therefore, it is not difficult to understand that the return rate of cash assets most affected by the benchmark interest rate fluctuated greatly.
Stocks in the recovery period and expansion period sustained high positive returns are also different from before 2008. This, of course, corresponds to the great multi-year bull market in U.S. stocks, which is essentially the result of the Federal Reserve holding down its benchmark interest rate to near zero and abundant liquidity.
According to the above analysis, after the emergence of QE in 2008, some profound changes took place in the economic growth pattern of the US, which resulted in a long-term negative output gap and a long-term inflation rate below 3%. Moreover, the Fed's loose monetary policy and the repeated use of QE prevented a complete clock cycle of deflation-recovery-expansion-stagflation from occurring during this period. In addition, the average duration and total duration of the deflationary period and stagflation period were significantly less than that before 2008, while the average duration and total duration of the recovery period were both greater than that before 2008. That said, the best-performing assets over the cycles still fit the Merrill Clock analysis.
In summary, we can conclude that the long period of low interest rates and QE after 2008 were stimulants that significantly shortened the duration of the downturns, but did not reduce their frequency and disrupted the full cycle.
3. Analysis of the current economic cycle and cryptocurrency allocation
According to the Merrill Lynch clock, we can analyze the current cycle interval based on recent output gap data and CPI data. Thanks to the Congressional Budget Office (CBO: The Congressional Budget Office's annual nominal output gap figures are currently updated only through the first quarter of 2022, So here we'll use US output gap data from the Federal Reserve Bank of St Louis and year-on-year CPI data from the Bureau of Labor Statistics, as shown below:
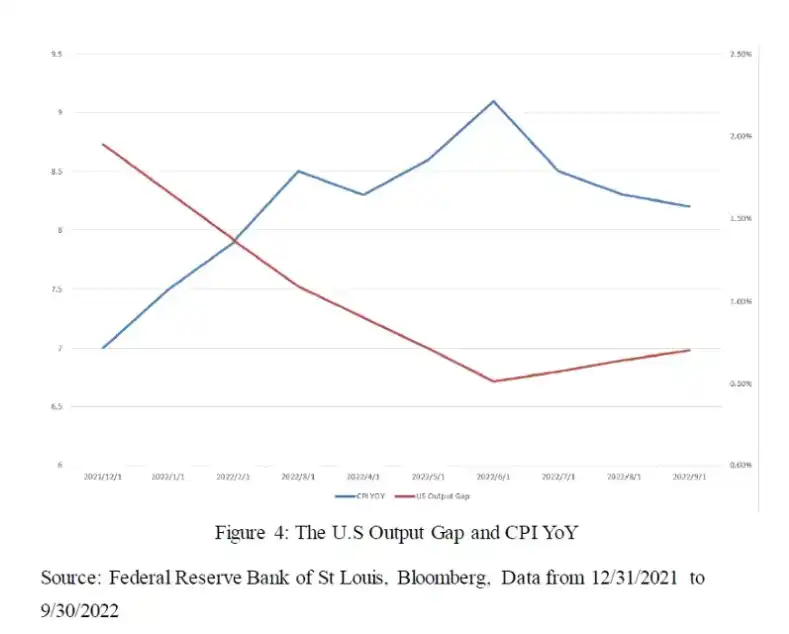
As can be seen from the data shown in the figure above, the decline of the output gap in the first two quarters of this year was accompanied by the rise of the CPI data, which is clearly consistent with the characteristics of stagflation period. Since the beginning of the third quarter, the CPI has declined, while the output gap is at a low level, and according to the recent economic data such as PMI, the output gap may decline again in the fourth quarter. Therefore, we can generally judge that the current period of deflation is in. And based on the Fed's rate hike path, this rate hike cycle could last until the first quarter of 2023, so it would be roughly deflationary until then. According to the analysis framework of Merrill Lynch clock, in the period of deflation, with the characteristics of declining inflation and slowing economic growth, the optimal asset allocation in this period is bonds; Defensive stocks and long-term growth stocks are preferred.
Next, cryptocurrencies can be divided into defensive currencies and cyclical currencies by referring to the classification method of stock types, among which the cyclical currencies can be divided into long-term growth currencies and short-term subject currencies, as shown in the following table:
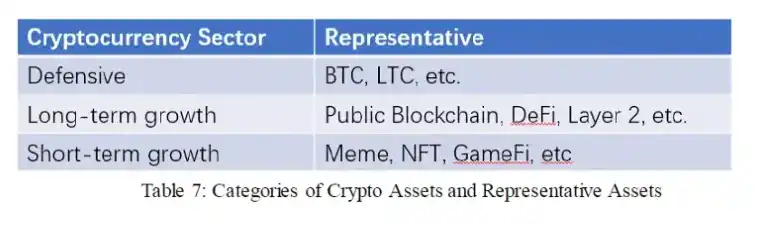
According to the Merrill Lynch clock analysis framework, in the current period of deflation, BTC, LTC and other defensive currencies and ETH, UNI, MATIC and other long-term growth currencies are preferred.
4. Summarize and use key points of Merrill clock model
Merrill Lynch Clock model is a macroeconomic analysis and broad asset allocation model proposed by Merrill Lynch in 2004. It takes output gap and CPI data as two major indicators to measure economic growth and price level. Through analyzing the data of the United States since 1970, it draws a series of conclusions, that is, according to the alternating rise and fall of output gap and CPI data, the economic cycle can be divided into four cycles, namely the recession period, recovery period, expansion period and stagflation period. These cycles appear successively and constitute a complete economic cycle. According to the derivation of clock theory and data verification, we give the optimal category asset allocation in each cycle.
After the global financial crisis in 2008, central banks, represented by the US Federal Reserve, maintained a long-term low interest rate policy and repeatedly used quantitative easing to stimulate the economy. This has some implications for the Merrill Lynch clock's analytical framework, mainly as follows: the duration of recessions and stagflation periods is shorter, the recovery period is longer; The full cycle of the Merrill clock no longer exists, each cycle alternate; Asset classes have become more volatile and equities have performed well throughout the upswing; Strong assets in different clock cycles still fit the Merrill Lynch clock frame.
Here are some important points to note when using the Merlin clock:
The choice of output gap data. As the output gap data is an estimate, each agency has its own method of calculation, which leads to small differences in the data of different agencies. This may lead us to use the Merrill Lynch clock frame for cycle segmentation depending on the data.
The same output gap data is published quarterly in most organizations, so to get more frequent data, you can choose your own economic indicators to construct the data. Then the selection of indicators and the method of construction will affect the accuracy of the data.
The reason why we hope to get more high-frequency and accurate data is that in addition to using this model to clarify the economic cycle we are currently in, we also hope to accurately judge the time point of cycle transformation, so that we can timely adjust asset allocation to obtain returns and avoid risks. Therefore, it is important to judge the timing of the Merrill Lynch clock cycle switch in the use of this model.
Building on our previous analysis, we analyze where the cryptocurrency industry should fit into the Merrill Lynch clock analysis framework, as well as where the current time point belongs in the Merrill Lynch clock and the current optimal asset allocation. We conclude that we are in a period of stagflation; The optimal allocation in the current cycle is bonds; Defensive stocks and long-term growth stocks are preferred in the allocation of stocks. Defensive currencies such as BTC and LTC and long-term growth currencies such as ETH and MATIC are preferred in the field of cryptocurrencies.
On the basis of the current research, what can be studied further is a more detailed, quantitative study of the sector division of cryptocurrencies, and on this basis a callback test with the Merrill Lynch clock framework and historical data. This part will be completed in the later work.
This article is based on contributions and does not represent the views of BlockBeats.
Welcome to join the official BlockBeats community:
Telegram Subscription Group: https://t.me/theblockbeats
Telegram Discussion Group: https://t.me/BlockBeats_App
Official Twitter Account: https://twitter.com/BlockBeatsAsia