The 2022 Q3 Ethereum Ecology Report: Modernism and Arbitrum ushered in the summer of L2

Ethereum Q3 Ecology Report: A Look at Key Metrics for Protocols, DeFi, NFT, and L2 on Ethereum
原文作者: Ben Giove ,Bankless 分析师
The Way of DeFi
Ethereum is one of the world's leading smart contract networks, and it's also a public good.
With no one formally in charge of creating eco-reports, Bankless tried publishing a Q3 Ethereum eco-report that covered important baseline metrics for its protocol and L2 layer as well as DeFi and NFT ecosystems.
How has your Internet usage been in the past 3 months? How many people are still buying NFTS? Does Layer 2 successfully extend Ethereum?
You can find the answers to all of these questions in an easy-to-understand report provided in this article.
Ethereum Ecology Report -- Q3 2022

Written and illustrated by Logan Craig
This post was originally inspired by James Wang's "Ethereum announces Q1 2021 Results."
The report looks at key metrics for the Ethereum protocol and ecosystem for the third quarter of 2022, breaking it down into four categories: protocol, DeFi, NFT, and Layer 2. Then, the article will continue to discuss the highlights and prospects of the Ethereum ecosystem.
The key results
The numbers compare Ethereum's performance in the third quarter of 2021 to the third quarter of 2022.
agreement
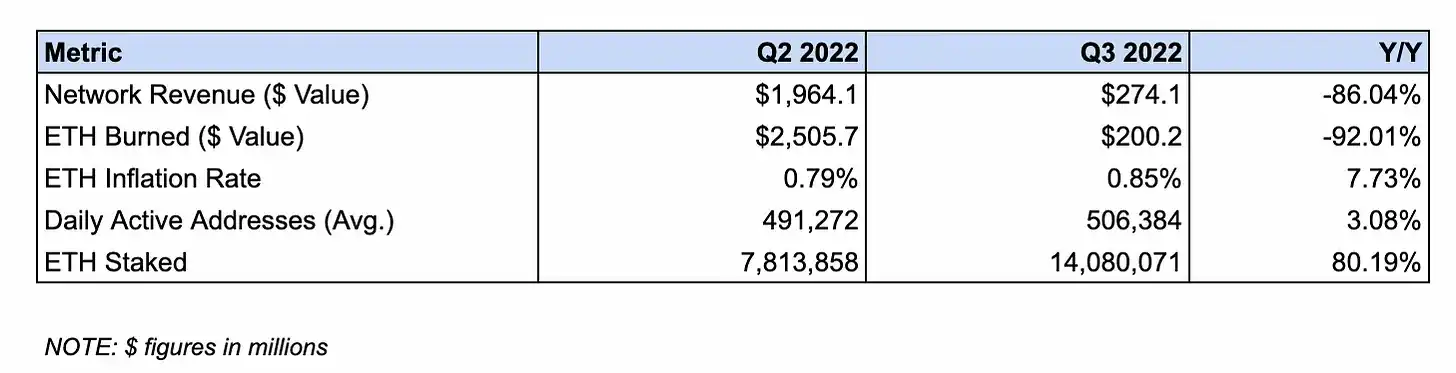
The NUMBERS: Network revenue fell 86.0% to $274.12 million from $1.96 billion.
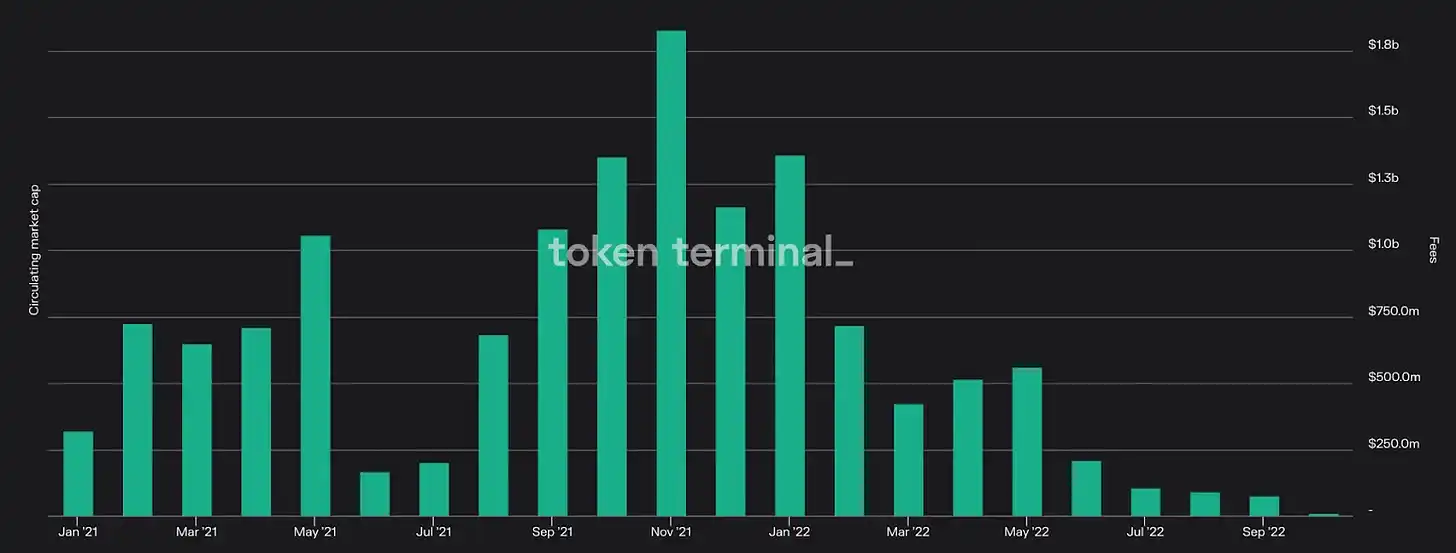
Ethereum network revenue, source: Token Terminal
The data measures the dollar value of total transaction fees paid by users in a quarter.
The decline in net revenue can be attributed to a decline in on-chain activity due to general market weakness. The need for trading speculation and increased leverage was significantly reduced against a subdued macro backdrop during the quarter.
Of this, $200.15 million (73%) was burned through the expense burning mechanism introduced in the EIP-1559.
Data: ETH inflation increased 7.7% from 0.79% to 0.85%.

ETH supply growth, source: Etherscan
This measure measures the growth in Ethereum supply during the quarter.
The increase in inflation may be due to reduced demand for block space. As user transactions decrease, so does the amount of ETH burned through the EIP-1559 (permanently removed from the circulation supply).
Data: The average daily active addresses (DAA) increased by 3.08% from 491,271 to 506,384.
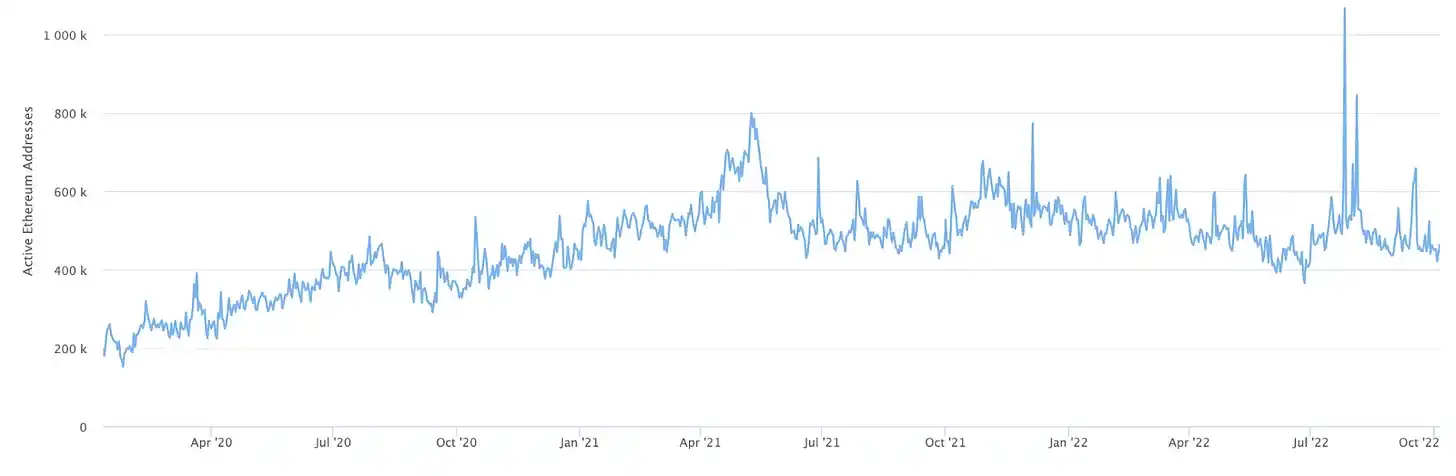
Ethereum daily active address, from Etherscan
This measures the average number of unique wallet addresses interacting with the Ethereum network on a daily basis during the quarter.
This spike in daily active addresses (DAA) is most likely due to lower gas costs, despite a decline in overall speculation. This increases the ability of new individuals, contracts, and/or bots to transact on Ethereum as transaction costs fall in step with block space demand.
Data: The number of ETH pledged increased from 7.81 million to 14.08 million, an 80.2% increase.
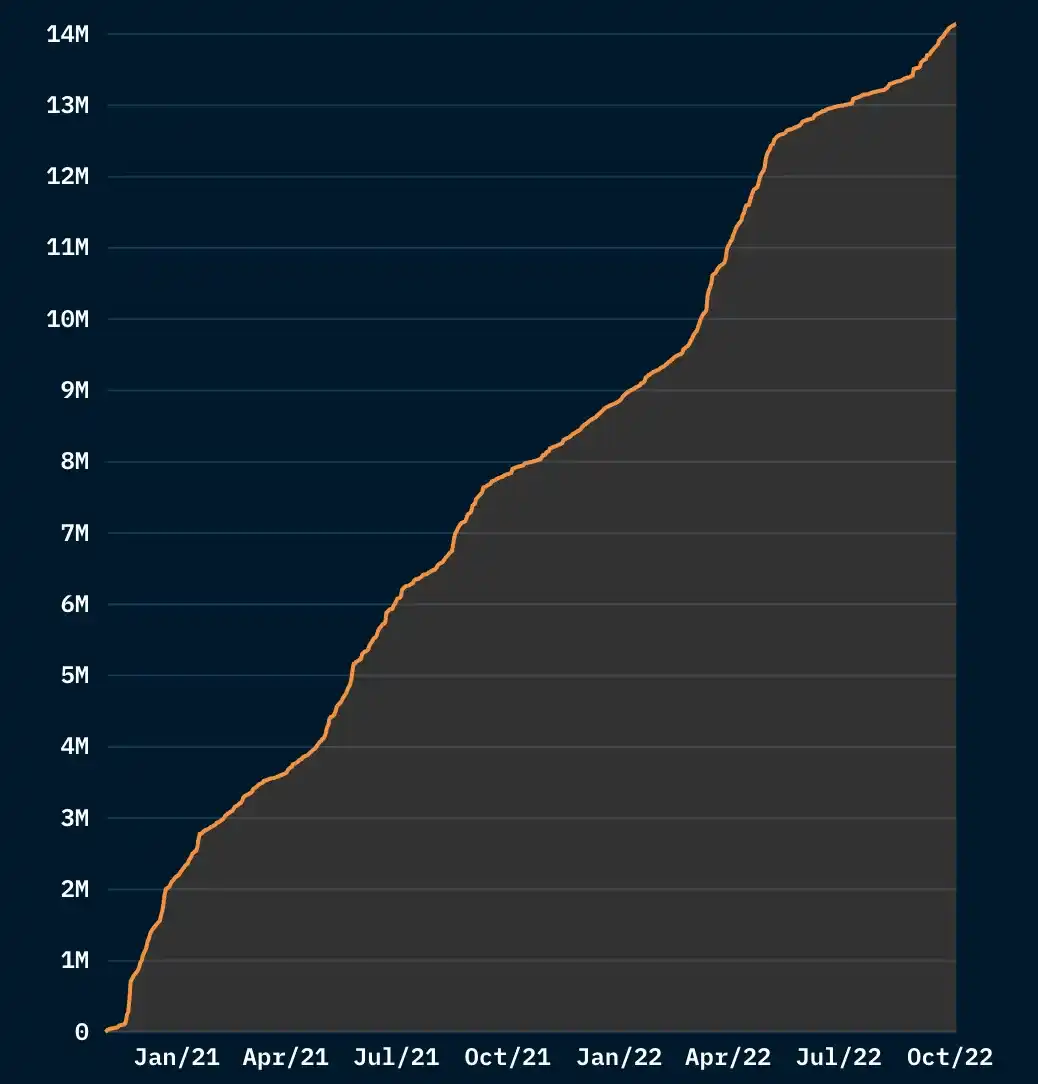
ETH Pledge, source: Nansen
This data tracks the number of ETH pledges on the Beacon Chain.
The growth of the pledge is due to the anticipation of the merger, as well as the adoption of liquidity pledge services, which enables users to receive pledge incentives while their ETH holdings remain liquid. The share of these agreements in beacon chain total deposits increased from 35.3 percent to 46.3 percent year-on-year.
DeFi ecosystem
The NUMBERS: DeFi TVL shrank 58.6% to $31.55 billion from $76.27 billion.
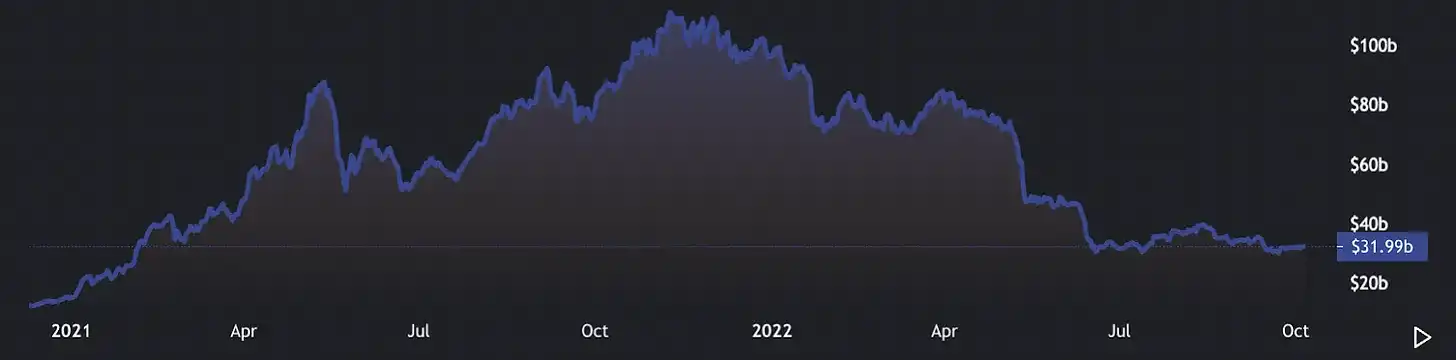
Ethereum DeFi TVL, source: DeFi Llama
The data measures the value of tokens deposited into the Ethereum-based DeFi protocol.
This decline can be attributed to bear market conditions, as most of the value of DeFi TVL consists of volatile assets with falling prices, such as ETH and wBTC. This decline could also be due to liquidity outflows due to lower on-chain yields, which makes it less attractive to deploy capital.
Data: Spot DEX trading volume fell 31.6% to $192.73 billion from $281.68 billion.
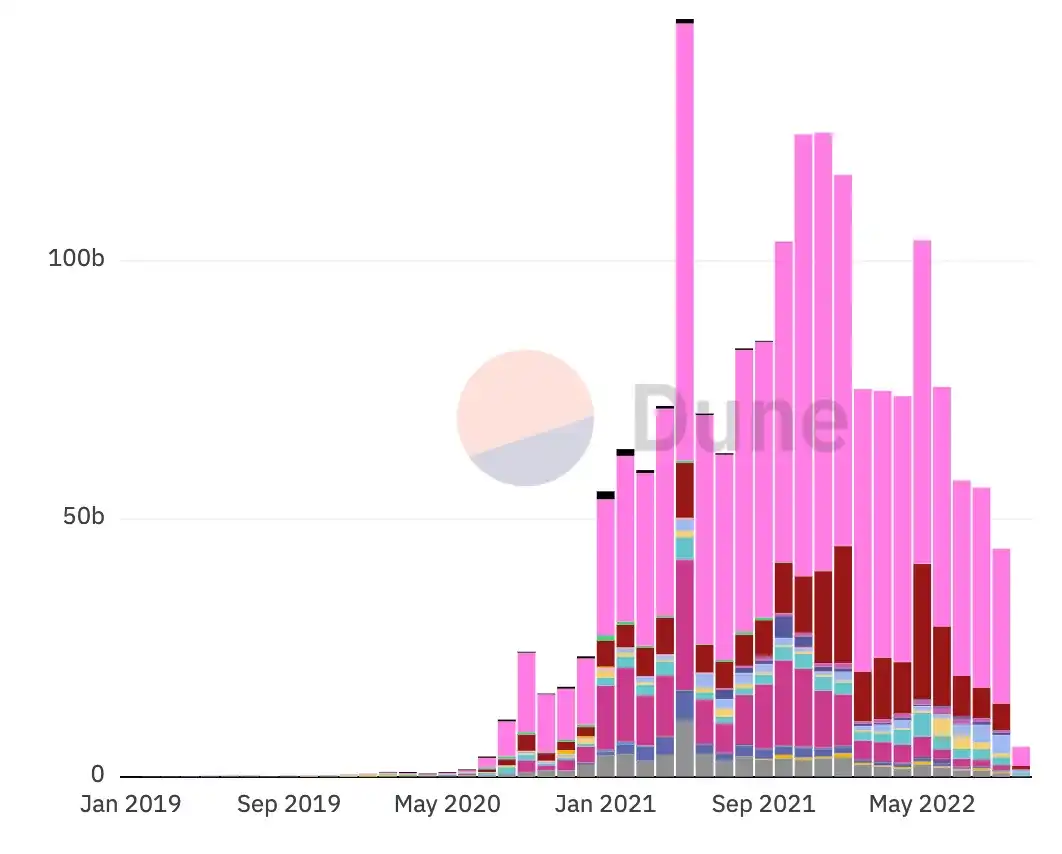
Ethereum Spot DEX volume, source: Dune Analytics
This will track the total trading volume of the decentralized spot trading platform deployed on Ethereum.
The decline could be attributed to declining market conditions. As noted above, bear market conditions reduce speculative demand, and given that trading activity is positively correlated with price behavior, this leads to lower trading volume.
Data: Stablecoin circulation supply increased from $87.82 billion to $106.20 billion, an increase of 20.9%.
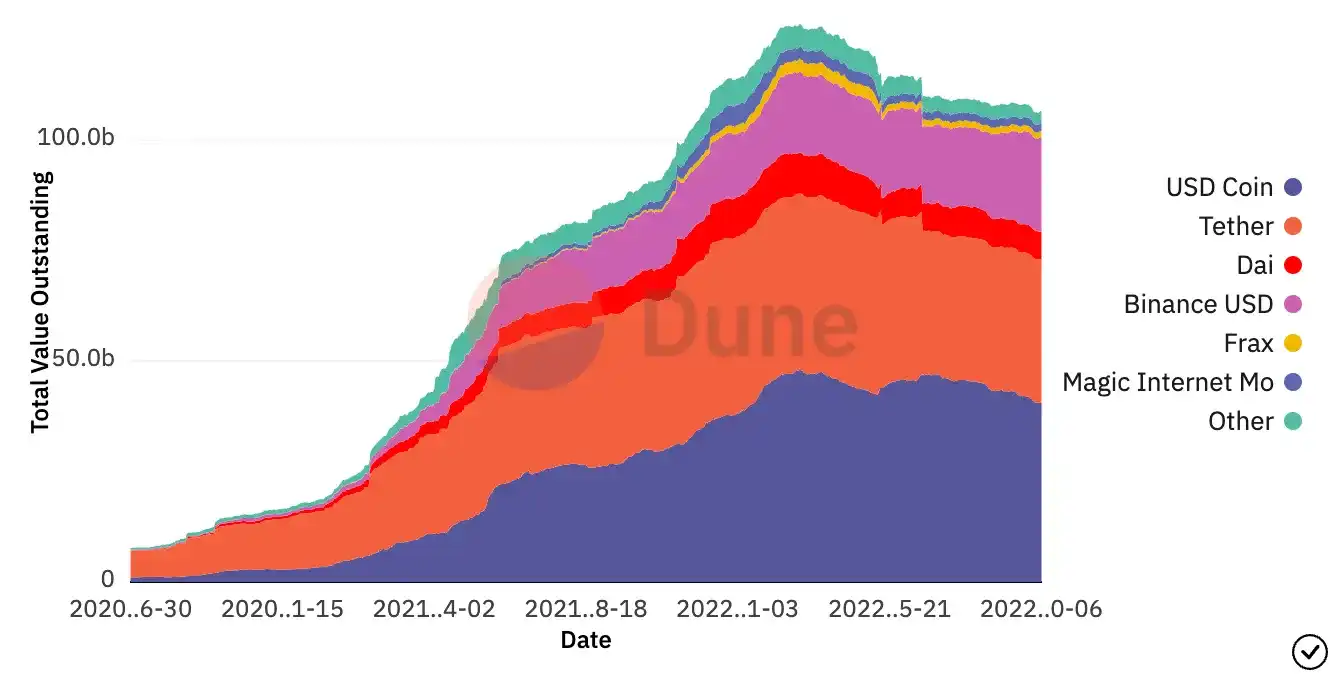
Stablecoins in circulation, source: Dune Analytics
This measures the value of dollar-pegged stablecoins issued and/or circulated on Ethereum.
This growth was driven by the demand to hold stablecoins as cash positions and a combined $21.8 billion increase in the supply of USDC, BUSD, DAI, and MIM on the network. This offset a $3.6 billion decline in the supply of USDT and "other" stablecoins in circulation.
Data: Average money market debt outstanding fell 67.0 percent to $4.48 billion from $14.68 billion.
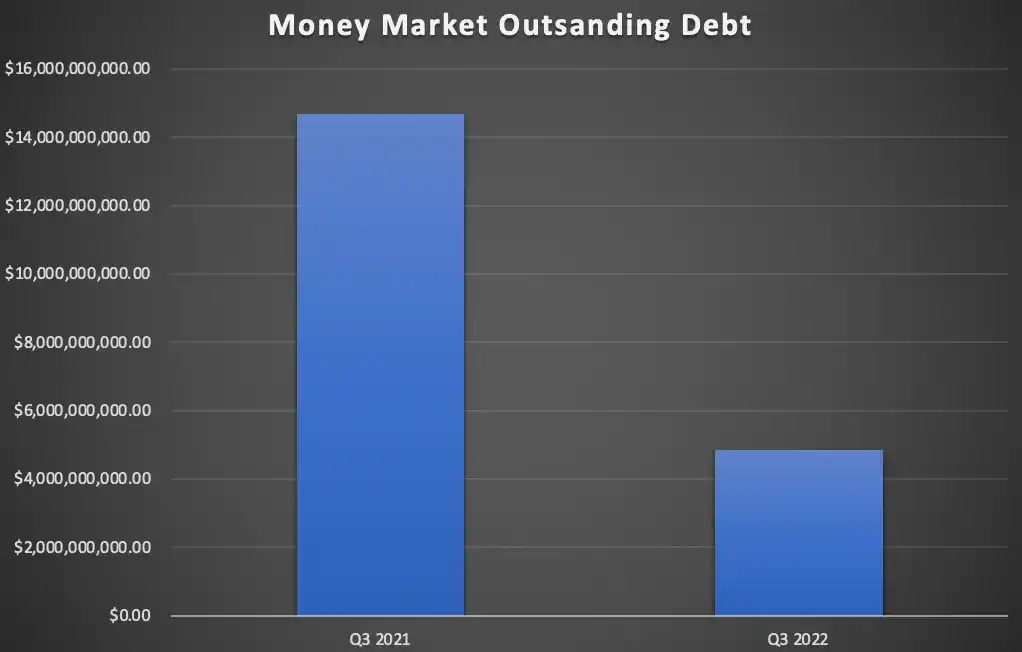
Money market average outstanding debt, source: Token Terminal
The data tracks the average outstanding debt in the Ethereum-based money market during the quarter.
This decline can be attributed to reduced demand for leverage due to market conditions. Moreover, despite the rise in ETH prices, the appetite to borrow may still be subdued by the consequences of the deleveraging in June following the collapse of the hedge fund Three Arrows Capital.
The NFT ecosystem
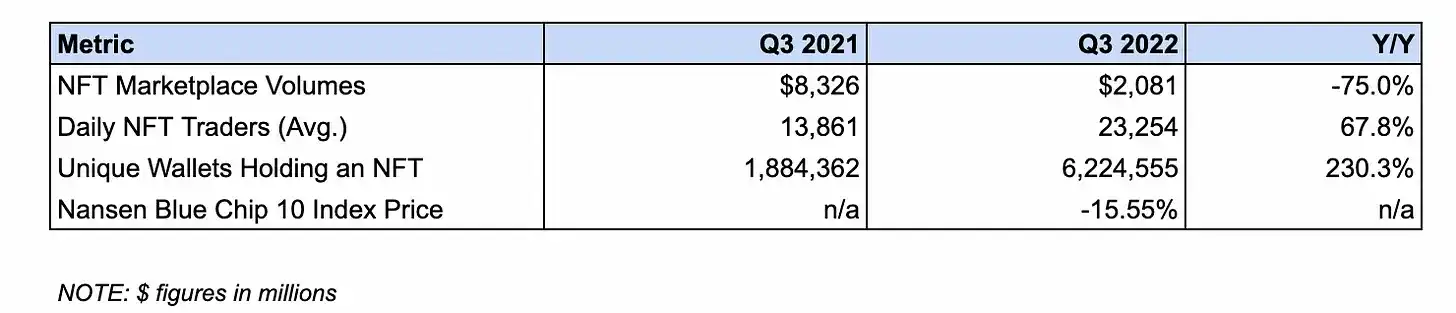
The numbers: NFT market volume fell 75% from $8.32 billion to $2.08 billion.
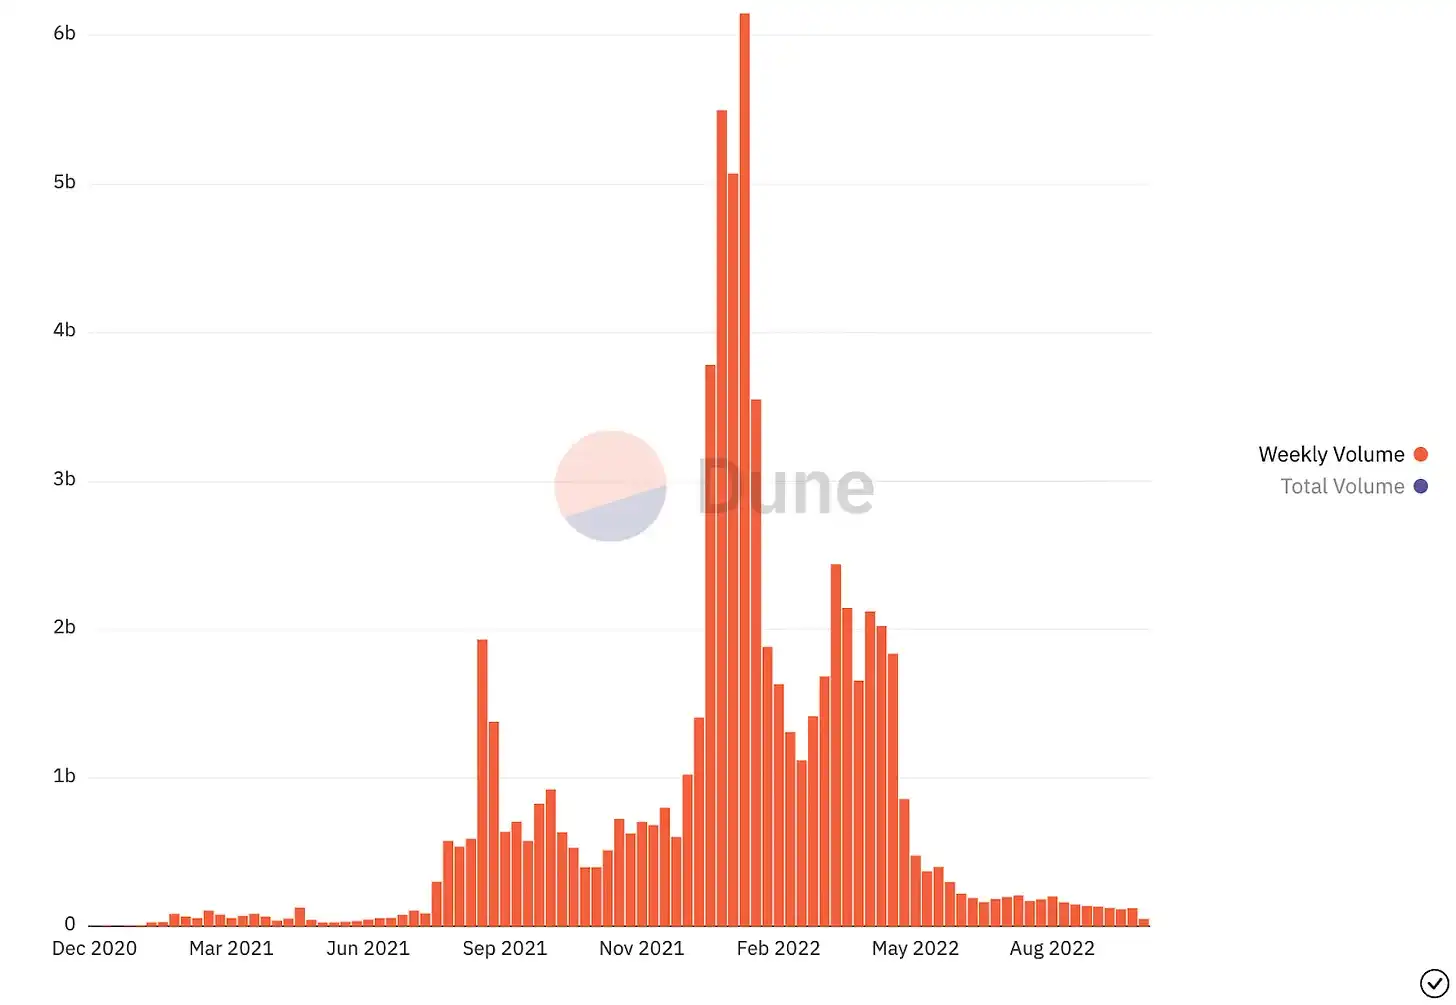
NFT Market volume, source: Dune Analytics
The data measures transaction volume in NFT markets such as OpenSea and LooksRare.
The decline in NFT trading activity can be attributed to the weakness in the cryptocurrency market and reduced speculation due to the collapse in NFT prices. As with ERC-20, NFT trading volume is positively correlated with price behavior.
Data: The average daily number of NFT traders grew 67.8% from 13,861 to 23,254.
The data measures the average number of users trading NFTS on a daily basis during the quarter.
This growth is likely due to a broader understanding of the ecosystem among retail users and the increasing maturity of the NFT market structure.
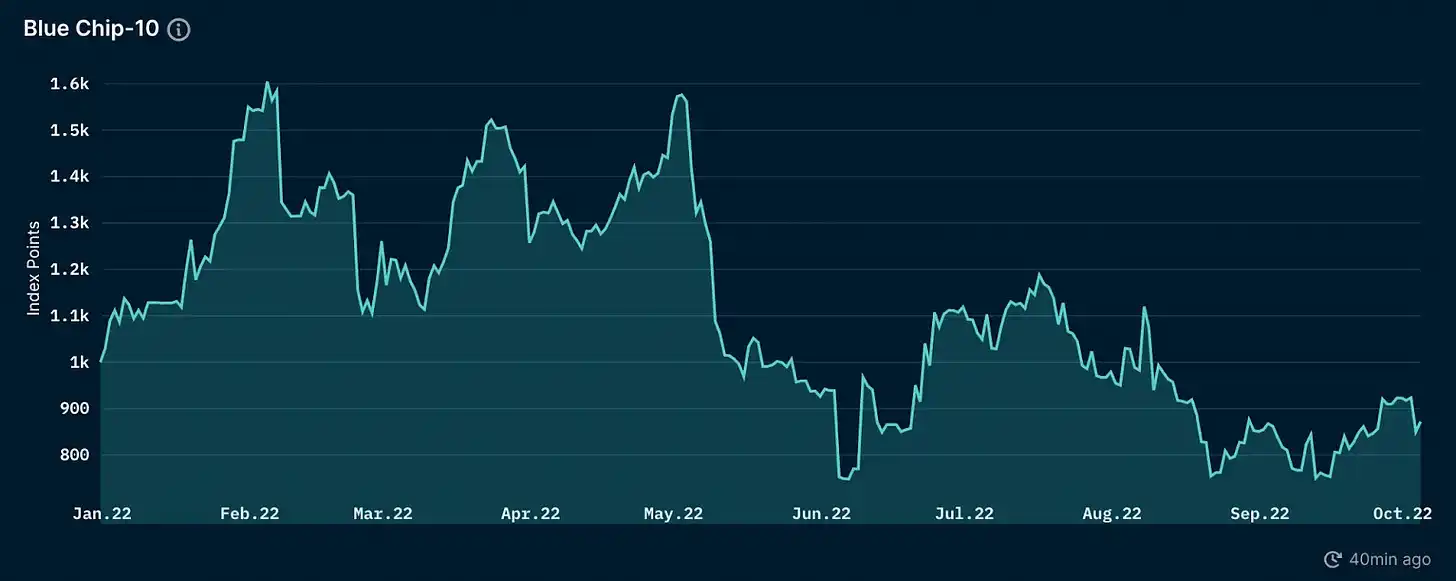
Nansen Blue Chip-10 Index, source: Nansen
The Nansen Blue Chip-10 index fell 15.5% in ETH terms.
Note, the Blue Chip-10 is a market-cap weighted index used to track a collection of top 10 NFTS.
This decrease could be attributed to an increase in ETH prices, which increased by 24.43% during the quarter. NFTS do almost all of their trading in ETH, and historically, NFTS do not perform well when Ethereum prices rise because traders are less inclined to abandon appreciating assets.
Layer 2 ecosystem
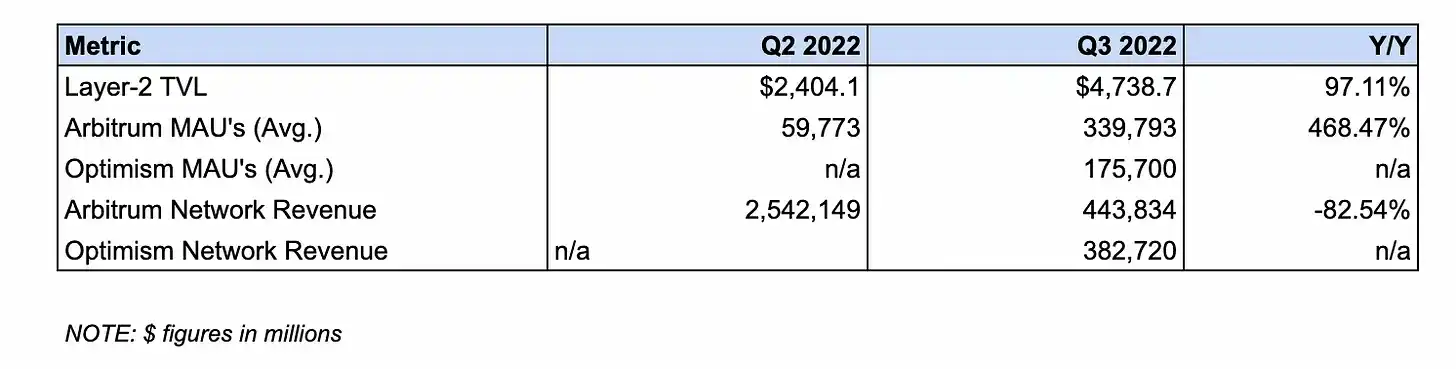
The numbers: L2 TVL increased 97.1% from $2.4 billion to $4.73 billion.
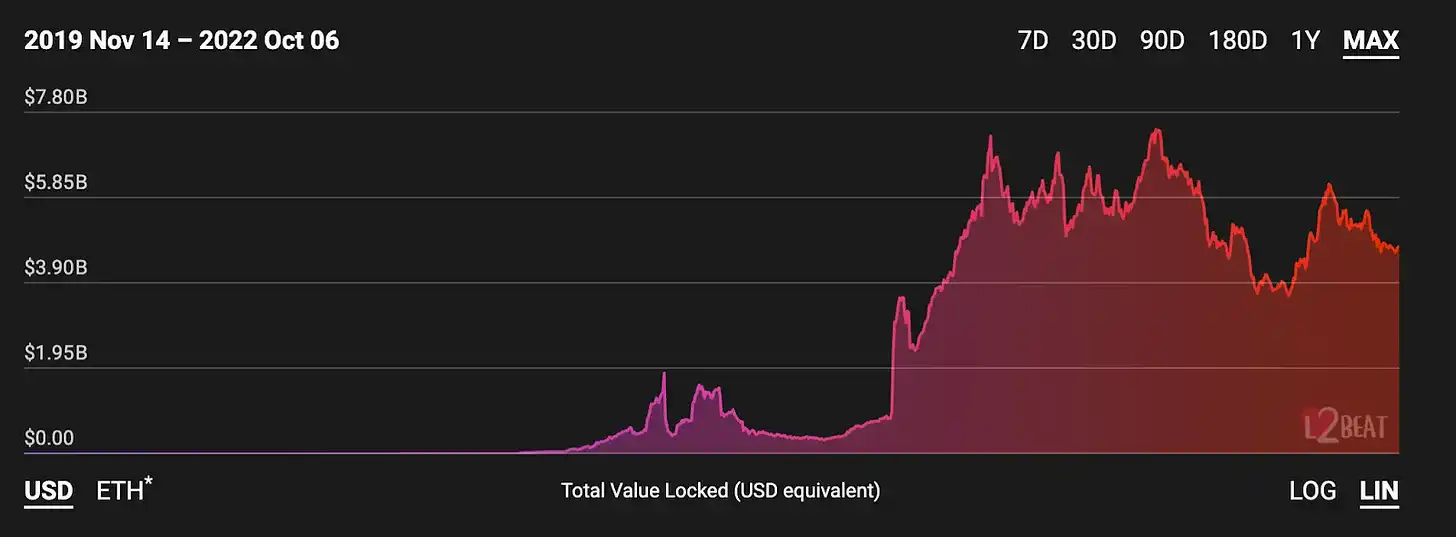
L2 TVL, source: L2Beat
This data measures the value of transferring (via local or third party cross-chain Bridges) to optimistic rollups, zero-knowledge rollups, and validiums (weak trust extension) for Ethereum.
Much of this increase in TVL is related to the fluidity flowing into generic Rollups, such as Arbitrum and modernism. Together, they hold about $3.9 billion, or 81.5% of the value of those networks.
Data: Arbitrum's average monthly active address (MAA) grew from 59,773 to 339,793, an increase of 468.5%. The average MAA for Optimism was 175,700.
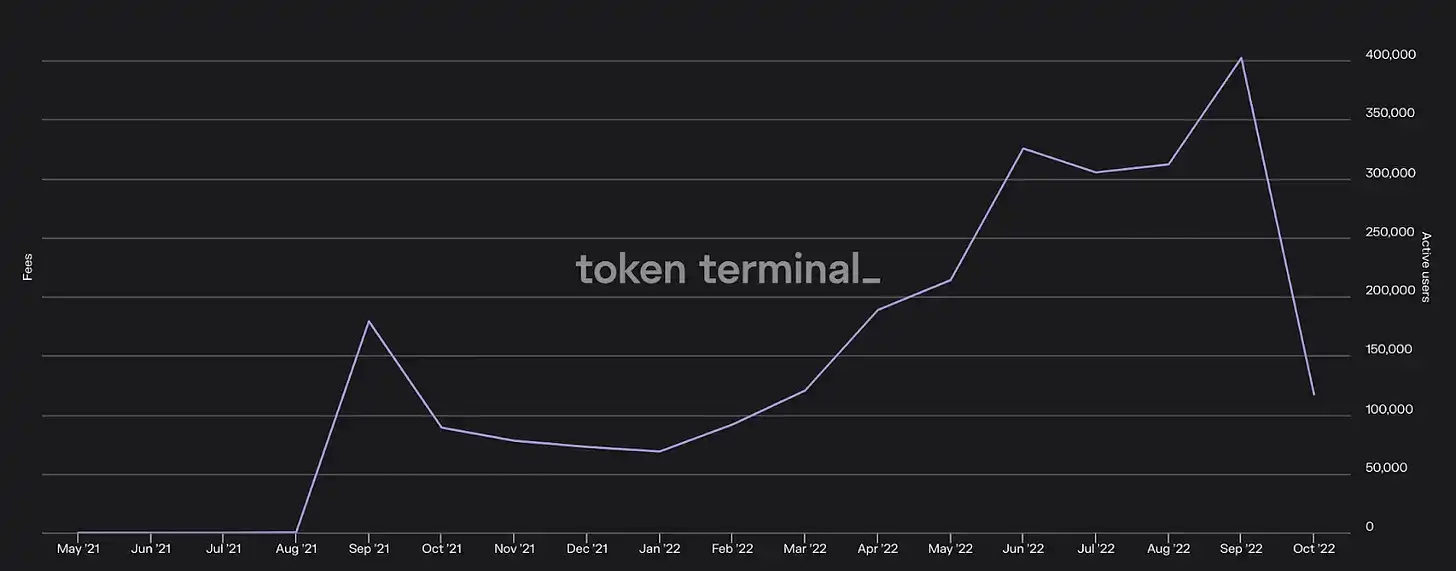
Arbitrum MAA, source: Token Terminal
This measures the average number of wallets traded on Arbitrum and Modernism for each month of the quarter.
Arbitrum's growth can largely be attributed to the popularity of protocols such as the perpetual trading platform GMX, whose deployment on the network attracted $397.2 million of TVL while facilitating $18.9 billion of trading volume.
The NUMBERS: Arbitrum's online revenue fell 82.5 percent to $443,000 from $2.54 million. Internet revenue for Optimism was $382,000.
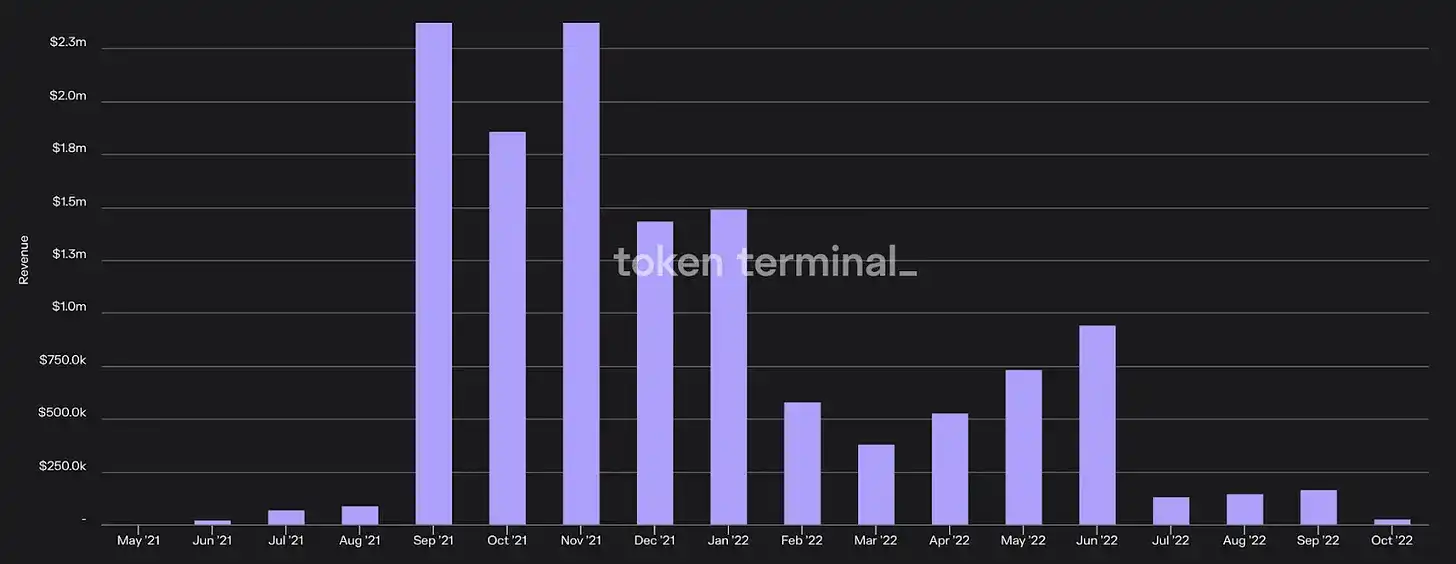
Arbitrum's network revenue, source: Token Terminal
This measures the transaction fee revenue earned by the sequencer on Arbitrum and modernism, respectively.
Arbitrum's revenue decline can be attributed to reduced demand for block space. As with Ethereum, this is due to bearish market conditions and a significant drop in speculative activity.
Note: Due to limited publicly available historical data on Optimism, we were unable to perform a Y/Y comparison of average monthly active addresses and Internet revenue.
Ecosystem Highlights
The Marge is complete
After years of development and anticipation, Etheruem has successfully merged from proof of Work (PoW) to Proof of Interest (PoS).
While the dust from the merger has yet to settle, we are already beginning to see the impact of the most significant upgrade in the network's history.
First, Ethereum's energy consumption plummeted almost overnight, dropping 99.98% from 77.77 TWH to 0.01 TWH. This not only reduces the environmental impact of the Ethereum network, but should also help increase the attractiveness of ETH among institutional TradFi investors with ESG mandates.
ETH circulation also saw a similarly sharp decline, dropping 95.7 percent to 0.17 percent from 3.76 percent. Despite the low on-chain activity described above, we have even seen Ethereum in ultrasonics for a few days.
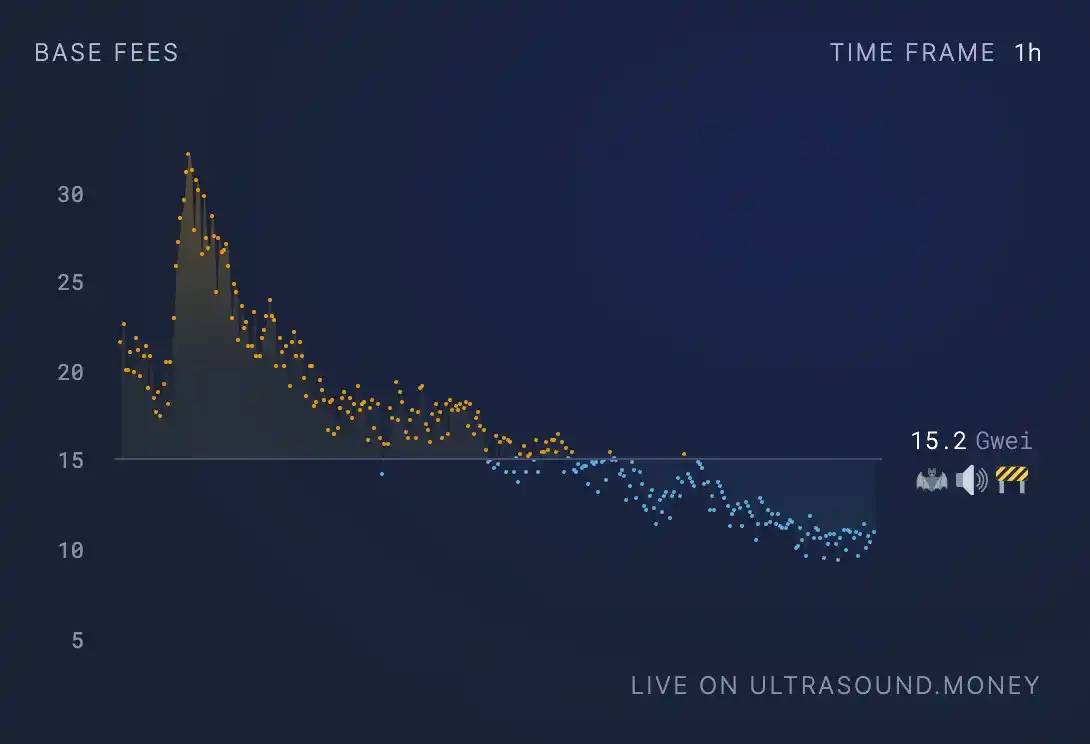
The orange period represents the supersonic currency mode! Daily time range.
Mergers have also begun to reshape the economics of the block space, and the transition to PoS has changed the dynamics of the MEV industry by introducing the separation of proposer and builder through MEV Boost, software developed by Flashbots that is able to separate block building from block production. As of this writing, approximately 47% of all block production is using MEV Boost.
On the other hand, mergers are beginning to affect the pledge space. Since the incident, the pledge yield has risen from about 3.5% to 5-6%, as issuance is now supplemented by transaction fees and MEV income, while deposits in liquid pledge agreements have increased by 1.27%.
The offerings of these agreements are likely to grow further following the Shanghai network upgrade, which will enable withdrawals from the pledged ETH, which is expected to be online within 6-12 months.
L2 summer
Bankless may be a year late on this front, but we finally had the first iteration of Layer 2 summer in Q3 because the two biggest optimistic rollups, Optimism and Arbitrum, Both mobility and community awareness increased significantly during the quarter.
Driven by higher OP prices and the introduction of incentives by governance funds, Modernism's DeFi TVL grew 234% to $916.97 million in the third quarter from $274.46 million. The jump came at a time when many other networks saw their liquidity shrink, with its market share across all L1s and L2s growing from 0.51% to 1.56% during the quarter.
Arbitrum 在本季度的 DeFi TVL 总量中的份额也有所增长,从 1.33% 增加到 1.78%。这种增长是由新协议的兴起推动的,例如永续交易平台 GMX,有助于推动 Arbitrum 生态系统 Token 的优异表现。L2 还在 8 月份推出了 Nitro 网络升级,这增加了交易吞吐量并降低了终端用户的成本。值得注意的是,Arbitrum 的增长完全是有机的,因为流动性是在没有明确的 Token 激励的情况下自发产生的。
Optimistic Rollups isn't the only L2s genre in Q3, however, as zkSync, Polygon, and Scroll have all announced their plans to launch their zkEVMs on testnet or mainnet by the end of 2022.
zkEVM is considered the holy Grail of extensions because it combines EVM's network effects and developer tools with zkRollups' increased transaction processing capabilities. While it is unclear how they will perform in production, the upcoming zkEVM could shake up the increasingly competitive L2 landscape.
Looking to the future
Within the Ethereum ecosystem, there are many exciting developments that promise to support the network's long-term growth prospects.
At the protocol level, an exciting recent upgrade is the EIP-4844, which will introduce Proto-danksharding, the predecessor of danksharding. Proto-danksharding is used to implement most of the logic and underlying rules that make up the complete Danksharding specification, such as transaction formats, validation rules, etc.). Likely to be implemented in the Shanghai upgrade mentioned above, EIP-4844 will introduce blob transactions, a new standard that will improve Ethereum's ability to act as a data availability layer by dramatically reducing the cost of storing call data on-chain.
The biggest beneficiary of the upgrade is L2, as storage of call data is easily the biggest contributor to their cost structure. Once successfully implemented, EIP-4844 will reduce gas costs for these networks by orders of magnitude by reducing the cost of on-chain data storage, and increase the ability to use L2s and migrate mobility.
另一个大型基础设施催化剂是 Arbitrum Token 的预期推出。 Token 的分发很可能会在 Arbitrum Odyssey 之后公布,该活动旨在让用户与网络上的协议进行交互,并且随着 Nitro 的升级完成,预计很快就会恢复。Arbitrum 的 Token 可能部分会用于各种协议的激励计划,应该有助于催化大量资金流入生态系统。
Despite these positive catalysts, there are several dark clouds hanging over the ecosystem, the most pressing of which is regulation.
在美国财政部海外资产控制办公室(OFAC)最近决定制裁混合器 Tornado Cash 之后,围绕以太坊的监管绞索正在收紧。这导致各种实体要么冻结资金、要么屏蔽用户,要么审查交易以遵守规定。这一点以及其他发展(例如 CFTC 起诉参与治理的 Ooki DAO Token 持有者)将如何影响以太坊的去中心化和可信的中立性,还有待观察。
The results table
agreement
DeFi ecosystem

The NFT ecosystem
L2 Ecosystem
The original link
Welcome to join the official BlockBeats community:
Telegram Subscription Group: https://t.me/theblockbeats
Telegram Discussion Group: https://t.me/BlockBeats_App
Official Twitter Account: https://twitter.com/BlockBeatsAsia
 Related Articles