Anthropic Prospectus Analysis: Lost $80.7 billion, why is operating cash flow positive?

Anthropic, the developer of Claude, has finally put its books in front of the public market. On October 26, the company submitted a public version of its S-1 prospectus to the U.S. Securities and Exchange Commission, applying to list on Nasdaq under the ticker "ANT," with the offering price and number of shares left blank.
Flipping through the document, what makes one pause most is the starkly different impression given by the income statement and the cash flow statement. The net loss for the first half of the year was approximately $80.7 billion, yet operating activities brought in about $3.9 billion in net cash inflow. How could the same company's business show these two numbers at the same time?
The answer lies in the composition of the loss. However, before unpacking those financial instruments, there is another change closer to Claude's day-to-day business. According to the quarterly statements disclosed in the prospectus, second-quarter revenue already exceeded operating expenses for the quarter.
Can Claude's revenue already cover quarterly expenses?
First, look at the quarterly operating performance table. Second-quarter operating profit reached $974 million, with an operating margin of about 8.4%. Converted as a proportion of revenue, for every sale recognized in the quarter, after deducting the operating expenses listed in the statements, a small amount of operating profit was already left over.
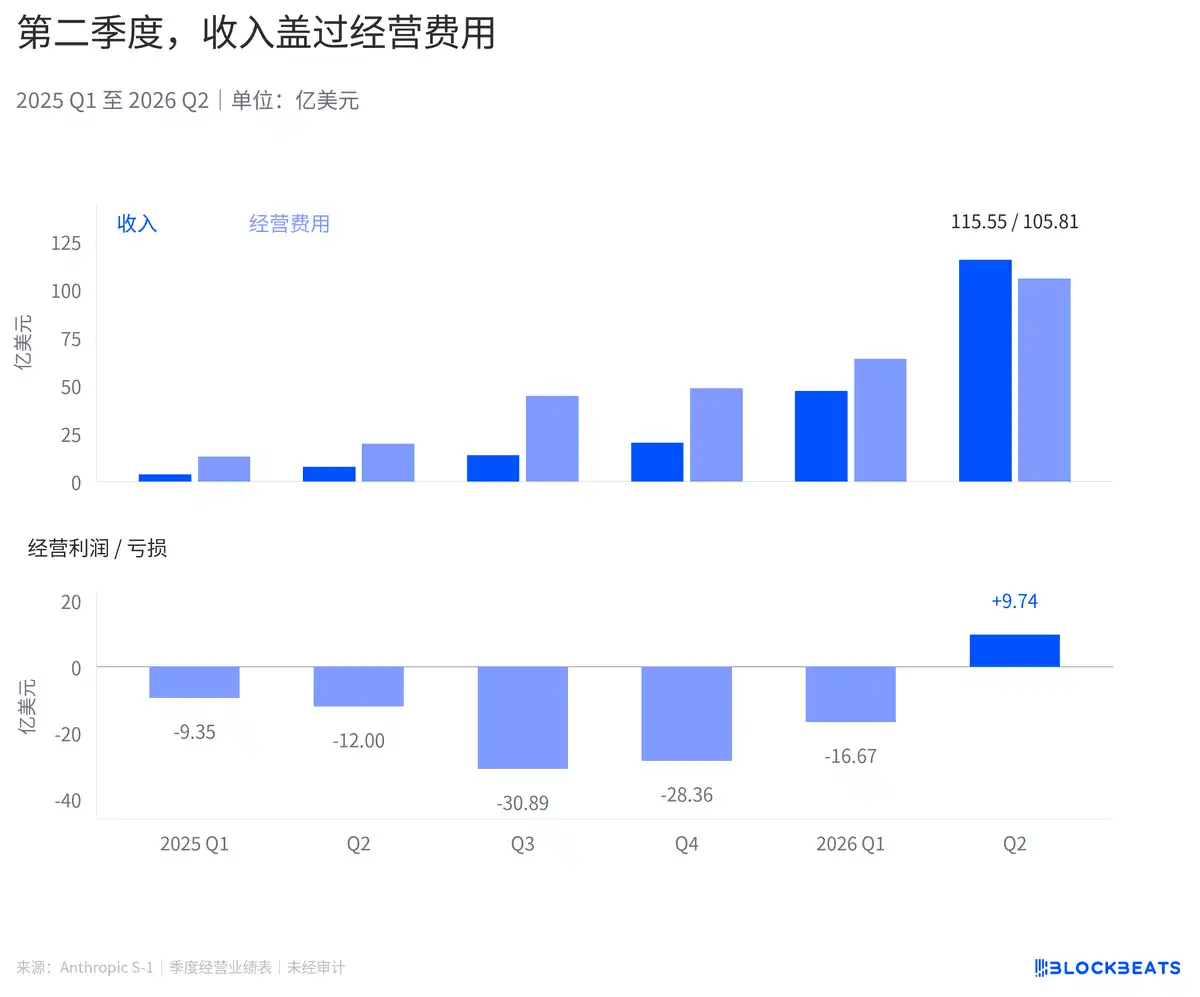
Second-quarter revenue exceeded operating expenses, and operating profit turned positive
As the chart above shows, the reason for crossing the break-even line is that revenue growth outpaced expenses. Bills for compute and personnel are still rising, and sales and partnership expenses are also expanding—it's just that revenue is climbing faster. This is a different kind of operating change from squeezing out profit after cutting investment.
But looking back at the entire first half, operating activities still recorded a loss of approximately $693 million. The operating profit earned in the second quarter has not yet fully covered the gap left by the first quarter. Looking only at the latest quarter versus only the half-year total will yield different intuitions.
The company changed its expense presentation in the prior year, switching from items classified by function such as cost of revenue and research and development to classification by nature such as compute and personnel, with historical periods also restated under the new method. Gross profit is no longer separately presented.
So the question of how much gross profit is left for every additional model service sold remains unknown.
Since operations are near break-even, where does the massive net loss come from?
In the income statement, after the operating results there is a large block of gains and losses on financial instruments. The company previously raised financing through convertible bonds and other means, and these instruments need to be remeasured under applicable accounting rules. The prospectus states that changes in the fair value of convertible bonds and similar instruments were mainly driven by increases in enterprise valuation.
It can be understood as two ledgers updated simultaneously. One records the results of Claude selling services, using compute power, and paying personnel costs; the other records the gains and losses that need to be recognized on financing arrangements as valuations change. Losses in the second ledger also flow into the final net loss.
In the cash flow statement, the company adds back fair value changes related to convertible notes, derivative liabilities, and simple agreements for future equity, amounting to approximately $72.4 billion. Such add-backs eliminate the impact of non-cash items in the income statement, and no equivalent amount of cash therefore enters the bank account.
Net loss, after adjustments for financial instruments, other non-cash items, and working capital, turns into net cash inflow from operations
Based on calculations from the cash flow statement, these working capital changes contributed a total net inflow of approximately $1.168 billion in the first half. The company stated in its management discussion that cash flow improvement was also affected by the timing of supplier payments and customer collections. Collecting payments earlier, delaying payments, or drawing down previously prepaid compute power can all make cash performance in a given period look better than profit performance.
Therefore, positive operating cash flow has practical significance, indicating that the results of operating receipts and expenditures have changed during the period. It still needs to be read in the context of collection and payment timing, and cannot alone prove that the same cash generation capability can be maintained in every future quarter.
With so much cash on the books, is there enough to pay for future compute power?
Next, look at where the funds came from. The cash flow statement in the prospectus shows that net cash inflow from financing activities in the first half was approximately $110.8 billion. Compared with cash generated from operations, financing was the main source of additional funds during this period.
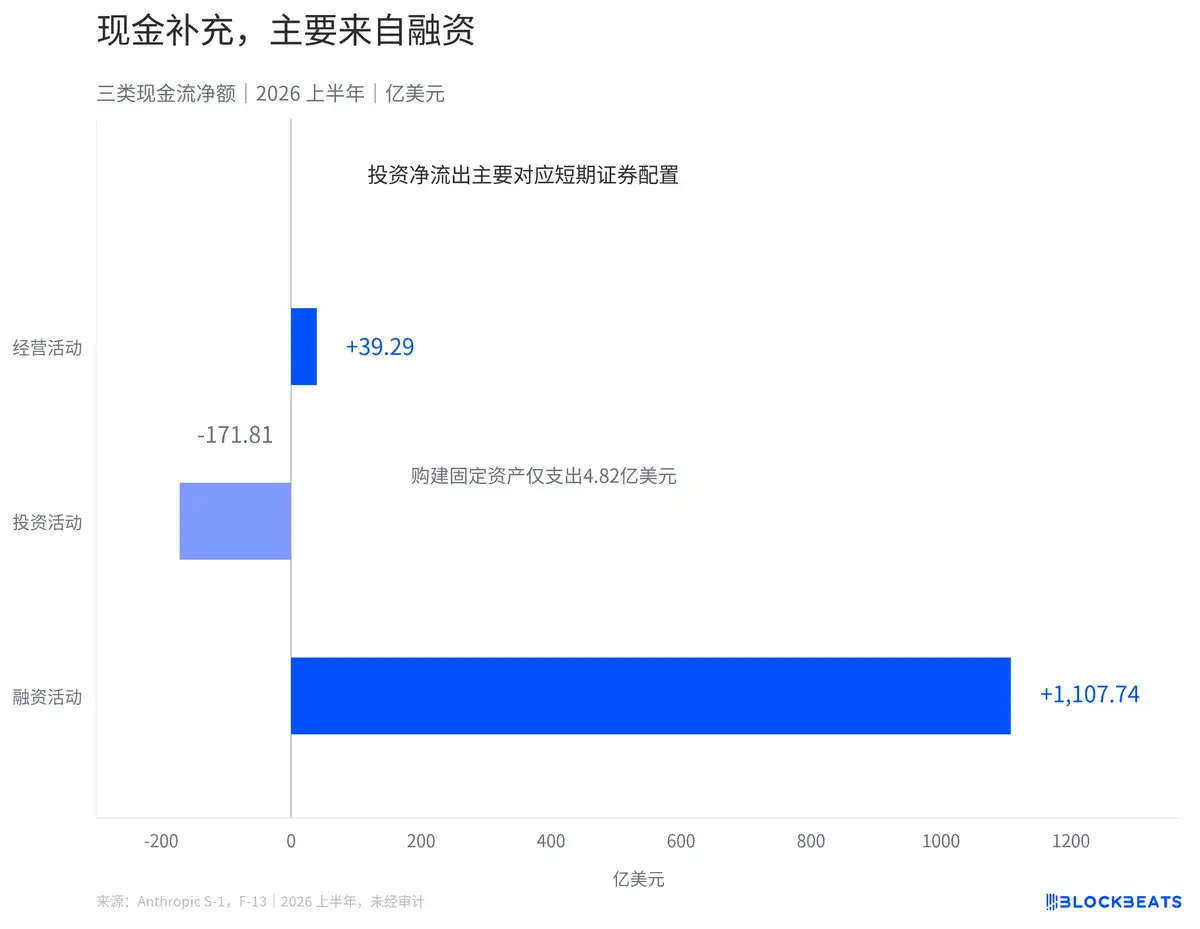
First-half financing cash flow was far higher than operating cash flow, and net investing outflow mainly corresponded to short-term securities allocation
The net cash outflow from investing activities was not used to buy servers and data centers; a considerable portion was used to purchase short-term securities.
Cash expenditures for the purchase and construction of fixed assets during the same period were $482 million, far less than the total net outflow from investing activities. Purchasing short-term securities increases investment expenditures on the cash flow statement, but it cannot be concluded from this that the money has already been consumed as compute buildout costs. The compute costs of training models also cannot simply be equated with expenditures on purchasing and constructing fixed assets.
The prospectus discloses that cash, cash equivalents, and short-term investments totaled approximately $131.7 billion at mid-year. To understand this reserve, it is necessary to remember both its source and its use: financing supplemented today's cash pool, and future contractual arrangements determine when this money will need to be paid out.
Among the purchase commitments disclosed in the notes, non-cancellable agreements with remaining terms exceeding one year had risen to approximately 4.9 times the prior year-end level by mid-year. These figures reflect supply obligations already locked in—even if revenue slows in the short term, contracts may not be able to shrink accordingly.
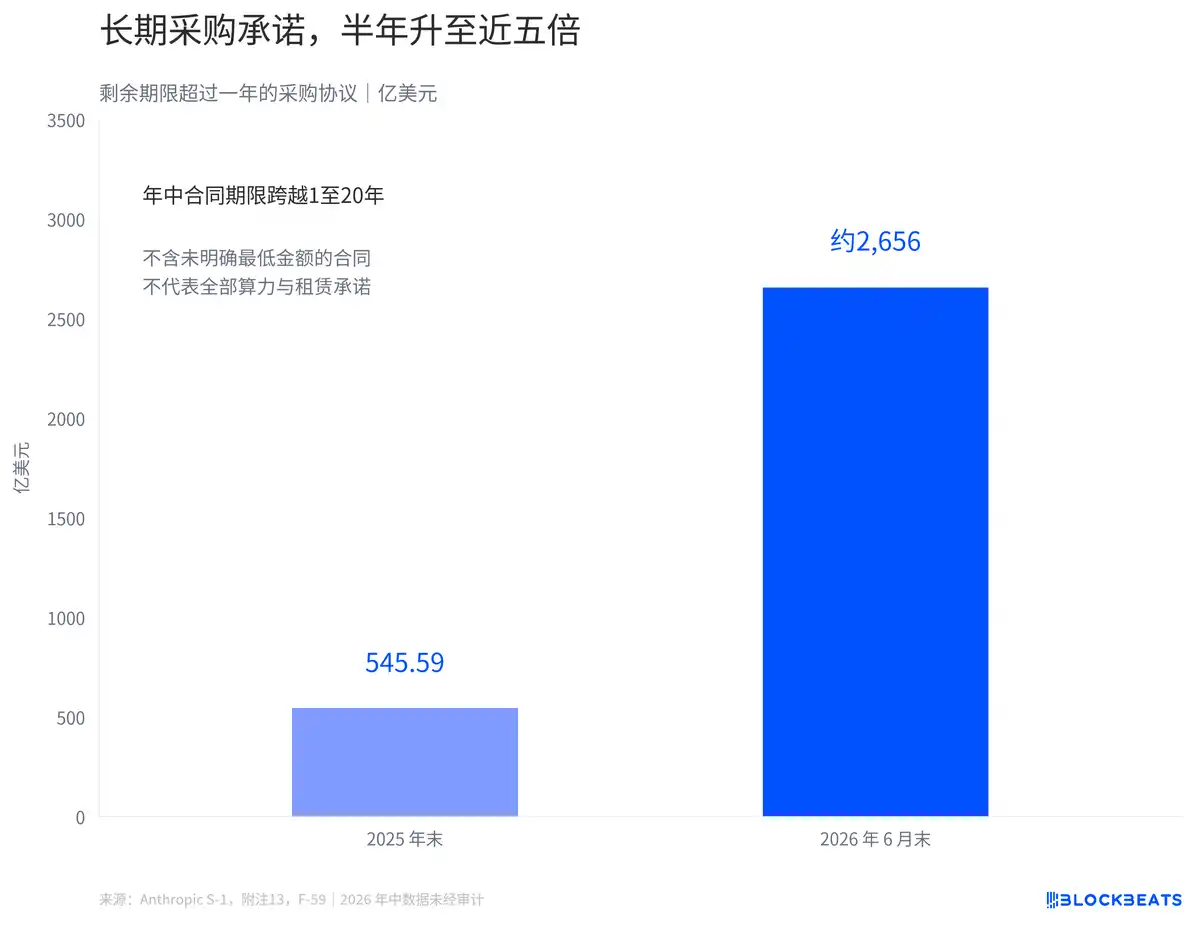
Mid-year fixed or minimum guaranteed purchase commitments rose to approximately $265.6 billion
As of mid-year, the fixed or minimum guaranteed commitments under such agreements totaled approximately $265.6 billion.
This figure also does not cover all compute spending. The notes explicitly state that some agreements do not specify fixed or minimum dollar commitments, with actual payments depending on delivered capacity, timing, and pricing, and therefore are not included in the above amount. Leases, purchases, and arrangements without specified minimum amounts also cannot be aggregated into a single total without verification.
The company notes in its risk factors that its revenue is primarily usage-based, with a significant portion not backed by long-term contracts, while compute obligations often extend for multiple years. Customers can increase or decrease usage today, yet minimum payment requirements on the supply side may persist.
Second-quarter operating income answered whether in-quarter service revenue could cover operating expenses; the payment dates on multi-year purchase contracts are a separate ledger.
Welcome to join the official BlockBeats community:
Telegram Subscription Group: https://t.me/theblockbeats
Telegram Discussion Group: https://t.me/BlockBeats_App
Official Twitter Account: https://twitter.com/BlockBeatsAsia

 Related Articles