ArkStream Capital: From AI Synergies to RWA Emergence, 2026 Crypto Market Fund Migration
Original Article Title: "ArkStream Capital: From AI Syphon to RWA Emergence | Fund Migration in the 2026 Crypto Market"
Original Source: ArkStream Capital
TL;DR
The following analysis and judgments are based on market data as of the end of Q2 2026 and the market environment at that time.
In the first half of 2026, Crypto's weakness did not stem from industry internal explosions but was driven by the Fed's hawkish policy shift, supply-side inflation triggered by the US-Iran war, and the continuous syphoning of liquidity by AI stocks. Meanwhile, the gains in the AI market are shifting concentration from chip leaders, cloud providers, and software application layers to physical supply chain bottlenecks such as storage and PCBs; the three super IPOs will also further test the AI's overvaluation and high burn rate model.
Against the backdrop of overall DeFi contraction, RWA has become one of the few areas in Crypto to experience net inflows: on-chain volume has grown from around $21.6 billion at the beginning of the year to $33 billion, with tokenized stocks and RWA perpetual contracts seeing the fastest growth. The demand for "coins" is weakening, but the demand for trading traditional assets such as stocks and commodities through the Crypto infrastructure is rapidly rising. Our assessment is that the stock market's syphoning effect on Crypto may have peaked in June 2026; unless a significant new bearish development occurs in the industry, the market may have entered a phase of slow recovery.
Macroeconomic Environment: Policy Shifts and Geopolitical Impacts
This section revolves around three main themes: the complete reversal of monetary policy expectations from "rate cuts" to "rate hikes" after the change in Fed leadership, the continued disruption of the energy and inflation chain by the US-Iran war, and the risk-off choices of global funds in the context of US-China competition. Together, these factors determine the pricing environment for all risk assets this quarter and explain why the crypto market has weakened while global stock markets have risen.
The macroeconomic environment in the first half of 2026, which we define as "asset pricing differentiation under a triple impact," is characterized by the policy shift, ongoing geopolitical conflicts, and the extreme concentration of funds in the AI market. All three factors combined have led to the largest performance differentiation among different assets in this cycle under the same interest rates and liquidity conditions. The Dow Jones Index hit a historical new high at the end of the quarter, with the South Korean KOSPI rising by over 100% in the first half of the year, while Bitcoin saw a monthly drop of around 20.5% in June, and the Crypto Fear and Greed Index dropped to 15—such a level of deviation is rare in the comparison of major asset classes in the past decade. Understanding the reasons for this deviation is a prerequisite for understanding the performance of the crypto market this quarter.
Fed Leadership Change: From "When to Cut Rates" to "Whether to Hike Rates"
In the fourth quarter of 2025, the market was only experiencing a slowdown in the rate-cutting pace; in the first half of 2026, the entire rate-cutting narrative was completely overturned. This reversal was not caused by a single meeting or a single piece of data; it took a full two quarters to gradually erode the early-year optimism.
· Three Months of Expectation Reversal
1. In January, the market's mainstream pricing for 2026 was still "two to three rate cuts," with CME rate futures at one point suggesting that the first rate cut of the year could fall in the second quarter; at the April meeting, the dissenting votes reached a new high since 1992, with at least five officials publicly stating that the next policy direction could be a rate hike; in May, Kevin Warsh officially succeeded Powell as Fed Chair; in June, over half of the officials on the dot plot shifted to the rate hike side. In half a year, the market changed from "two to three rate cuts" to "at least one rate hike within the year."
Kevin Warsh's stance change was particularly noticeable: he criticized the Fed for committing a "fatal policy mistake" from 2021 to 2022 at his confirmation hearing and had previously expressed willingness to lower rates, believing that high rates were harming economic vitality—based on this track record, the market had initially tagged him as dovish. However, the data did not give him that opportunity: in April, U.S. real wages slipped by 0.5% month-over-month for the first time in nearly three years, and the impact of inflation on household purchasing power had already surfaced; May's price data showed a comprehensive downturn. His first dilemma was not "to cut or not to cut rates" but "how to avoid getting caught in the rate hike debate."
· June FOMC: A Macro Narrative Watershed
The meeting on June 16th and 17th marked a watershed in this quarter's macro narrative. The decision itself was uneventful: the federal funds rate remained unchanged at 3.50%–3.75% for the fourth consecutive time, unchanged since the last rate cut in December 2025. What really caused a stir were three unconventional signals.
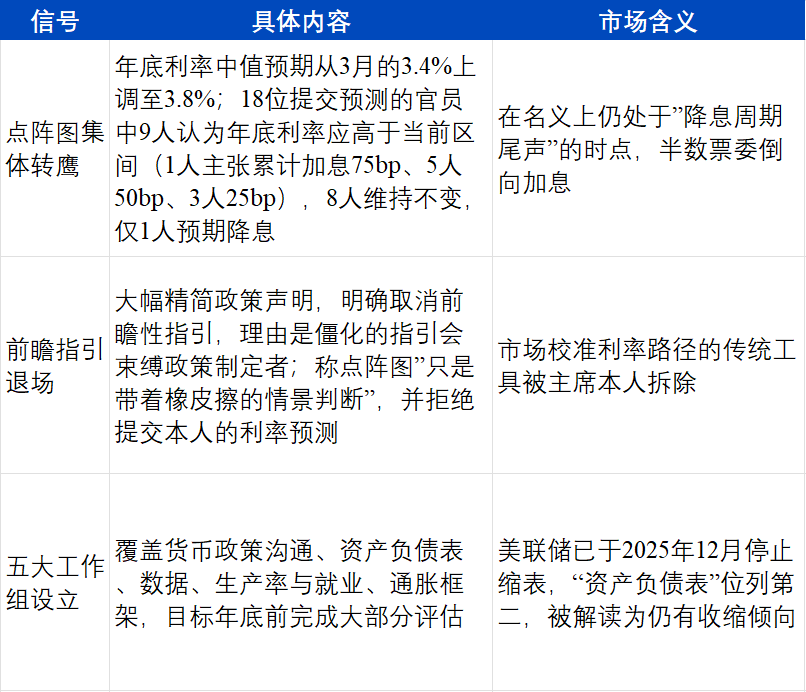
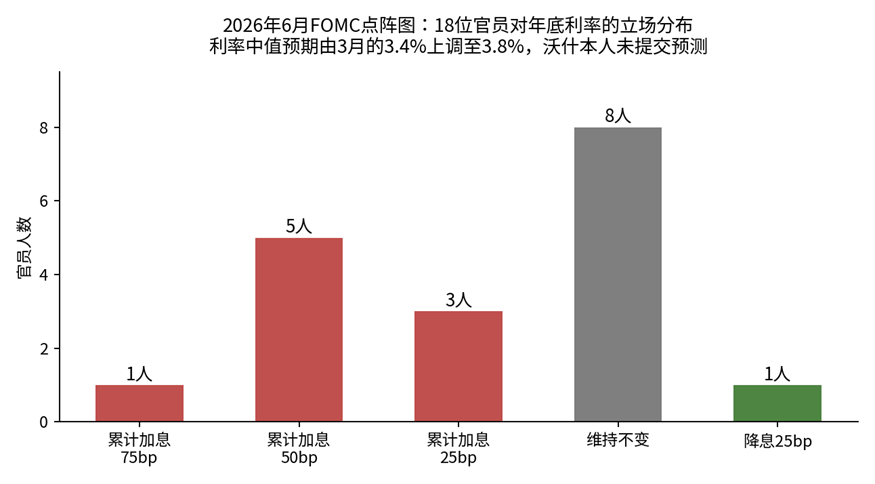
June 2026 FOMC Dot Plot Distribution (Fed SEP, ArkStream compilation)
In the concurrently released Summary of Economic Projections (SEP), officials revised the median real GDP growth rate for 2026 down to 2.2%, slightly adjusted the unemployment rate expectation to 4.3%, and simultaneously raised short-term inflation expectations. With growth downgrades, inflation upgrades, and rate hikes, three arrows point to one word: stagflation concerns.
ArkStream Capital believes that the combined impact of these three signals is more important than the question of "whether to hike interest rates" itself. Over the past decade, the market has relied on dot plots, forward guidance, and chair press conferences to piece together a complete set of tools for calibrating the interest rate path. The first thing Powell did when he took office was systematically dismantle the credibility of this toolset. With the calibration tools gone, the volatility of rate expectations could only passively rise, leading to the turmoil in asset pricing this quarter, especially high-beta assets (in previous quarterly reports, we classified crypto assets led by BTC into this category).
· The Dual Nature of Data: Inflation Stickiness and Employment Swings
What has supported the hawkish turn is the substantial deterioration in price data. May's CPI rose by 4.2% year-on-year and 0.5% month-on-month, primarily driven by energy; PPI for final demand surged by 6.5% year-on-year and 1.1% month-on-month, with final demand goods prices rising by 2.8% on a monthly basis, and the war-driven upstream production costs are still being transmitted downstream.
However, the structure of inflation is not uniform, which is crucial for determining the policy path. Core CPI rose by 2.9% year-on-year and 0.2% month-on-month, still manageable; research from the Dallas Fed shows that core PCE (around 3%) and trimmed mean PCE (around 2.3%) have shown a clear deviation, indicating that the pressure in this round is highly concentrated in categories such as energy and transportation that are experiencing supply shocks and has not yet spread comprehensively to the services and wage sectors.
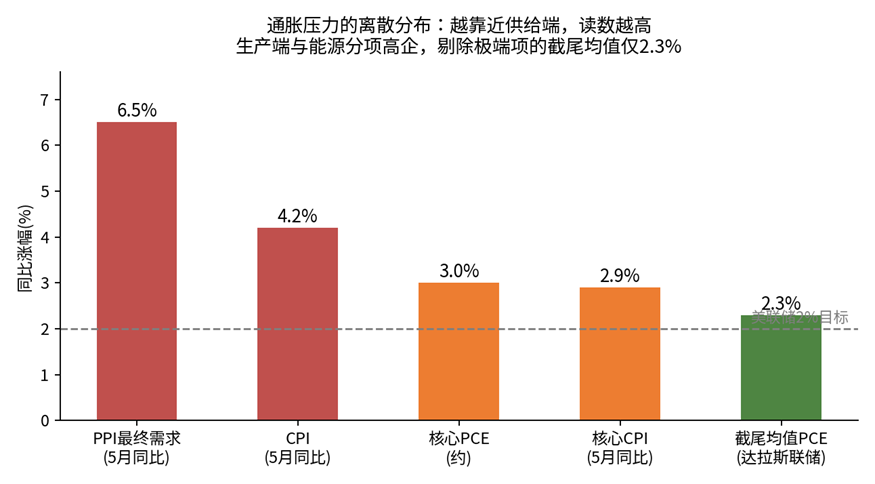
Discrete Distribution of U.S. Inflation Subcomponents in the First Half of 2026 (BLS, Dallas Fed, compiled by ArkStream)
The trigger for this round of inflation was the U.S.-Iran war and the closure of the Hormuz Strait.
On the employment side, there was a dramatic turnaround during the quarter:
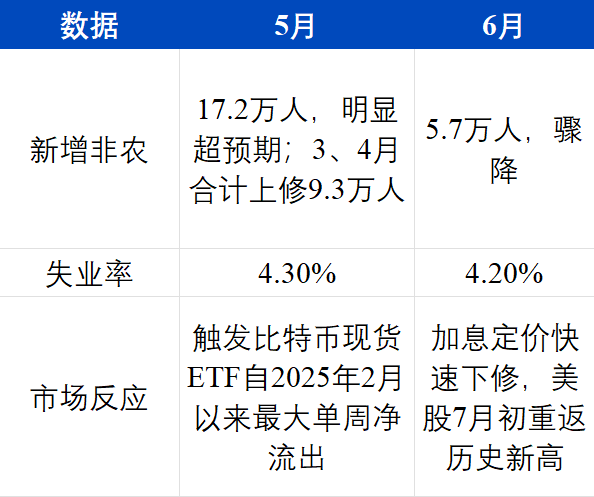
The report in May, "so strong that rate cuts are out of the question," directly fueled rate hike expectations; by June, disturbed by the World Cup and holiday mismatches, market pricing began to fluctuate: after the June FOMC meeting, CME data showed the probability of an October rate hike briefly rose to 60.7%, with the money market fully pricing in a 25-basis-point hike in December; the June NFP report, combined with Powell's softened statement at the ECB Forum, saying "in the past four weeks, inflation expectations have eased," led to a rapid retreat in rate hike pricing.
Disagreement in the market is also rare: Bank of America predicts a 25 basis point rate hike in September, October, and December, with the year-end interest rate range up to 4.25%–4.50%; Huatai Securities gives a close to 50% probability of a rate hike in December; CICC and CITIC maintain their view that there will be neither a rate hike nor a rate cut this year. The same set of data can lead top institutions to interpret three different directions, which is not common in the history of Fed watching over the past decade.
In our first-quarter report, we hinted that the "rate turning point itself faces the risk of being overturned, and the scenario of no rate cuts or even rate hikes throughout the year needs to be taken seriously." This scenario became a reality in the second quarter and evolved beyond our previous estimate. Continuing to clarify the correlation between interest rates and Bitcoin: the three rate cuts from the end of 2024 to 2025 constitute the "loose trading period," the fourth quarter of 2025 enters the "expectation digestion period," and the second quarter of 2026 officially enters the fifth stage—the rate hike expectation period. The most troublesome aspect of this stage is the two-way volatility: every swing in rate expectations is echoed by high-beta assets in an amplified amplitude, and the costs of both long and short positions are simultaneously raised, causing oscillations and forcing funds to stay on the sidelines.
· Abandoning Forward Guidance: Why It Has a Particularly Large Impact on the Crypto Market
This point is worth highlighting separately because its impact on different assets is asymmetric.
For traditional assets, the disappearance of forward guidance mainly means an increase in the difficulty of duration management. Institutions can respond by shortening duration, increasing hedging, and raising cash levels, and financial instruments are intact. However, the pricing of crypto assets highly depends on the "direction of rate expectations," and there is a lack of rate hedging tools—there are no Bitcoin interest rate swaps in the market, no duration-matched crypto fixed-income products, and institutions can only reduce positions. In other words, when macro visibility decreases, the response for traditional assets is to adjust the structure, while the response for crypto assets can only be position reduction.
This explains a counterintuitive phenomenon this quarter: the June FOMC did not actually raise interest rates, not even by a single basis point, but the intensity of the reaction in the crypto market far exceeded that of the U.S. stock market. Market trading is never about the current interest rate level but the confidence interval of the future rate path—when the confidence interval is proactively widened, the first category of assets to be sold off will certainly be those on the most edge, with the least hedging tools on the risk budget table. This is also further validation of what we proposed in the first quarter after stating "the macro pricing power of crypto has not yet been regained": until the Fed completes the reconstruction of its communication framework, the crypto market will find it difficult to regain control of its pricing power.
US-Iran War: Uncontrollable Variables and Supply Shock Inflation
The U.S.-Iran military action that began on February 28 did not conclude in the second quarter but instead turned into a war of attrition.
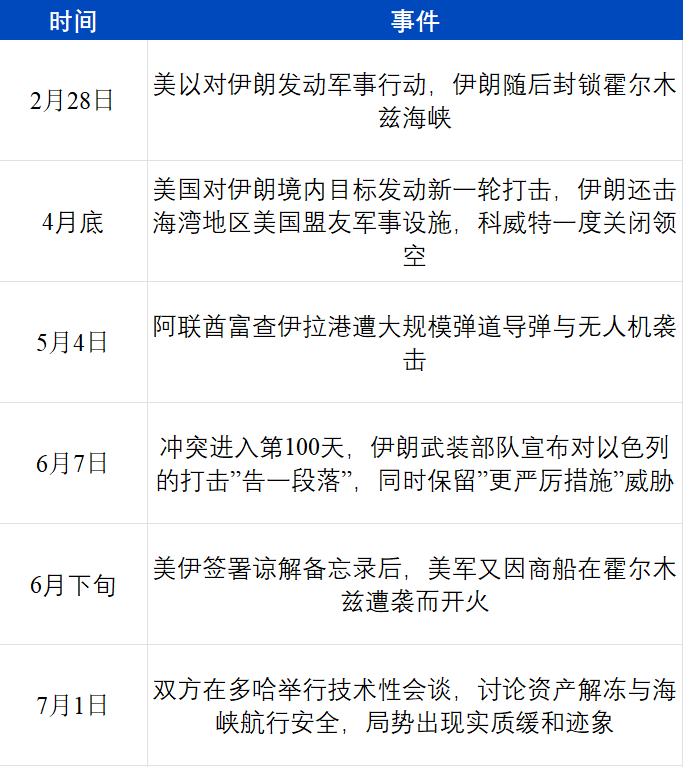
For the financial markets, there was only one transmission path for this war, but it was blunt enough: Strait of Hormuz blockade → Middle East oil-producing countries forced to cut production → Oil price surge → CPI energy component spikes → Rate cut expectations erased, rate hike expectations rise → Global risk assets sell-off.
Each link in the chain has specific numbers that are visually reflected in financial market pricing. On the supply side, oil production from Iraq's southern oil fields plummeted from 4.3 million barrels per day to 1.3 million barrels per day, with the Rumaila field alone cutting 700,000 barrels, and official warnings that if exports continue to be blocked, the production cut could expand to over 3 million barrels within days; Kuwait Petroleum Corporation announced a force majeure production cut, Qatar's energy suspended LNG production and transportation, and Saudi Arabia's largest Ras Tanura refinery shut down after a drone attack. The details on the shipping side further illustrate the issue: several international insurance companies canceled war risk coverage for vessels in high-risk waters, some routes were forced to detour around the Cape of Good Hope, adding an extra two weeks to the journey, and several supertankers carrying 6 million barrels of crude oil were stranded in the Persian Gulf for over two months, finally starting to leave the strait around May 20. Asian refineries were forced to seek alternatives—India's MRPL issued a force majeure notice, reducing production by 20% to 30%, Japan and Indonesia increased purchases of U.S. crude oil, and the U.S. Treasury granted a 30-day waiver of Russian oil sanctions to Indian refineries.
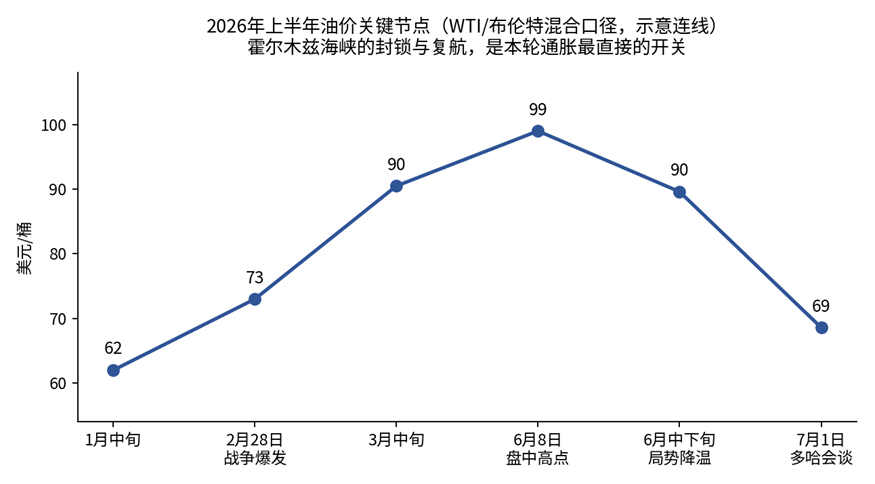
2026 First Half Oil Price Key Events (CME Group, ArkStream compilation)
Efforts to hedge the supply gap have been ongoing: the IEA announced the release of 400 million barrels of strategic reserves by 32 member countries, with 164 million barrels released as of May 8; OPEC+ has announced production increases for four consecutive months, with July seeing an increment of 188,000 barrels per day. However, with the strait blocked, the production increase is almost futile—oil cannot be shipped out, making quotas meaningless. The demand side is also being bitten back by high oil prices, with the IEA revising global oil demand growth from pre-war +1.2 million barrels per day to a direct downgrade of -420,000 barrels per day in 2026; South Korea has even reinstated odd-even license plate days in the public sector.
A comparison with the 2022 Russia-Ukraine conflict makes this situation even clearer. In the 2022 round, after oil prices surged, the Fed's response was aggressive rate hikes, going from zero interest rates to over 5%, with ample policy space and a clear direction. The market, though painful, at least knew how the script would unfold. This time's predicament is much more awkward: rates are already at 3.5%–3.75%, yet inflation is resurging due to an external shock, leaving the Fed with neither sufficient room for rate hikes nor the tailwind script of "inflation retreats—cut rates accordingly"; more troublingly, the 2022 supply shock mainly affected Europe's natural gas and food, with the U.S.'s energy self-sufficiency providing a buffer, whereas the Strait of Hormuz accounts for about a fifth of global oil shipping volume, leaving no room for buffering.
For the cryptocurrency market, the experience of the two rounds of impact was also different. Bitcoin's decline in 2022 was accompanied by a chain reaction of the industry itself (Terra, Three Arrows, FTX), where internal and external factors were hard to distinguish; this time, there were no equivalent credit events within the industry, nor were there enough major players' collapses to clear out, making the drop almost a purely external pricing outcome.
This round of inflation is driven by a supply shock, where rate hikes cannot stop the US-Iran ceasefire or reopen the Strait of Hormuz, leaving the Fed with only the option of raising rates. The mismatch between policy tools and the inflation trigger is highly likely to prolong the period of high interest rates, which is our most critical assessment of the macro tone for the second half of the year.
The US-China Strategic Game and Global Capital's "Flight to Safety"
The Trump administration introduced a "secondary tariff" policy during the quarter, where tariffs and wars created a dual-source cost shock, both affecting the supply side and both unable to be resolved through monetary policy.
China remained neutral in the conflict, controlling the direct impact of the blocked strait within manageable limits through diversification of energy procurement.
The strategic game between the US and China is happening in the supply chain rather than in energy, a layer directly related to the AI theme in the second part of this report. In the first half of the year, export controls around advanced processes, semiconductor equipment, and key materials continued to tighten, while China accelerated its efforts in AI self-reliance—DeepSeek V4 Pro achieved full-process training on Huawei's Ascend chipset, and ZhiPu GLM-5 became the first cutting-edge model fully trained on domestically produced chips. The outcome of the game is not a win for one side but a shift of the global AI supply chain from a "single optimal solution" to "two parallel systems," where each system must stockpile, expand production, and hoard capacity in key areas. This is precisely one of the deep-rooted reasons for the historic shortage in storage this round: the demand side is not just the growth of AI itself but also the repeated construction and strategic inventory buildup caused by geopolitical uncertainty.
In such an environment, global capital has chosen to "flight to safety"—avoiding assets with high valuations, distant cash flows, and sensitivity to liquidity, and embracing tangible bottlenecks. Even at the market level, a new term has emerged: HALO trades (Heavy Assets, Low Obsolescence), going long on sectors such as energy, raw materials, and infrastructure that are heavy on assets and low on obsolescence, which AI substitution cannot replace. The reason why the price surge of the global AI market this round was ultimately "squeezed dry" by these midstream to upstream sectors, rather than being taken by cloud providers and software application layers, is that the underlying logic aligns with HALO trades.
As for cryptocurrency, in the cognitive framework of most traditional investors, it happens to sit at the other end of this asset class: no cash flow, no physical barrier, highly sensitive to interest rates. The ultimate result of a triple macro impact is that cryptocurrency saw a separate decline amid the global rise in risk assets. Bitcoin fell by about 20.5% in June, ending the month at $60,760, just a stone's throw away from the 52-week low of $58,100, with a retracement of over half from the 52-week high of $125,500; Ethereum ended the month at $1,606, with a 60% decline from the 250-day high; Bitcoin spot ETF saw net outflows for 13 consecutive trading days from May 15 to June 3, totaling $4.4 billion, marking the longest outflow period on record, with a net outflow of $4.51 billion for the entire month of June, the worst month since the launch of the spot ETF; the Cryptocurrency Fear and Greed Index briefly dropped to the extreme fear zone of 15—while in the same week, the U.S. stock market was hitting new all-time highs.
On a macro level, this quarter can be summarized in four points:
1. The rate-cut narrative has collapsed for the second time, and this time it is structural. The change in leadership has brought not only a shift in stance but also a restructuring of the policy communication framework, significantly reducing the predictability of the interest rate path.
2. Inflation is supply-shock-driven, with a mismatch between policy tools and inflation drivers. As long as the situation in the Strait of Hormuz remains uncertain, the Fed does not have a dovish data basis, and the duration of high interest rates will be prolonged.
3. Risk budget flows to the "physical bottleneck." War and AI act together, with funds embracing visible and tangible scarce links such as energy and storage, placing cryptocurrency assets on the opposite side of this preference.
4. The macro pricing power of cryptocurrency has not yet been regained. This quarter, the trend of cryptocurrency assets was almost entirely determined by external variables, and there was no incremental narrative within the industry strong enough to hedge against macro headwinds—but there are signals of change in the RWA track, which we will delve into in Part Three.
Global AI Technology and Stock Market Dynamics
This section revolves around three main themes: the rhythm and pattern changes of large-scale model technology evolution in the second quarter, the sector rotation characteristics under the global stock market AI speculation frenzy, and the potential impact of the three major super IPOs—OpenAI, Anthropic, and SpaceX—on market liquidity and the AI valuation system. Together, these three aspects form a complete picture of the transition of this quarter's AI narrative from "technology faith" to "value validation."
Progress and Dynamics of AI Large Models in the Second Quarter
The second quarter of 2026 was one of the most intense release periods for large models in the industry in recent years. Following the intensive refreshing of benchmark records by models such as GPT-5.3 Codex, Claude Sonnet 4.6, and Gemini 3.1 Pro in the first quarter, from April to June, the three major manufacturers OpenAI, Anthropic, and Google continued their almost monthly iteration release pace, with domestic manufacturers also maintaining a synchronous follow-up trend.
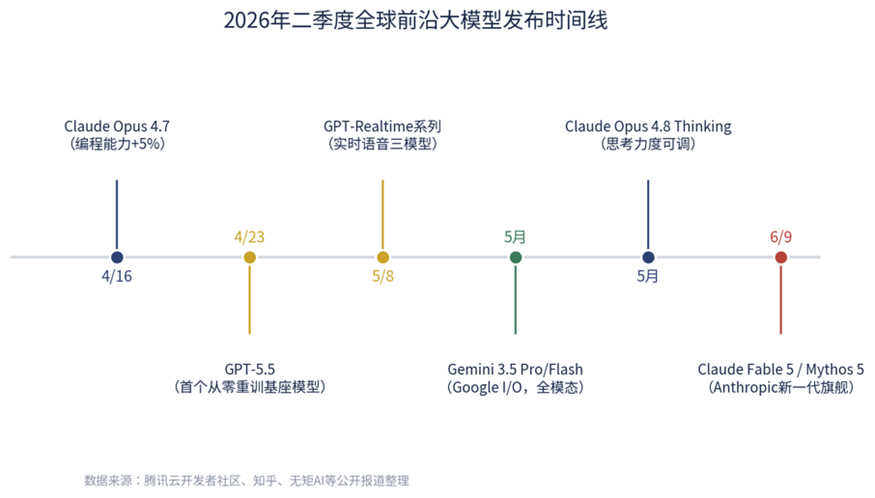
Global Advanced Large Model Release Timeline for the Second Quarter of 2026
From a technical standpoint, this quarter presented three distinct features:
• Parallel Base Model Retraining and Efficiency Optimization: GPT-5.5 is the first base model retrained from scratch by OpenAI since GPT-4.5, followed by the release of the fast version GPT-5.5 Instant for daily use scenarios, reflecting manufacturers' simultaneous efforts in "capability ceiling" and "cost reduction."
• Inference and Agent Capability Become Competitive Focus: The Claude Opus series iterated continuously to versions 4.7 and 4.8 from April to May, with programming and long-context consistency continually improving; the release of Claude Fable 5 and Mythos 5 on June 9 further raised the SWE-bench Verified benchmark to approximately 95%, representing one of the highest levels in the industry for inference and long-chain intelligent agent tasks.
• Coexistence of Native Multimodality and Price Wars: Google's Gemini 3.5 series released at the May I/O conference unified the processing of text, images, audio, and video from the first day of training, representing the "native multimodality" approach; meanwhile, manufacturers such as OpenAI and DeepSeek significantly reduced prices, with industry API costs continuing to decline, as "technological catch-up" and "price competition" unfolded simultaneously.
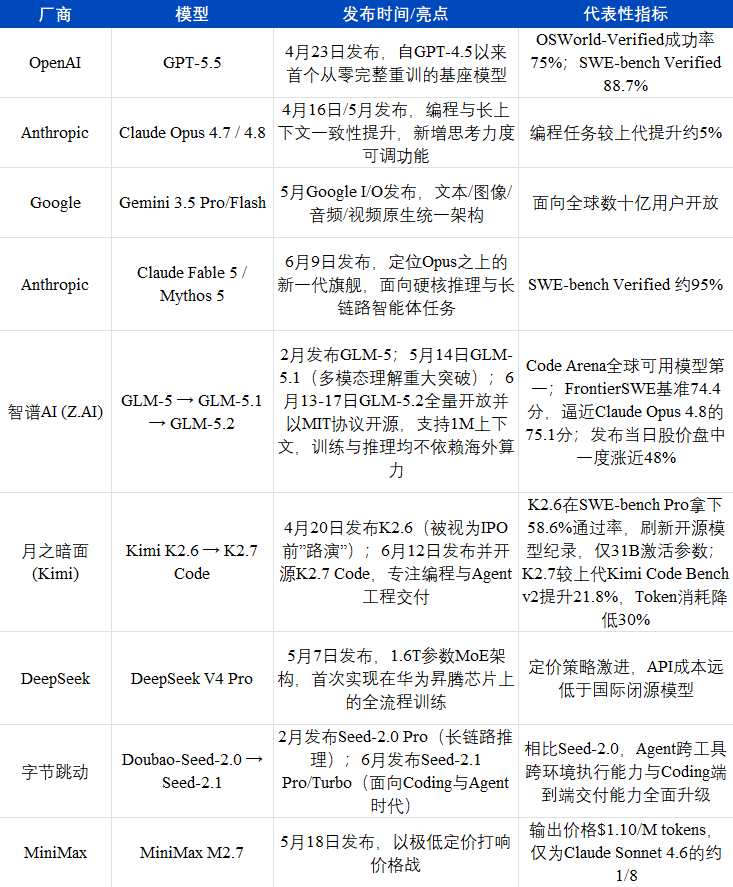
It is worth noting that the presence of domestic manufacturers significantly increased in this quarter: Zhifutu GLM-5 became the first cutting-edge model trained entirely on Huawei's Ascend chip, reducing the hallucination rate to 1.2%; the Moon's Dark Side (Kimi) K2.5 became the first open-source model to top the LMSYS Chatbot Arena. The simultaneous advancement of domestic controllable and open-source ecosystem-driven computing power is changing the landscape previously dominated by U.S. manufacturers in standard setting. For the crypto market, the continuous advancement of model capabilities is also directly catalyzing the pace of landing new narratives such as AI Agent integration with on-chain payments and stablecoin settlements.
Global Stock Market AI Frenzy: Sector Rotation Overview
If the second quarter's flurry of big model releases embodied the "technology narrative," then the simultaneous performance of global stock markets reflected the "capital narrative."
In the first half of 2026, the world's major stock markets presented a distinct hierarchical pattern: the Korea Composite Stock Price Index (KOSPI) surged by 101.1%, taking a commanding lead as the only major market index to double; the Taiwan Weighted Index (TAIEX) followed closely with a 59.3% increase; the Nikkei 225 Index rose by 39.2%; while the S&P 500 Index (+9.6%) and the CSI 300 Index (+7.5%) lagged far behind, with increases less than a tenth of the Korean market's. The divergence in performance among these five markets—from the highest at 101.1% to the lowest at 7.5%—exceeds 13 times, a remarkably rare level of differentiation in a historical comparison of major global markets over the past decade.

First Half of 2026 Global Major Stock Market Performance Comparison
The core logic behind this exceptional difference:
The fluctuation of major market indices fundamentally depends on the weighting of the AI/semiconductor industry chain in that market. South Korea and Taiwan, the two markets with the most significant increases, are precisely the two economies with the highest concentration in the global semiconductor supply chain—Samsung Electronics and SK Hynix collectively accounted for 39% of KOSPI's total market value at the beginning of the year, rising to 61%, and TSMC alone represented 42.87% of the total market value of TAIEX. This implies that KOSPI and TAIEX are to a considerable extent no longer "diversified major market indices" in the traditional sense but rather closer to a "proxy index of the semiconductor industry chain." In contrast, due to broader coverage of constituent stocks (encompassing a large number of traditional industries such as finance, consumer goods, healthcare, and energy unrelated to AI), the excess returns of AI hardware in the S&P 500 and CSI 300 were significantly diluted by other sectors of the index, resulting in a more moderate performance in terms of increases.To better illustrate the AI market situation, we have selected representative stocks from some key sectors within AI, using a free float market cap-weighted index (USD-denominated, base year = 100, starting from 2026) to analyze from both regional and sectoral perspectives. This method is consistent with the compilation logic of mainstream benchmark indices such as the S&P 500 and KOSPI 200, allowing for a more accurate reflection of "how much the market's money has increased as a whole," rather than being biased by the extreme performances of individual small-cap stocks or heavyweight stocks.
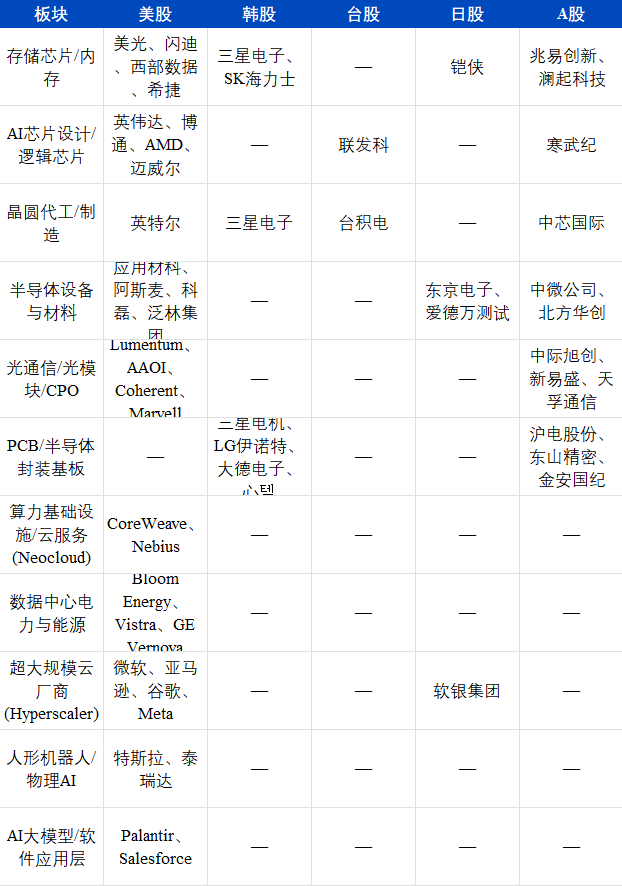
· Regional Representative Stock Mapping (Trading Volume Priority Principle)
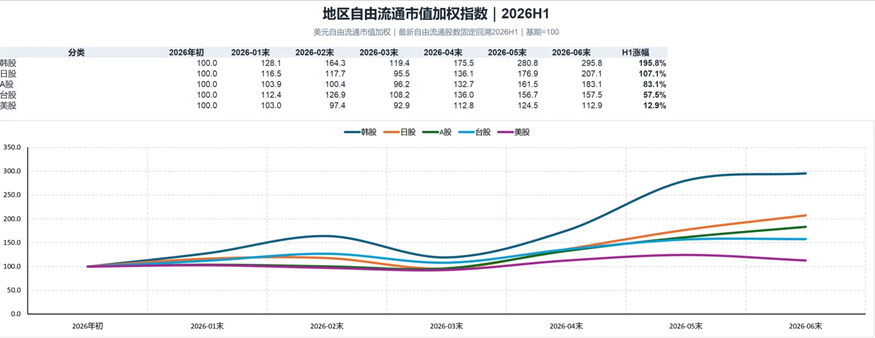
Regional Representative Stock Free-Float Market Capitalization Weighted Index in the First Half of 2026 (Base Year 2026 = 100)
In the first half of 2026, the world's top five stock markets calculated by the free-float market capitalization weighted index (USD-denominated, base year 2026 = 100) showed a clear tiered differentiation: Korean Stock Exchange +195.8%, Japanese Stock Exchange +107.1%, A-share Stock Exchange +83.1%, Taiwan Stock Exchange +57.5%, US Stock Exchange +12.9% — the difference between the highest and lowest being more than 15 times.
From the monthly trend perspective, all five markets from the end of February to the end of March experienced an almost synchronous collective pullback (Korean Stock Exchange dropped from 164.3 to 119.4, Japanese Stock Exchange dropped from 117.7 to 95.5, A-share and Taiwan Stock Exchanges similarly weakened, while the US Stock Exchange remained nearly flat), and then all entered a new uptrend channel starting in April. The time window of this synchronous pullback highly coincided with macro disturbances — the end-of-quarter escalation of geopolitical conflicts and increased divergence in the Federal Reserve's policy path, indicating that even the AI, the world's strongest theme, was not completely immune to the synchronous impact of macro risks.
Entering the second quarter, the five markets began to significantly diverge: Korean Stock Exchange surged all the way from 175.5 at the end of April to 295.8 at the end of June, showing the steepest and most sustained upward trend; Japanese Stock Exchange, A-share Stock Exchange, and Taiwan Stock Exchange showed relatively moderate and steady climbs; while the US Stock Exchange followed a completely different trajectory from the other four markets — after peaking at 124.5 at the end of May, it fell back to 112.9 at the end of June, being the only market among the five to experience a significant retreat in the closing stages of H1. The "madness" in the US Stock Exchange's AI sector was more reflected in the extreme performance of individual hardware segments such as storage and PCB, rather than a broad market rally. NVIDIA, Broadcom, and other representative AI leading stocks actually underperformed the broader market in the first half, directly suppressing the overall performance of the US Stock Exchange.
· Sector Representative Stock Mapping (Trading Volume Priority Principle)
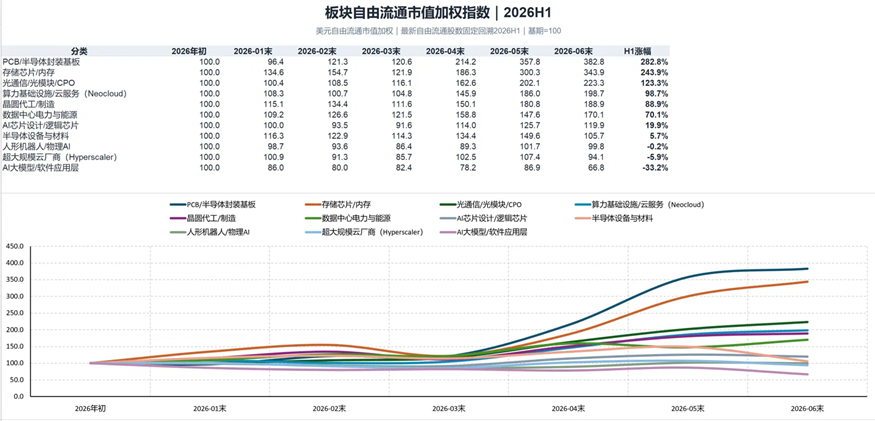
AI-related Sector Free-Float Market Capitalization Weighted Index in the First Half of 2026 (Base Year 2026 = 100)
Breaking free from regional boundaries and redividing by industrial chain links, the performance of the eleven sectors' H1 table presents a more distinct hierarchical structure: PCB/Semiconductor Packaging Substrate (+282.8%) and Memory/Storage Chips (+243.9%) are undoubtedly the most dominant forces, with a particularly steep surge in the second quarter; Optical Communication/Optical Module/CPO (+123.3%), Computing Power Infrastructure/Cloud Services (+98.7%), Wafer Foundry/Manufacturing (+88.9%), Data Center Power and Energy (+70.1%) form the middle echelon; while AI Chip Design/Logic Chip (+19.9%) and Semiconductor Equipment/Materials (+5.7%), the two sectors usually considered the "core of AI," saw significantly lower growth rates compared to the upstream bottleneck segments.
Of particular note are the top three sectors—Humanoid Robot/Physical AI (-0.2%), Hyperscale Cloud Providers (-5.9%), AI Large Model/Software Application Layer (-33.2%), the only three categories in H1 that collectively experienced negative growth, with the software application layer seeing the deepest decline. From a monthly trend perspective, the common feature of these three sectors is that they have all oscillated narrowly around the 100 baseline or even continued to decline, never truly participating in this round of uptrend—even though the hyperscale cloud providers are the absolute contributors to this round of AI capital expenditure (Microsoft, Amazon, Google, Meta), and humanoid robots are the most discussed cutting-edge topic in the market, neither of their stock prices have lived up to the narrative hype.
The core logic revealed by this "pyramid" structure is: the pricing power of this global AI market trend lies in the scarcity of the hardware supply chain, not in the contributors to capital expenditure or the ultimate application realization side—the hyperscale cloud providers who spend the most money, the software application layer and robotics track with the most enthusiastic narratives, are instead the three categories with the weakest stock performance in H1; the real beneficiaries of the surge are in the seemingly inconspicuous but short-term production-constrained midstream and upstream sections such as storage and packaging substrates.
Super IPO Shockwave: Capital Flight and Profitability Question
The most profound event of this quarter for the AI sector and even the entire capital market is the near-simultaneous launch of super IPO processes by the three giants SpaceX, OpenAI, and Anthropic. The combined target valuation of these three companies is approximately $3.6 trillion to $3.8 trillion, equivalent to the total GDP of the sixth-largest economy in the world, India, making it the largest-ever concentrated listing wave of tech companies in capital market history.
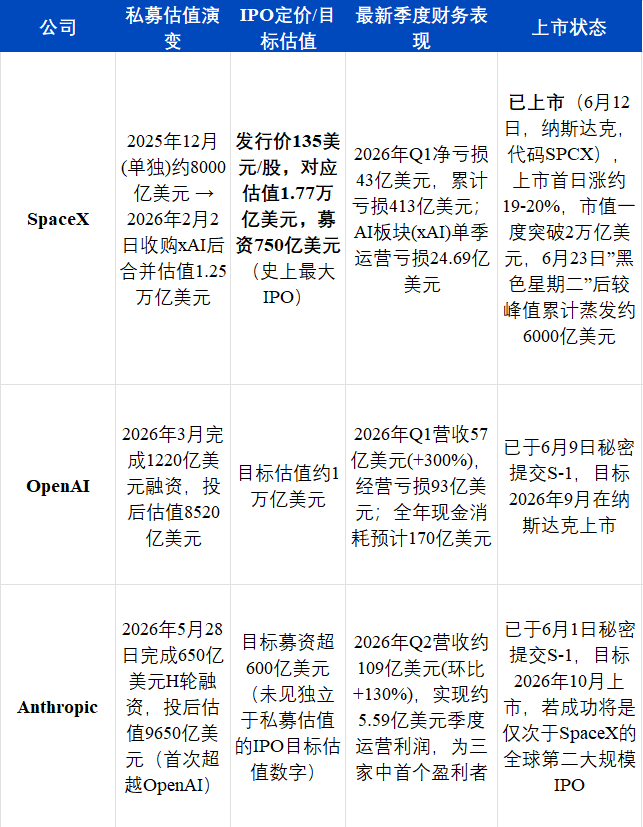
· The Significant Scale of Funds Drawn from the Market
Three companies have a combined target fundraising amount of over $200 billion, while the entire U.S. IPO market raised only $450 billion in the entire year of 2025. This means that the three companies are attempting to draw from the public market an amount of funds equivalent to over four times the total U.S. IPO volume from last year in just a few months.
Although some analysis suggests that there is approximately $8 trillion in existing funds available for investment in the U.S. money market (SpaceX's $75 billion fundraising target accounts for only about 1% of this), and institutional funds have previously obtained AI exposure more indirectly through "proxy targets" such as Nvidia, Microsoft, and Google, the listing of pure AI assets is expected to unleash incremental demand. However, the rebalancing effect of funds is also something to be wary of—when hundreds of billions of dollars flow into new stocks, institutional investment portfolios will inevitably undergo rebalancing, with funds likely passively flowing out of existing "Tech Magnificent Seven" heavily weighted stocks. Even investors who have never participated in IPO subscriptions may feel the headwinds of this "bloodletting" effect on their own positions.
· The Imminent Public Market Examination of Massive Loss Issues
All three companies are currently heavily reliant on primary market financing for their cost structures, which are largely in a deeply loss-making state:
1. OpenAI is the most fragile link among the three: With a first-quarter 2026 revenue of $5.7 billion, a 300% year-on-year surge, but an operating loss of $9.3 billion—equivalent to losing about $1.60 for every $1 earned. HSBC predicts that its full-year cash burn in 2026 will reach $17 billion, with a daily cash burn exceeding $46 million. More critically, Deutsche Bank estimates that OpenAI's cumulative negative free cash flow from 2024 to 2029 could reach $143 billion, and it may not turn profitable until as early as 2029.
2. SpaceX's AI Division is also a major cash burner: Although the Starlink business has achieved stable profitability, the artificial intelligence segment, post-xAI merger, had a first-quarter 2026 revenue of $818 million but an operating loss of $2.469 billion, with an adjusted EBITDA of -$609 million. The company as a whole incurred a loss of $4.94 billion in 2025, a net loss of $4.3 billion in the first quarter of 2026, and accumulated losses totaling $41.3 billion.
3. Anthropic is Currently the Only Exception: The company expects to achieve approximately $5.59 billion in quarterly operating profit in the second quarter of 2026, becoming the first of the three enterprises to profit from an advanced AI lab. However, its latest round of funding reached a valuation of $965 billion. Based on the most optimistic annualized revenue estimate, its price-to-sales ratio still exceeds 24 times, higher than NVIDIA's historical peak of 28 times price-to-sales ratio corresponding to a reasonable upper limit. The valuation itself has already priced in quite optimistic growth expectations.
IPO prospectuses typically require disclosure of far more detailed and truthful financial data than the private placement stage, which means that the previously high valuations based on "stories" and non-public data will soon face the scrutiny of public market investors for the first time. Particularly with OpenAI, its registration statement will publicly disclose real revenue and profit margin data for the first time. If the disclosed profit margin is significantly lower than investors' expectations based on previous private placement rounds, its target valuation may face significant downward pressure, potentially triggering a cascading markdown among venture capital firms holding a large amount of related company equity. This impact could also transmit to the secondary market through "proxy stocks" such as Microsoft (holding approximately 27% of OpenAI shares) and SoftBank.
· Potential Impact on Market Sentiment and AI Stock Performance
Looking at the recent performance of AI-related companies that have already gone public, the vulnerability of this "asset-heavy, high-burn" model has begun to show. Taking the AI computing infrastructure company CoreWeave as an example, its first-quarter 2026 free cash flow was -$4.71 billion, with a single-quarter capital expenditure as high as $7.7 billion, and interest expenses doubling year-over-year. The total debt has surged from $2 billion in 2023 to $35 billion. Even with a 111.7% year-over-year revenue growth in the quarter, it could not dispel market doubts about the sustainability of its "burn for growth" strategy. Coupled with short reports and news of executive sell-offs, the stock price at one point fell more than 40% from its 52-week high. The "Black Tuesday" in late June particularly highlighted this vulnerability—market concerns about whether investments in AI infrastructure can generate sustainable cash returns, combined with SpaceX's large-scale bond financing before going public, collectively triggered a synchronized pullback in global AI trading.
The development of AI's large models continues to iterate and grow rapidly, with domestic companies closely following suit in innovation at a technological level. However, at the financial level, the market has shifted its focus from the earliest and most prominent AI trading theme of "AI chip leaders + software applications + cloud providers" to the relatively newer theme of "storage/PCB-like AI hardware supply chain bottlenecks." The largest patrons of AI capital expenditure—mega-scale cloud providers (Microsoft/Amazon/Google/Meta)—who contribute the most money, have seen no increase in their stock prices, indicating market skepticism about whether "burning cash can lead to returns." The three major super IPOs are targeting a total fundraising of over $200 billion, and the issue of massive losses is about to be directly tested in the public market. The stock market's AI sector is transitioning from a high-growth period to an uncertain and pressured phase. This also means that the stock market's AI sector no longer has such a direct impact and attraction to the crypto market. This signal of reduced correlation is also observed in the analysis of the RWA market.
RWA Emerges as the Primary Growth Driver in the Crypto Market
Real World Asset (RWA) Tokenization has become the most prominent and fastest-growing track in the crypto market this quarter, serving as the most direct bridge between traditional finance and the crypto world. This section revolves around three main themes: the current scale and growth status of the overall RWA market; policy changes and background of the RWA market; the fastest-growing segment within the market—tokenized stocks' pattern classification; and using Binance as the primary sample to observe the data growth of RWA-related product lines.
Current State of the RWA Market
2026 marked the year when RWA transitioned from "concept validation" to "institutional infrastructure." According to RWA.xyz's statistics, the total on-chain RWA scale, excluding stablecoins, has rapidly increased from around $2.8 billion in early 2025 to over $33 billion by mid-2026, growing more than 11-fold in 18 months. This growth far surpasses the overall DeFi market performance during the same period—while DeFi's total value locked (TVL) decreased from around $115 billion in early 2025 to $70 billion by mid-2026. RWA is one of the few asset categories in the entire crypto market that experienced net inflows during the bear market, showing a clear structural shift of market funds from speculative protocols to institutional-grade on-chain infrastructure.
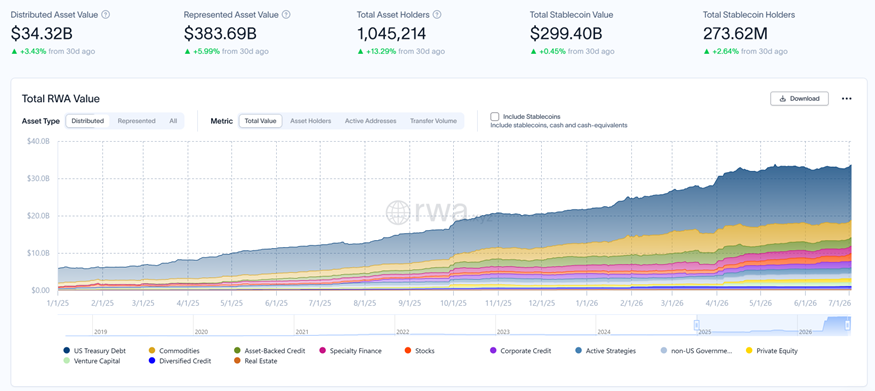
Changes in the on-chain RWA market size in the first half of 2026 (rwa.xyz)
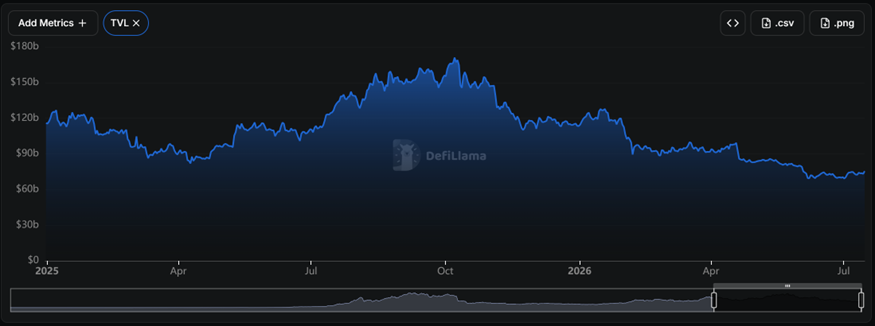
Changes in DeFi TVL size in the first half of 2026 (DefiLlama)
Asset Breakdown in RWA
• U.S. Treasury Bonds: Always the absolute mainstay, holding the largest share of the RWA market value, this is the most mature, "boring" yet stable part of the RWA market. The attractiveness of Treasury bond tokenization products is built on the logic that as long as the federal funds rate remains above 3%, "putting idle stablecoins into tokenized Treasury bonds to earn 3.5%-4.5% APY" continues to be valid. This is also why tokenized Treasury bonds can maintain a solid "ballast" position in the entire RWA market—it fundamentally capitalizes on the Federal Reserve's high-rate cycle dividend.
• Commodities: The second-largest category, mainly focused on gold tokenization, directly influenced by the price of gold.
• Asset-Backed Lending: Medium scale, with a significant increase in institutional participation in the last two years.
• Equities: Although the proportion may seem small at first glance, it was the fastest-growing category this quarter.
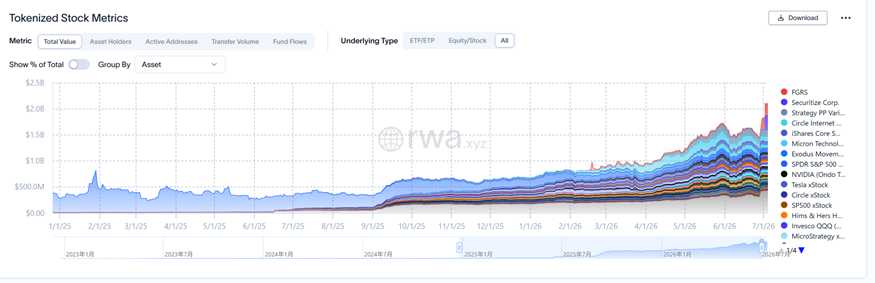
2026 H1 On-Chain RWA Equities Market Size Movement (rwa.xyz)
According to RWA.xyz, tokenized equities went from $291M in 2025 to $1.816B in mid-2026. Due to statistical and data collection framework limitations, this data does not fully cover the entire tokenized equities market. Further data analysis from other perspectives will be provided in the subsequent sections of this article.
In the first half of 2026, the on-chain RWA market size expanded from approximately $21.6 billion at the beginning of the year to $33 billion, with the number of holding addresses growing at a pace far exceeding the asset's value. These data points outline a market that is transitioning rapidly from "proof of concept" to "institutional infrastructure." However, the scale figure alone answers the "what happened" question but not the "why it happened at this time" question. In fact, this expansion is not an isolated market-driven event but is highly synchronized with a significant global regulatory environment relaxation during the same period—from the U.S. SEC's stance on tokenized securities, FINRA's issuance of the first custody license to Securitize, to the GENIUS Act, Hong Kong's Stablecoin Regulation, EU MiCA, and Mainland China's Document No. 42 almost simultaneously landing. Behind each surge in the RWA market size, one can almost always find a corresponding policy loosening acting as a footnote. To understand why the RWA market expanded against the backdrop of an overall DeFi contraction in the past six months, one must shift the focus from the "market itself" to the "policy context." Behind this lies the synchronization of two regulatory tracks that are both independent and mutually supportive: one governing whether "assets" can legally trade on-chain (securities regulation track) and the other governing what kind of "money" can be used for settlement in on-chain transactions (stablecoin regulation track).
RWA Macro Policy Background: Global Stablecoin Regulation "Three Kingdoms" Drama, Concentrated Landing in H1 2026
In regulation, RWA is split between the stablecoin regulation track and the securities regulation track, with the stablecoin regulation track as follows:
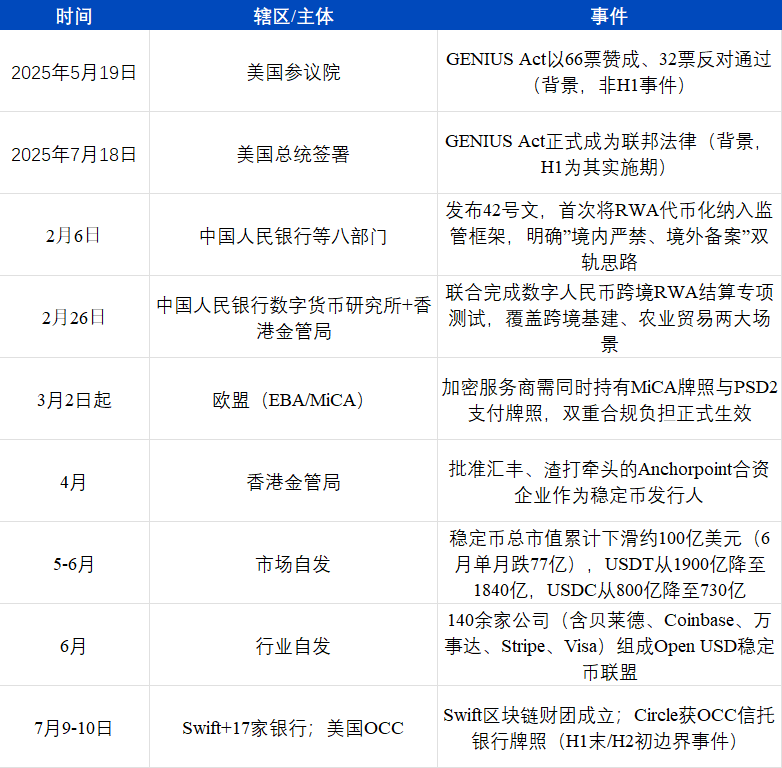
The key legislation for stablecoins, the GENIUS Act, was actually completed in 2025, and the first half of 2026 was more of an implementation phase and a period of global chain reaction: Benchmarking against the GENIUS Act, Hong Kong SAR, the European Union, and Mainland China almost concurrently launched or strengthened their respective stablecoin regulatory frameworks from the end of the first quarter to the beginning of the second quarter of 2026, forming a de facto "regulatory tripartite" — the United States followed the federal framework + OCC licensing route, Hong Kong SAR followed the HKMA centralized licensing system, the EU followed the MiCA+PSD2 dual licensing route, and Mainland China strictly implemented a "single standard for domestic and a separate channel for overseas." This synchronized global regulatory tightening did bring about short-term pressure — in May and June, the stablecoin market saw its most significant retreat since 2023 (approximately $10 billion, 3%), mainly led by the two giants, USDT and USDC, contracting simultaneously. The market interpreted this as some funds choosing to adopt a wait-and-see approach during a window where regulatory compliance costs were rising. However, the extent of the contraction was far less than the bear market-like run on stablecoins in 2022 (which contracted by over 26%), indicating that this time was more like "institutional birth pangs" rather than a crisis of trust. What is more noteworthy is the institutional action that occurred concurrently with the contraction — over 140 traditional giants jointly launched the Open USD Alliance, Swift formed a blockchain consortium with 17 banks, and Circle obtained an OCC trust charter — all of which happened during the same time window of stablecoin scale-down. This indicates that the regulatory tightening has squeezed out speculative funds in the short term but has also accelerated traditional financial institutions' formal entry in a more compliant manner. This aligns with the logic of FINRA granting Securitize a license on the "RWA Securitization" track: two tracks with different paths converging, both moving the industry from the "grey area" toward "licensed operation."
The track of securities regulation is as follows:
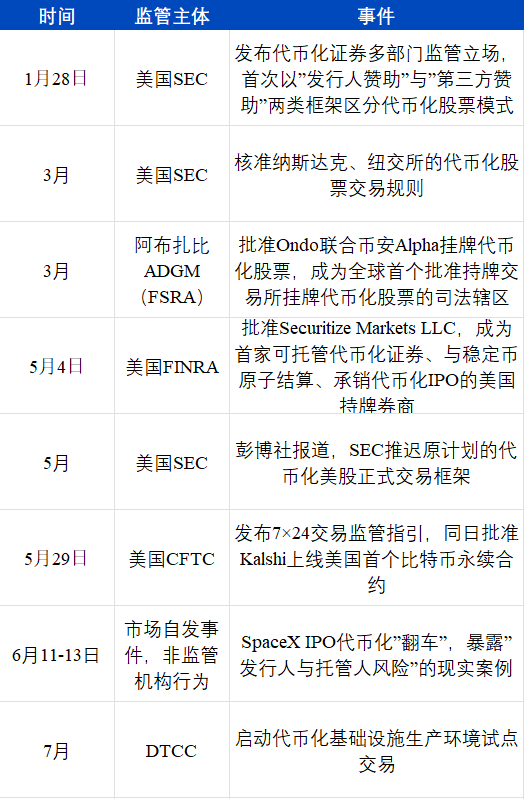
Regarding securities regulation, it needs to stipulate whether traditional securities such as stocks and fund shares can be legally tokenized, who is eligible for custody, and where they can be compliantly listed for trading. The entire timeline presents a rhythm of "advance two steps, retreat half a step": The SEC's stance statement in January opened the door, the rule approvals of two major trading platforms and ADGM's leapfrog landing in March further confirmed the direction, and on May 4th, FINRA officially granted a license to Securitize, marking the highest-level substantive endorsement from a regulatory perspective this quarter — no longer just a "gesture," but an actual U.S. licensed institution has obtained the qualification to custody tokenized securities. However, in May of the same year, the SEC postponed the formal trading framework for tokenized U.S. stocks on a larger scale, indicating that regulatory agencies are still cautious about the extent of openness and not blindly advancing optimistically. The CFTC's action on May 29th represents another path — the traditional regulated derivatives market actively embracing 24/7 trading and crypto assets (Kalshi obtaining Bitcoin perpetual contract qualification), which is in contrast to the "cryptocurrency exchange selling stocks" fusion. Although the SpaceX event in June was not initiated by regulatory agencies, it most directly exposed the structural weaknesses of the current tokenized stock model — regulatory clarity provided a "path," but it does not mean that the underlying asset supply and custody chain have already withstood pressure tests. This is also why the DTCC chose to officially launch its pilot in July rather than hastily starting in January when the regulatory stance was just clarified: Traditional financial institutions have a significantly more conservative requirement for infrastructure maturity compared to cryptocurrency exchanges.
However, the entire RWA's path became increasingly clear during this process. This has provided good policy support for the subsequent development of tokenized equities.
Core Increment in the RWA Market: Tokenized Equities
Due to the hot stock market in the past two years and the slump in the crypto market, RWAs have become the sought-after source of innovation for Crypto trading platforms. Tokenized equities are undoubtedly the "core increment" of 2026—although their stock size still accounts for the smallest proportion in the entire RWA market (about 2.5%), they have the fastest annual growth rate and the most intense influx of new players in the space. As mentioned earlier, the data on rwa.xyz only shows one of the solutions for tokenized equities. Strictly speaking, it can be divided into at least four different rights structures, each with completely different risk attributes. Investors cannot judge their attributes based solely on the product name:
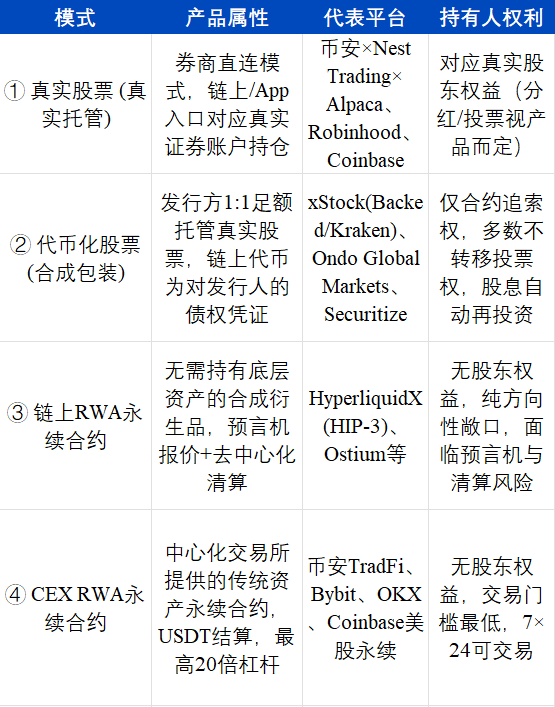
· Real Stocks: Trading platforms rely on brokerage infrastructure like Alpaca for actual holdings
This is a model that closely resembles the traditional securities account experience—trading platforms do not issue tokens themselves but, through licensed brokerage channels, allow users to directly purchase and hold actual stocks. The blockchain/app is only the trading interface. Binance is the latest example of this model: In June 2026, it added an independent traditional US stock business, with trading execution handled by the Abu Dhabi-licensed brokerage Nest Trading, and Alpaca responsible for stock custody and dividend processing. In its first month online, it covered over 7,000 US stocks and ETFs, with spot trading volume exceeding $1 billion within 30 days. On the day SpaceX went public, platforms like Backpack Securities and Sunrise DeFi introduced SPCX tokens using the same model—each token corresponds one-to-one with actual SpaceX stock held at a US brokerage.
· Tokenized Equities: Synthetic Packaging Models like xStock/Ondo/Securitize
This was the earliest solution for tokenized equities, and it is currently the largest and most densely populated model. The key feature is that the issuer fully collateralizes the issuance with actual stocks at a 1:1 ratio and issues tokens representing the debt instrument on-chain:
1. xStock (Backed Finance/Kraken): Launched in June 2025, issued by Swiss-regulated asset issuer Backed Assets (JE) Limited, all products are fully backed by actual stocks. Within 8 months of launch, the total market trading volume exceeded $25 billion, making it the largest tokenized equities platform by volume, covering over 60 stocks and ETFs, with Tesla accounting for over a quarter of its custodied market value.
2. Ondo Finance (Global Markets): Launched in September 2025, covering over 260 US stocks and ETFs (including SPY, QQQ, NVDA, TSLA, etc.). On May 11, 2026, the Total Value Locked (TVL) surpassed $1 billion, making it the first tokenized stock platform to achieve this milestone, capturing over 70% market share in the space, with a total trading volume of approximately $18 billion. In June 2026, it further introduced a product targeting US compliant users, incorporating IVV, Micron, and others into a more regulatory-friendly access mode.
3. Securitize: The largest tokenization platform by market cap (around $3.5 billion), notable for representing BlackRock's BUIDL Fund. Unlike xStock and Ondo's "wrapping of third-party stocks," Securitize directly tokenizes its newly listed common stocks on-chain. In July 2026, its tokenized holdings briefly topped the chart for all tokenized stocks at $270.6 million, with a monthly on-chain transfer volume of $8.47 billion (a MoM increase of +92.77%).
· On-chain RWA Perpetual Contracts: Permissionless Synthetic Derivatives
Represented by HyperliquidX's HIP-3 mechanism, this is a fully permissionless synthetic derivatives market where any asset (commodities, stocks, etc.) can have a corresponding perpetual contract market within hours as long as there is a reliable oracle pricing. Unlike the "issuer and custodian risk" faced by xStock and Ondo, on-chain RWA perpetual contracts face "oracle and liquidation risks"—price information must be accurate, and margins must be sufficient, otherwise the position will be liquidated permanently. trade.xyz is currently the biggest player in this field.
· CEX RWA Perpetual Contracts: Traditional Asset Perpetual Contracts on Centralized Exchanges
This is the fastest-growing of the four models currently, and the most important new variable this quarter—centralized exchanges directly provide perpetual contracts tracking traditional asset prices such as stocks, commodities, and forex, settled in USDT, offering up to 20x leverage and 24/7 trading. According to CoinDesk Research, since 2026, the total RWA-related trading volume processed by crypto exchanges has nearly reached $1 trillion, with about 60.9% coming from Binance alone. The overall trading volume of RWA perpetual contracts has surged from $12.37 billion in Q4 2025 to $203 billion in Q2 2026, a 20x QoQ increase, primarily driven by commodity trading on Binance, Hyperliquid, and Pyth Network. This model will be further detailed in conjunction with Binance's specific product line.
Among the current four modes of stock tokenization, the volume of RWA perpetual contracts far exceeds the other three categories.
Seven RWA Product Lines in the Binance Ecosystem
To understand the true scale of RWA-related products in the overall business of a crypto trading platform, the most direct way is to place them in the product matrix of the same exchange for magnitude comparison. Binance is currently the most aggressive in RWA/TradFi deployment, with relatively full data disclosure among trading platforms. It is also the cryptocurrency trading platform with the deepest liquidity globally. Therefore, using Binance as a sample for a single-framework comparison is quite representative.
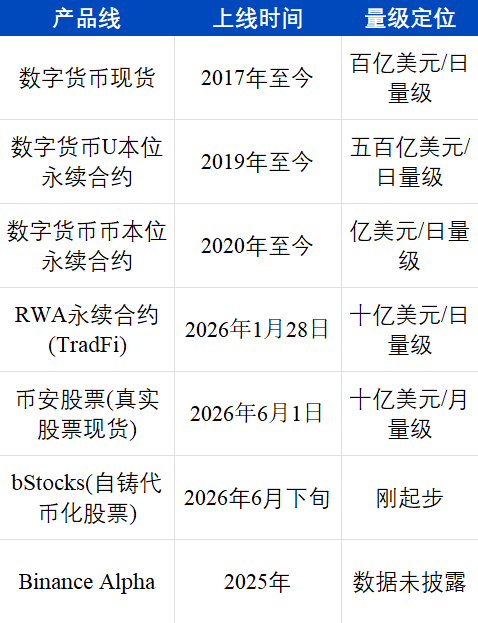
Even though RWA perpetual contracts (TradFi) have experienced explosive growth from zero to an average monthly volume in the hundreds of billions of dollars over the past six months, their absolute scale is still one to two orders of magnitude lower compared to Binance's crypto-native business (spot, USDT-margined/coin-margined perpetual contracts). The monthly trading volume of Binance's cryptocurrency USDT-margined perpetual contracts has consistently remained at the level of hundreds of billions to trillions of U.S. dollars, which is 4-5 times higher than the peak of TradFi perpetual contracts. The two newest product lines, "Real Stock Spot" and "bStocks," currently have a volume even one to two orders of magnitude smaller than RWA perpetual contracts, still in the early stages of business incubation.
However, the comparison of growth rates tells a completely different story. Binance's TradFi perpetual contracts were launched on January 28, 2026, with a trading volume of only a few hundred million dollars in the first week. Within two months, the cumulative trading volume exceeded $153 billion, and the market share in the first quarter reached 62.7%. By May, the weekly trading volume once reached $603 billion, accounting for 10.3% of the platform's total perpetual contract trading volume. By June, Binance had captured an 80% share of the CEX stock perpetual contract market, with the weekly trading volume of CEX stock derivatives in that month setting a historical record of $116 billion. In parallel, there was an explosion of Pre-IPO perpetual contracts—SpaceX Pre-IPO contracts captured a 65% market share within a week of launch, with a cumulative trading volume of $4 billion; OpenAI Pre-IPO contracts went live and 85% of the total market trading volume occurred on Binance within two days. A business line that was nonexistent six months ago now accounts for one-tenth of the platform's overall perpetual contract trading volume. This speed of growth is unprecedented in the incubation history of any traditional financial institution's products.
To visually demonstrate the data increment of RWA Perpetuals, we compare the data of the largest CEX and DEX in the crypto industry (alpha and bstock/stock currently do not have API exports).
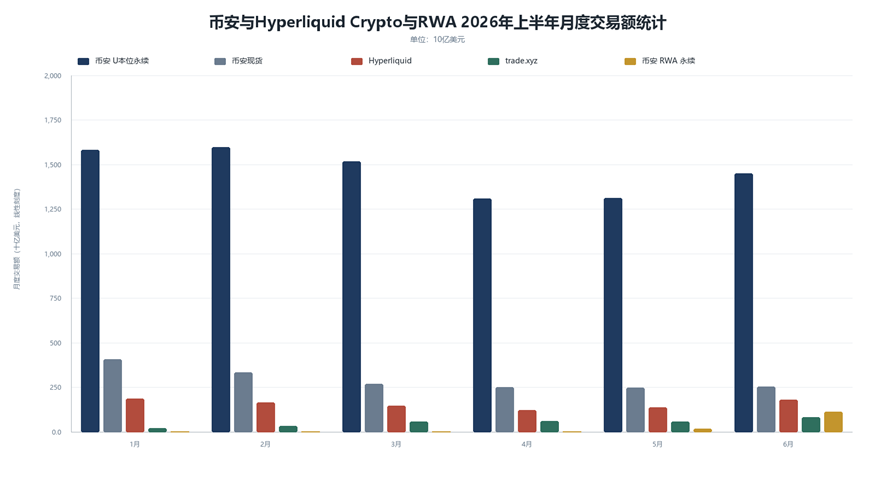
Binance and Hyperliquid's Crypto and RWA H1 2026 Monthly Trading Volume Statistics (Binance and Hyperliquid API)
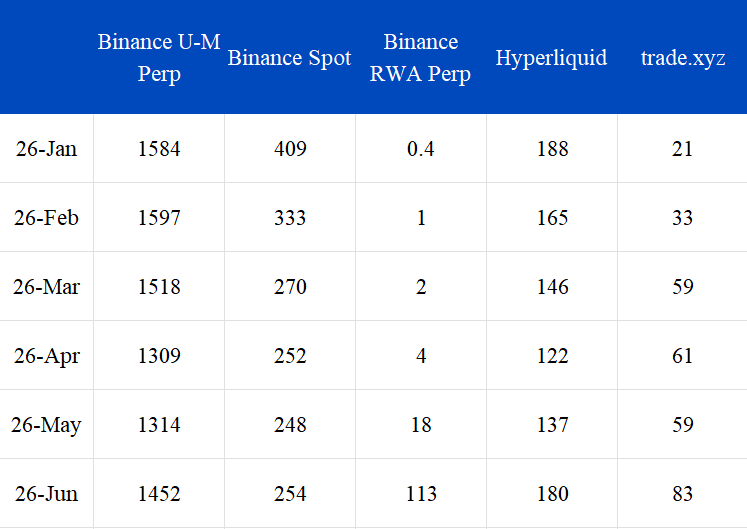
Binance and Hyperliquid's Crypto and RWA H1 2026 Monthly Trading Volume Statistics Data
From the above intuitive comparison, we have drawn the following conclusions:
1. The impact of the U.S. stock market on Crypto spot trading is the most significant, with a staggering 40% decline in May compared to January.
2. Crypto U perpetual contract trading, relative to spot trading, experienced a smaller impact from the U.S. stock market, with a year-on-year drop of 18%. This phenomenon signifies the increasing gamification of Crypto among existing players.
3. Both RWA DEX represented by trade.xyz and RWA CEX represented by Binance demonstrated substantial growth in RWA perpetual contract trading volume. trade.xyz saw a remarkable 4x growth in the first half of this year, while Binance exhibited exponential growth leveraging its user base advantage, with current trading volume surpassing that of trade.xyz. Additionally, Binance's RWA data was generated with only 90 trading pairs, while in the same period, Binance had 588 U perpetual contract trading pairs in June.
4. The peak impact on Crypto has passed, and from the data, it is evident that the Crypto market is now gradually recovering.
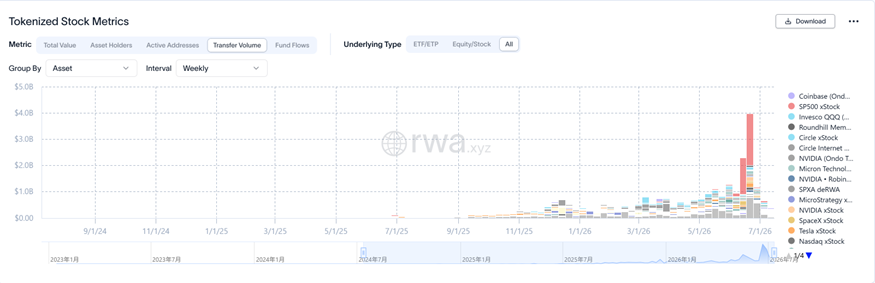
Tokenized Stock Weekly Transfer Volume (rwa.xyz)
Simultaneously, on-chain tokens also exhibit similar incremental data. Starting from $408 million at the beginning of 2026 to $3.982 billion in mid-June 2026. Combined with the data from the chart above, we boldly propose a hypothesis. Throughout 2026, the Crypto market has been continuously impacted by the U.S. stock market, whether in terms of the underlying asset's value and market compliance, or the speculative nature and price surge. Tokens have been left behind by the AI concept stocks. However, this impact reached its peak in the data of June 2026. We believe that if the Crypto market itself does not face new bearish factors, in terms of the impact of the U.S. stock market, this could be a bottoming-out period.
Our Prediction for Tokenized Stocks:
1. For tokenized stocks, our prediction is that due to the lack of a first-mover advantage, older solutions like xStock and Ondo may be squeezed out by Binance's bstock in subsequent competition. Additionally, due to liquidity issues, tokenized stocks may develop at a slower pace compared to other solutions.
2. For real stock solutions, they are expected to gradually replace tokenized stock solutions due to their first-mover advantage, maintaining steady growth.
3. Regarding RWA Perp solutions, whether on a CEX or DEX, trading platforms will not give up on the most promising opportunity and will continue to invest resources. At the current growth rate, it should quickly catch up to the market size of crypto perps.
Summary
In the first half of 2026, the state of the crypto market can be summarized as: multiple external shocks and internal shifting focus.
From a macro perspective, the change in leadership at the Federal Reserve has not only led to a shift from a rate-cutting to a rate-hiking stance but also a restructuring of the policy communication framework, significantly reducing the predictability of the interest rate path. The conflict between the U.S. and Iran and the closure of the Strait of Hormuz have created a supply shock-induced inflation that cannot be resolved by rate hikes, yet it also pressures the Federal Reserve from turning dovish. The combination of these factors has led to extreme volatility in the pricing environment for crypto assets throughout the first half of the year.
On the AI front, technological advancements continue at a rapid pace, but the funding narrative has shifted from "AI chip leaders + software applications + cloud providers" to "storage/PCB and other hardware supply chain bottlenecks." The share prices of the biggest cloud providers, despite the most significant spending, have not risen, leading the market to question whether "burning cash can yield returns." The cumulative fundraising of the three super IPOs exceeded $200 billion, and the enormous losses are about to face public market scrutiny. The AI market in stocks is transitioning from a high-growth period to a pressure period, indicating that the strongest moment of AI's impact on the crypto market may have already passed.
On the crypto front, RWA has been the only asset category to experience net inflows this quarter: on-chain RWA has expanded from $21.6 billion at the beginning of the year to $33 billion, while DeFi TVL has declined from $115 billion to $70 billion during the same period. Among the four tokenized stock models, RWA perpetual contracts have a much larger volume than the other three—Binance TradFi perps accounted for one-tenth of the platform's perpetual trading volume in just six months, and Hyperliquid's TradFi volume even represented half of the platform's volume. The crypto industry may not be retaining funds for "coins," but it is capturing funds for "traditional asset trading channels."
Our basic assessment is that, in terms of the impact of the US stock market on the crypto market, the data from June 2026 is likely the bottom; if the market itself does not generate new negative news, the recovery may already be slowly taking place.
Original Article Link
Welcome to join the official BlockBeats community:
Telegram Subscription Group: https://t.me/theblockbeats
Telegram Discussion Group: https://t.me/BlockBeats_App
Official Twitter Account: https://twitter.com/BlockBeatsAsia