Institutional Outflow and Spot Selling Pressure Persist, Is Bitcoin at 54% Potential Bottom?

Original Article Title: Waiting for Buyers
Original Source: Glassnode
Original Translation: AididiaoJP, Foresight News
Bitcoin broke below $60,000, with profit-taking, ETF outflows, and defensive options positioning continuing to weigh on market sentiment. Despite increasing signs of value realization and selective accumulation, broad-based demand has yet to materialize.
Summary
· Bitcoin is currently trading at $62,300, a 19% discount from the market's average price of $77,000. The short-term holder cost basis has dropped to $71,400, indicating new buyers accumulating below the cycle average for the first time, a constructive early step towards bottom formation. (Bitcoin has since dropped to $60,800 as of the time of writing.)
· The 90-day net Unrealized Profit/Loss (NUPL) moving average is at a daily -$205 million, confirming a loss-dominant environment with the focus tilted towards a realized price of $53,400 rather than the market average.
· Short-term holder heavy supply clusters are in the $66,800-$70,700 range, forming the most immediate overhead resistance. The short-term upside is limited until reclaiming this area and opening up the path to the short-term holder cost basis.
· ETF continued outflows: Institutional demand remains weak, with GBTC representing the largest share of recent redemptions.
· Coinbase buyer return: U.S. investors have shown buying activity, while Binance traders remain defensive.
· Spot market dominant selling: Selling pressure is originating from the spot market, with derivatives mainly following rather than driving.
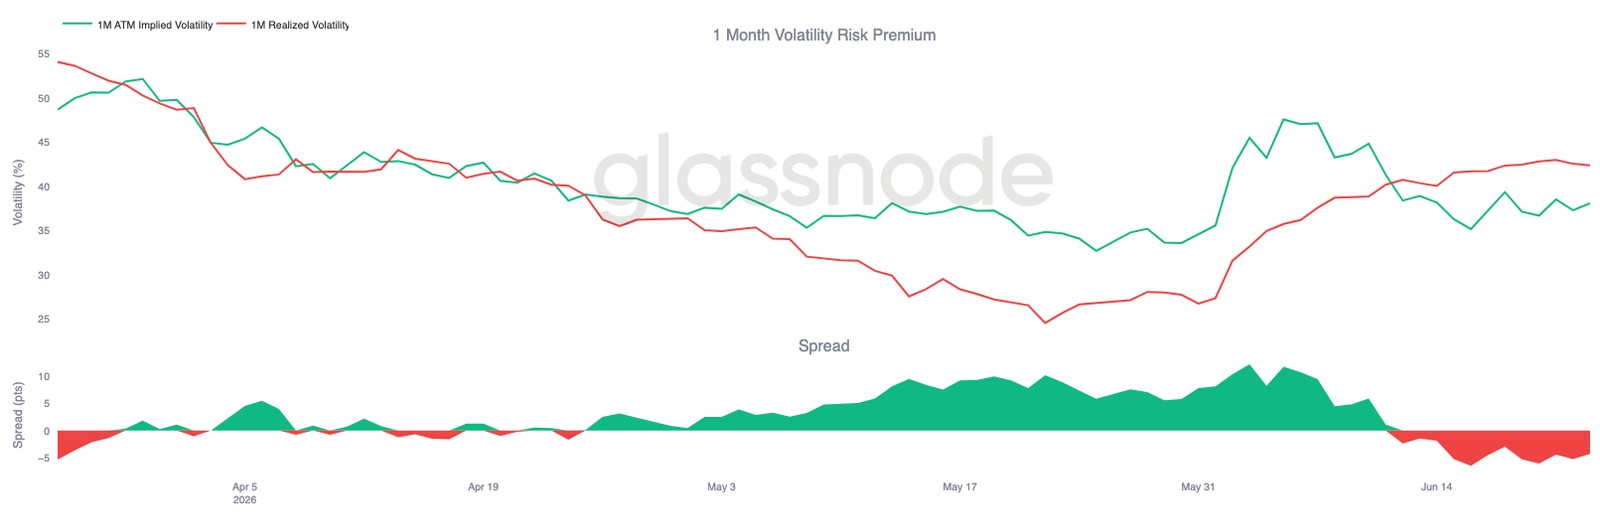
· Implied volatility remains stable near recent lows, while realized volatility remains elevated, with a negative volatility risk premium.
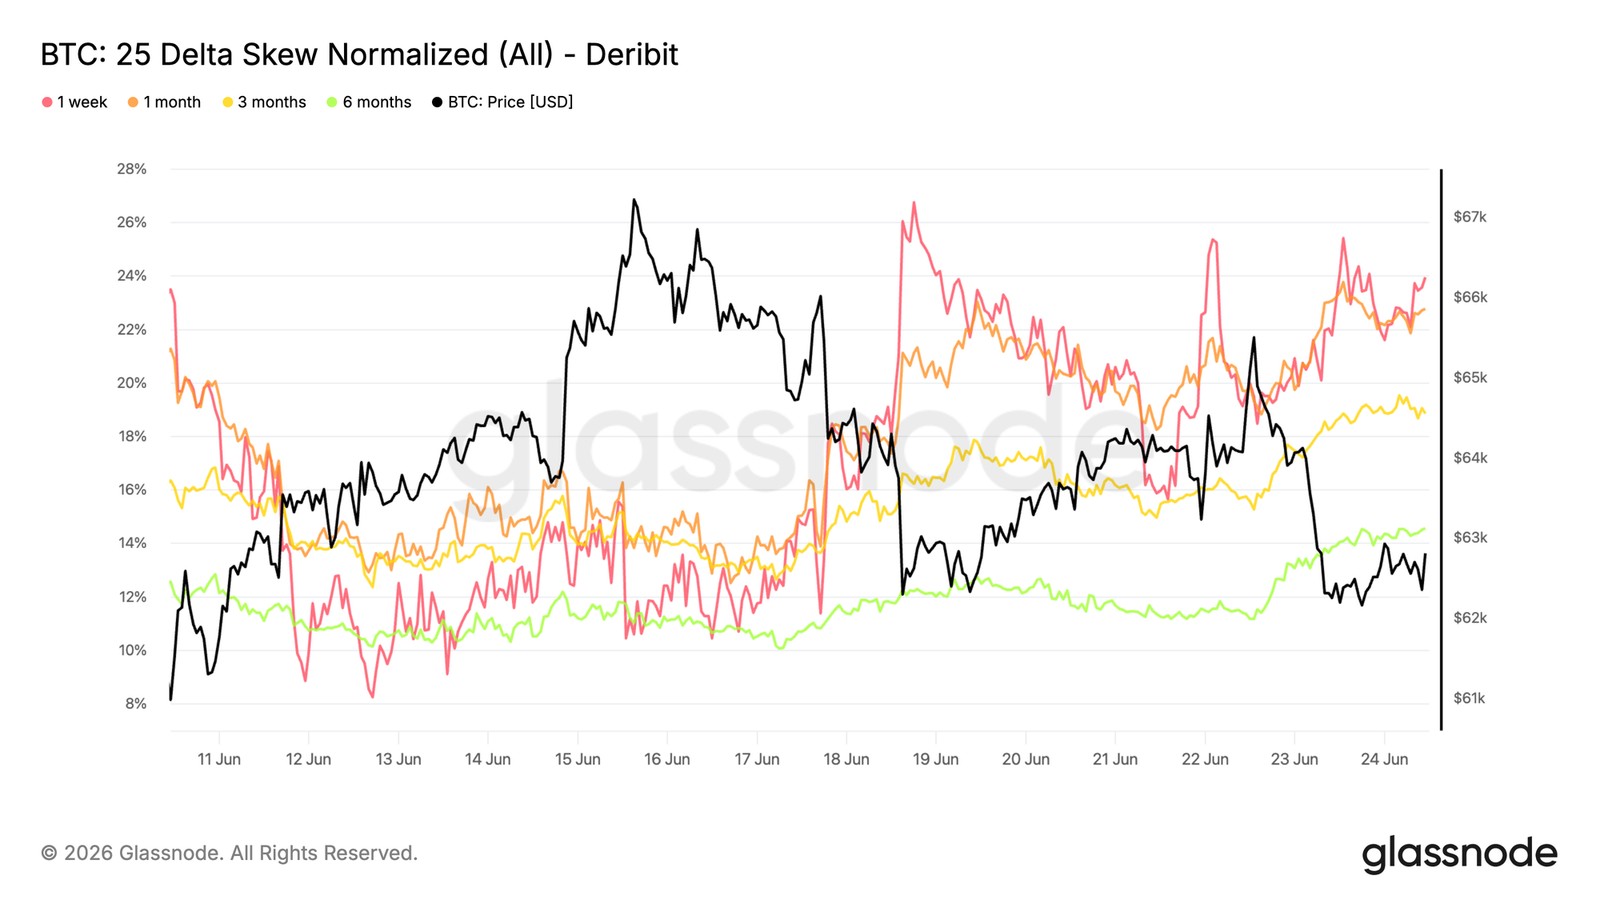
· Demand for downside protection has been rebuilt across all expirations, with skew significantly rising, despite overall volatility pricing remaining relatively restrained.
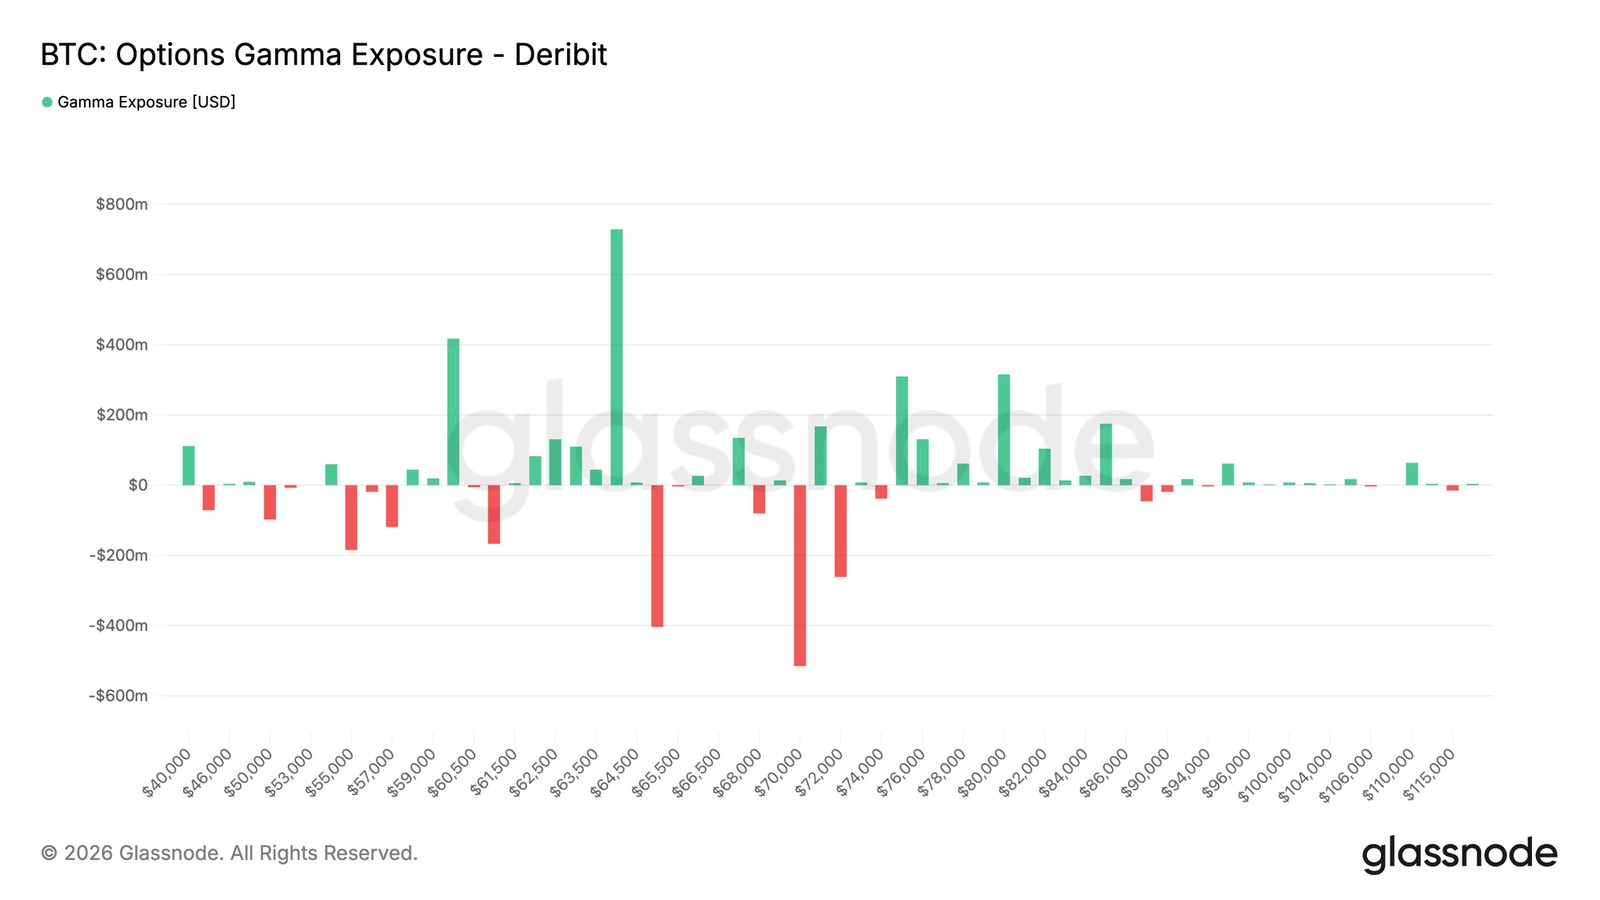
· Recent fund flows trending towards a sell-side premium, while market-maker positions still predominantly hold the 60K-64K range gamma, helping keep volatility in check near the current spot.
Macro Insights
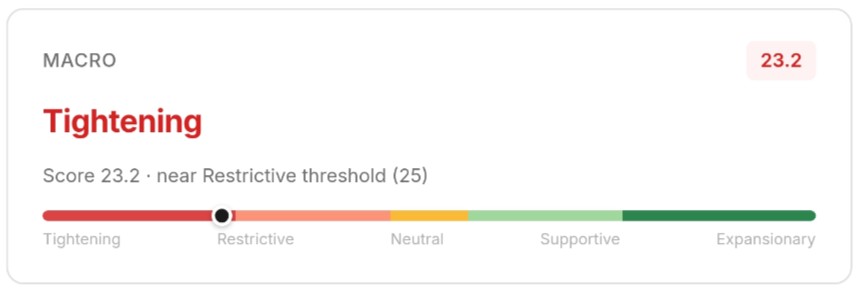
The U.S. Dollar Index has returned above the 200-day moving average. On June 23, the DXY reported 101.37, a significant rebound from 99.24 30 days ago, and for the first time since the April "Liberation Day" surge, it has stood above the 200-day moving average of 98.72. The bullish sequence has not materialized.
The 10-year U.S. Treasury yield remains at 4.50% with no sign of decline. The VIX increased from midweek's 16.2 to Friday's close at 19.49, indicating a directional change worth monitoring. The stock market has absorbed the spring pullback, with the S&P 500 Index at 7,365 points, up 14% from its April low, and holding above its 200-day moving average of 7,007 points.
Bitcoin did not participate in this recovery. Currently, BTC is trading at $62,651, 18% below its 200-day moving average of $76,466. The macroeconomic recovery remains the story of the stock market, supported by the resilience of U.S. corporate earnings. For Bitcoin, the resurgent strength of the DXY is a leading indicator that is not favorable for BTC.
On-Chain Insights
Deep Discount Zone
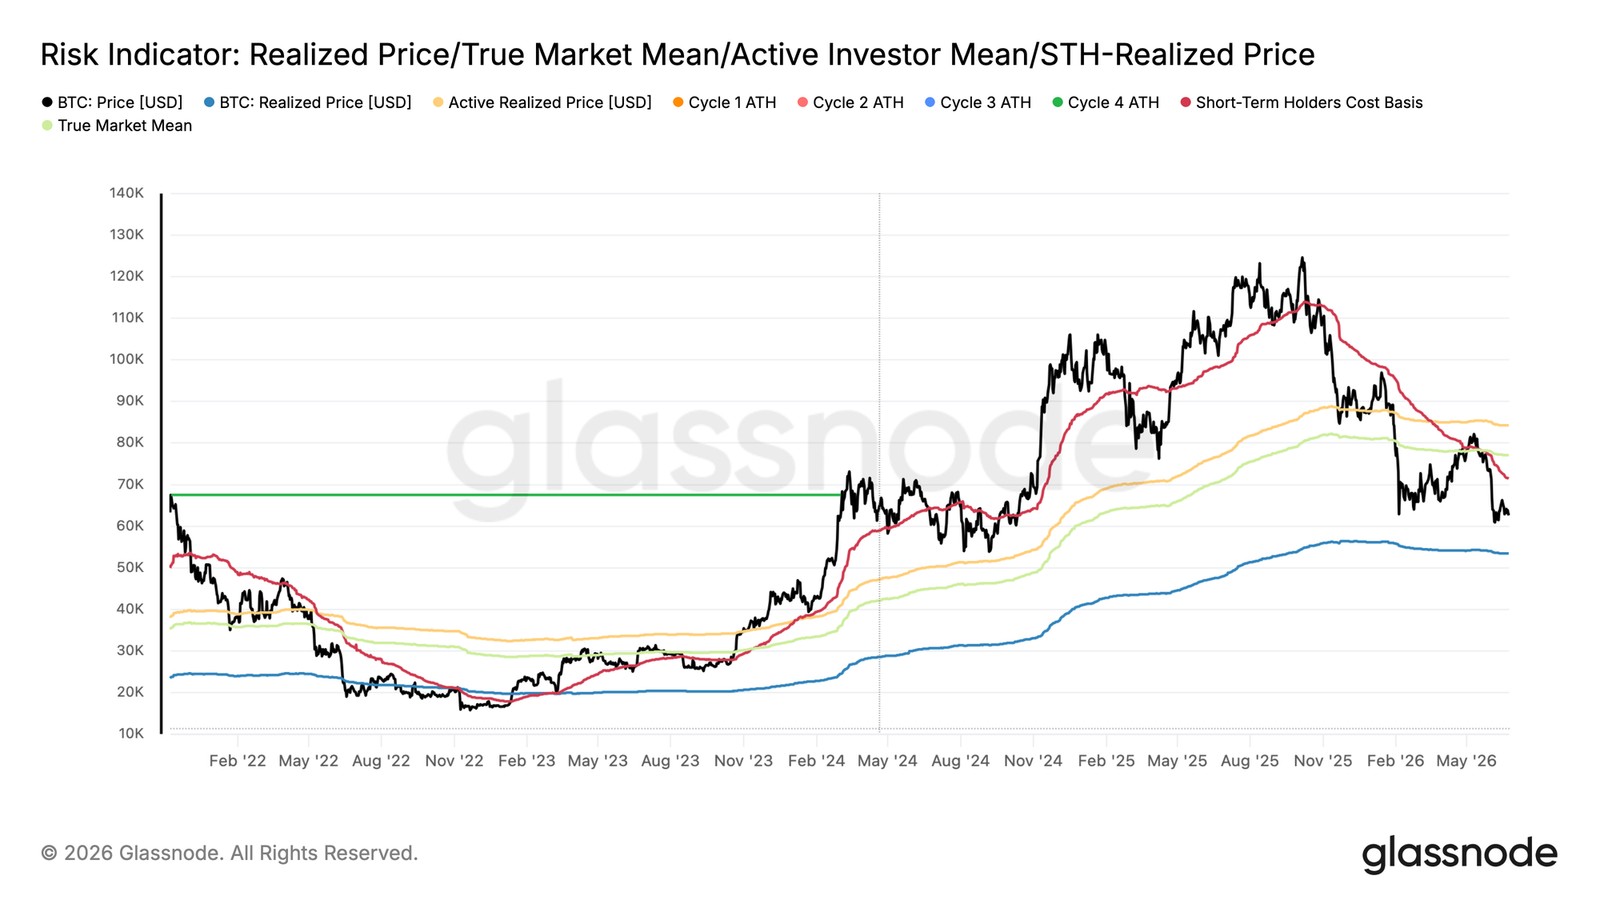
The current price of Bitcoin is $62,300, well below the true market average of $77,000. The true market average is the average cost basis of non-miner active investors and a key threshold to differentiate between bear and bull markets. The current 19% discount indicates that the price is still deeply entrenched in a structural bear market range.
Notably, the short-term holder cost basis has dropped to $71,400, reflecting significant accumulation by new buyers below the true market average. From a cyclical perspective, this is a constructive development, signaling a key step in bottom formation—new capital is now deploying at prices decoupling from recent cycle overheated levels.
The supply bought during this bear market phase is experiencing relatively smaller losses compared to the broader cycle-hanging supply, indicating more resilience to further pullback. If a macro-driven downturn occurs in the coming weeks, the realized price of $53,400 is expected to be a reasonable lower limit for the short- to medium-term bear market range.
Gravity Pulling Toward Lower Range
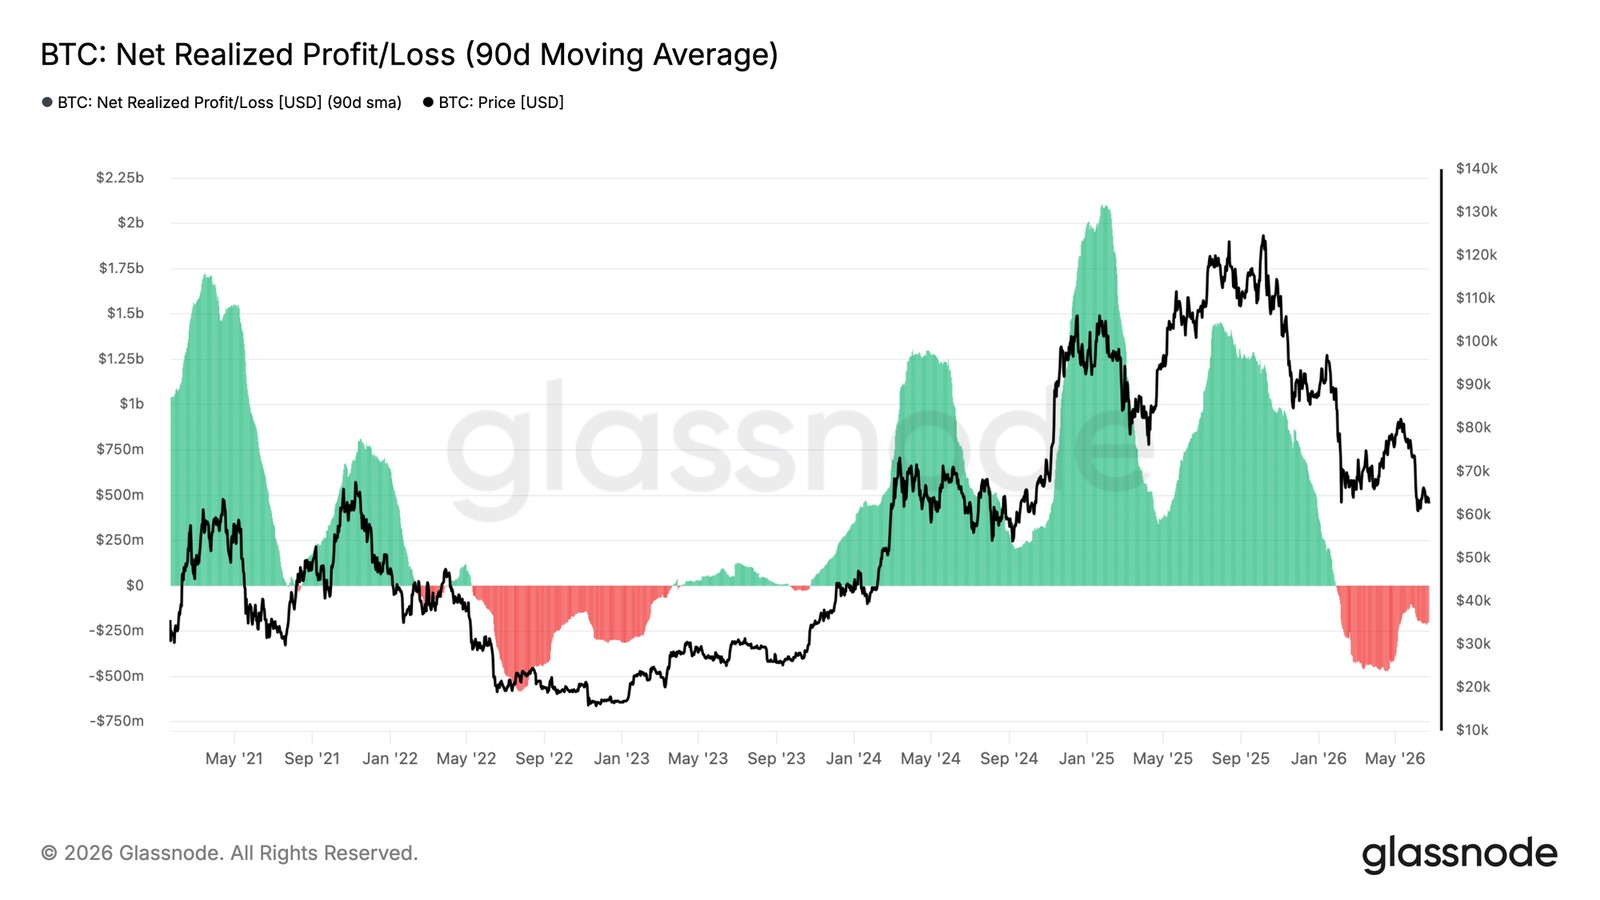
After establishing the 53,400-77,000 USD bear market range, the next question is which end of the price range is more likely to be approached. The Net Unrealized Profit/Loss (NUPL) metric measures the net difference in crystallized profits and losses in the market (in USD terms), effectively capturing whether dominant spending behavior is realizing gains or capitulating.
The 90-day moving average of this metric is currently at a daily -$205 million, confirming that loss realization has become the dominant force of a broader trend, implying that the market's center of gravity is still tilted towards the lower end of the current range (close to the realized price).
As this is a slow-moving average, the reading reflects a deeply entrenched loss-dominant environment rather than a singular pressure event. If this indicator rebounds to a neutral level (close to zero), it would be a strong signal that selling pressure is exhausting, indicating the formation of a pre-bull market transition phase.
Near-Term Price Action Constrained by Overhead Supply
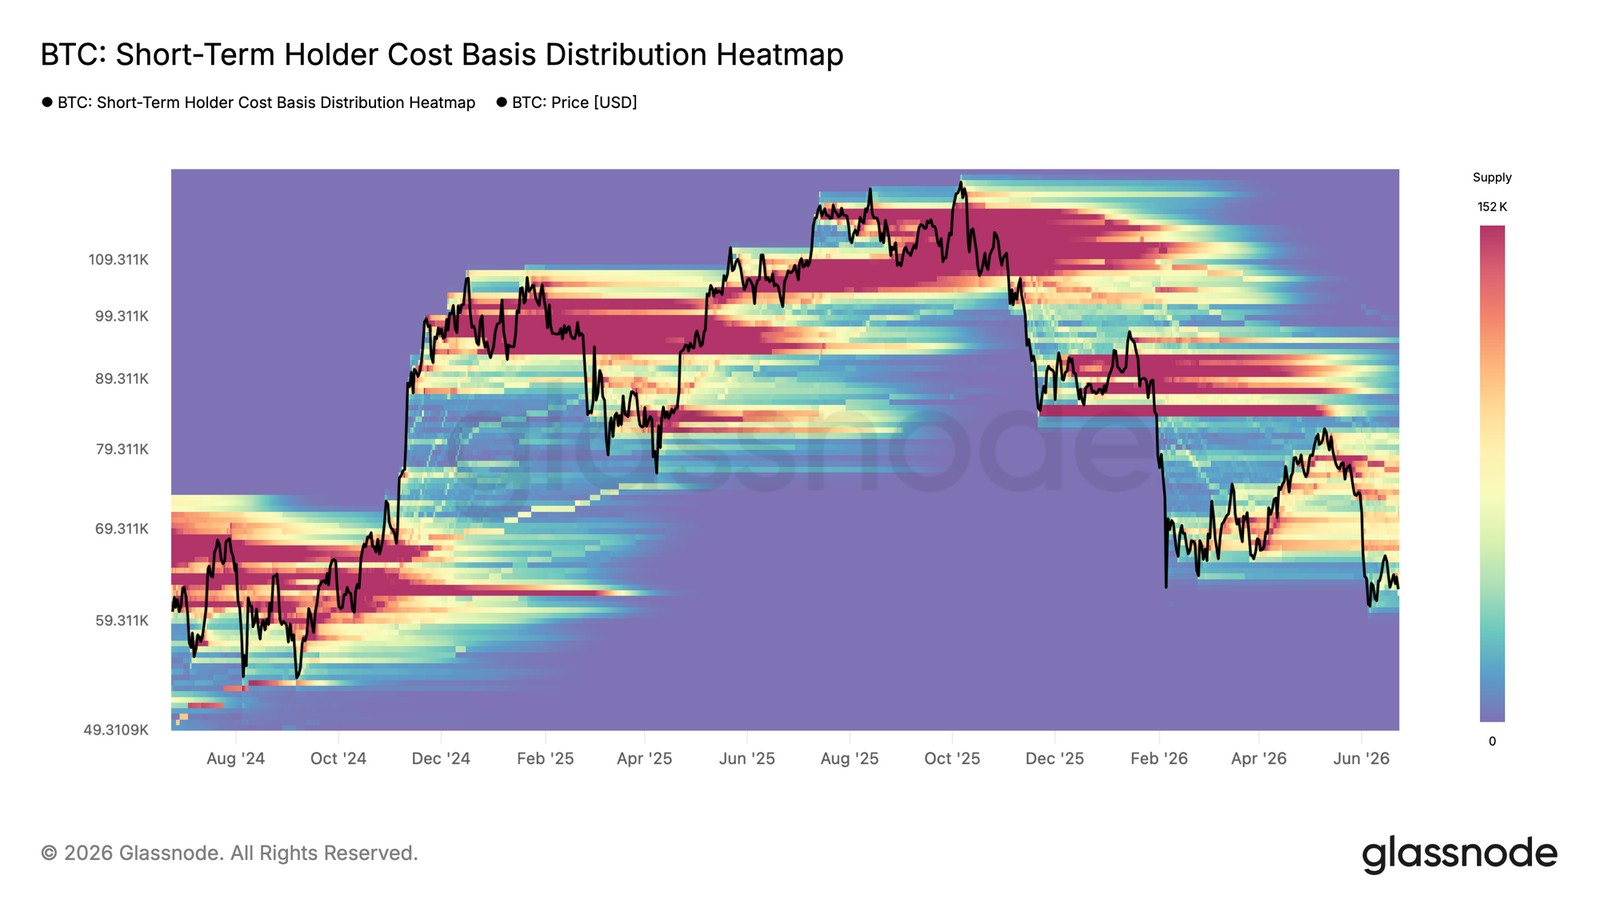
In addition to a broader negative capital flow environment, the current spot market is further weighed down by localized concentrations of overhead supply from short-term holders. The most significant cluster is situated in the $66,800-$70,700 range, representing coins accumulated recently that are currently at a loss and likely to generate selling pressure on any attempted rebound.
This area effectively defines the most likely ceiling for short-term consolidation or relief bounces, as holders within the range tend to behave near breakeven points and are inclined to exit as the price approaches their entry cost. Reclaiming above $66,800 would significantly alleviate upward pressure and increase the probability of an extension to $71,400, which is the mid-term to short-term holders' cost basis. Until then, this localized overhang remains an active cap on upward momentum.
On-Chain Insights
Continued ETF Outflows
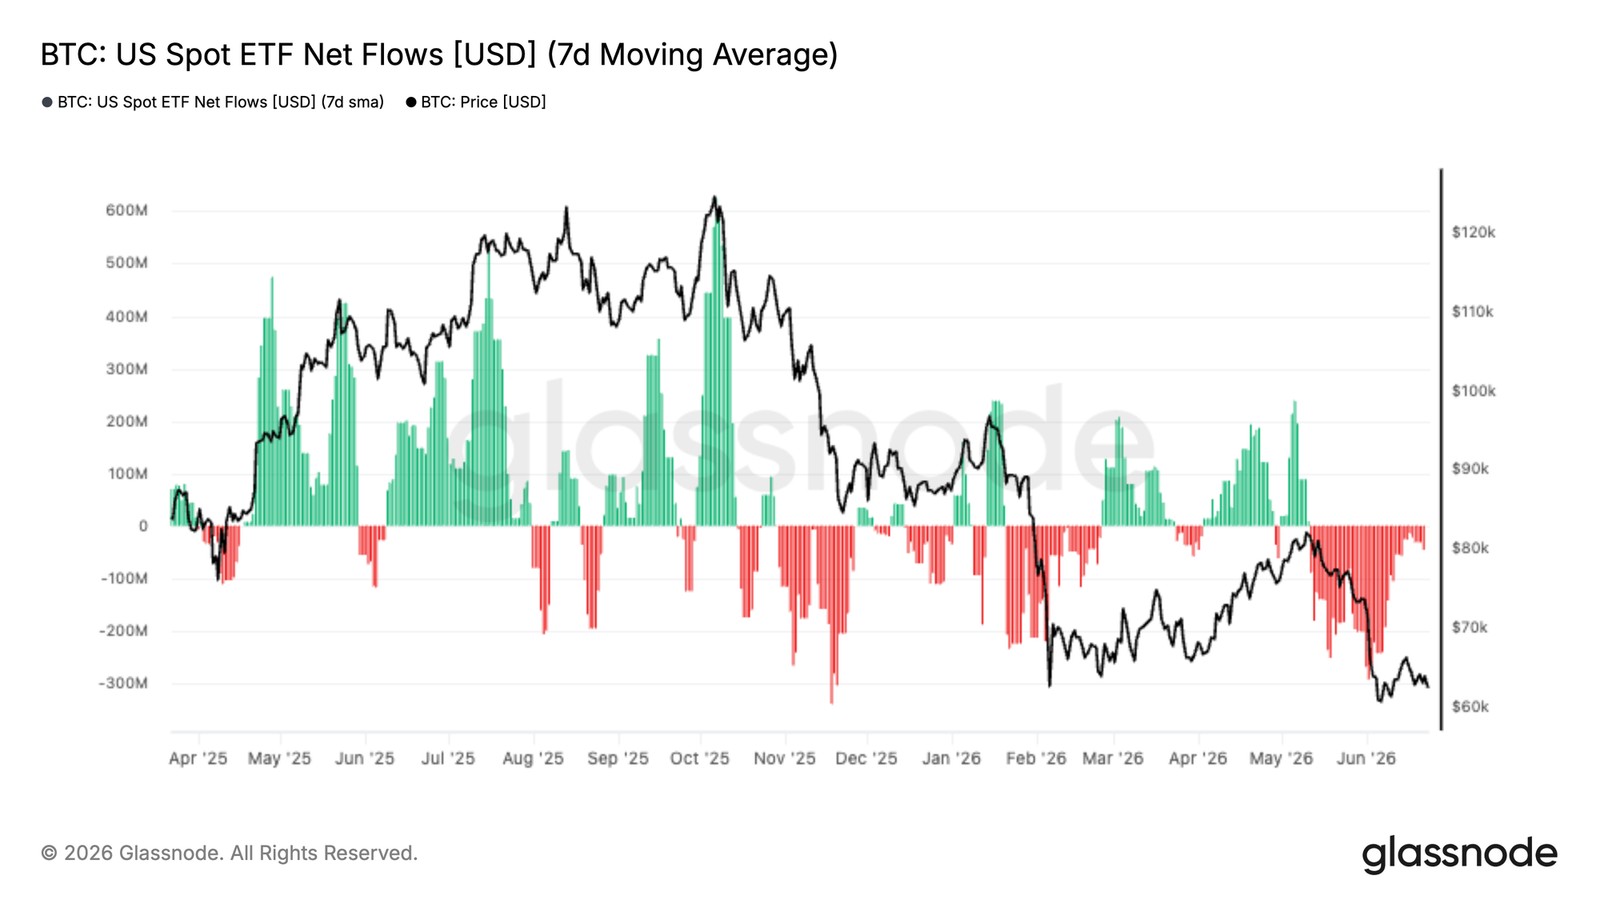
This week, institutional demand continued to face pressure, with the U.S. spot ETF average 7-day net outflows nearing around -$300 million per day, marking one of the most sustained withdrawal periods since the inception of ETFs. The magnitude of outflows and their duration suggest that despite Bitcoin trading near the lower range (around $60,000-$65,000), traditional investors are still maintaining a defensive stance.
It is worth noting that past pullbacks have often attracted ETF inflows, providing a significant source of demand during weak periods. However, the ongoing redemptions indicate that many investors are choosing to de-risk rather than accumulate during the pullback.
While the overall ETF outflows are negative, the redemption distribution is not uniform. Grayscale's GBTC continues to hold the largest redemption share, with over 16,000 BTC flowing out in the past 90 days. This suggests that the weakness is mainly being driven by legacy holders' liquidation and portfolio rebalancing rather than a unified retreat across the entire ETF sector.
Spot Buyers Beginning to Return
The spot market positions are starting to improve after enduring prolonged aggressive selling pressure. While the overall spot CVD deviation remains negative, recent rebounds show that the net selling intensity is easing, helping Bitcoin stabilize near the lower end of the trading range.
The most significant development is the divergence between exchanges. The Coinbase spot CVD skew has rebounded sharply back into positive territory, indicating renewed buying interest on platforms typically associated with U.S. institutional participants. Meanwhile, Binance remains in negative territory, suggesting that overseas traders continue to maintain a defensive posture.
This divergence in behavior points to an increasingly uneven market structure. Institutional investors appear to be absorbing supply on weakness, while speculative participants remain cautious. Although the broader spot market has not yet seen sustained accumulation, the improvement in Coinbase demand suggests that some investors are beginning to view the current price as an attractive entry level.
Futures Follow Spot Lower
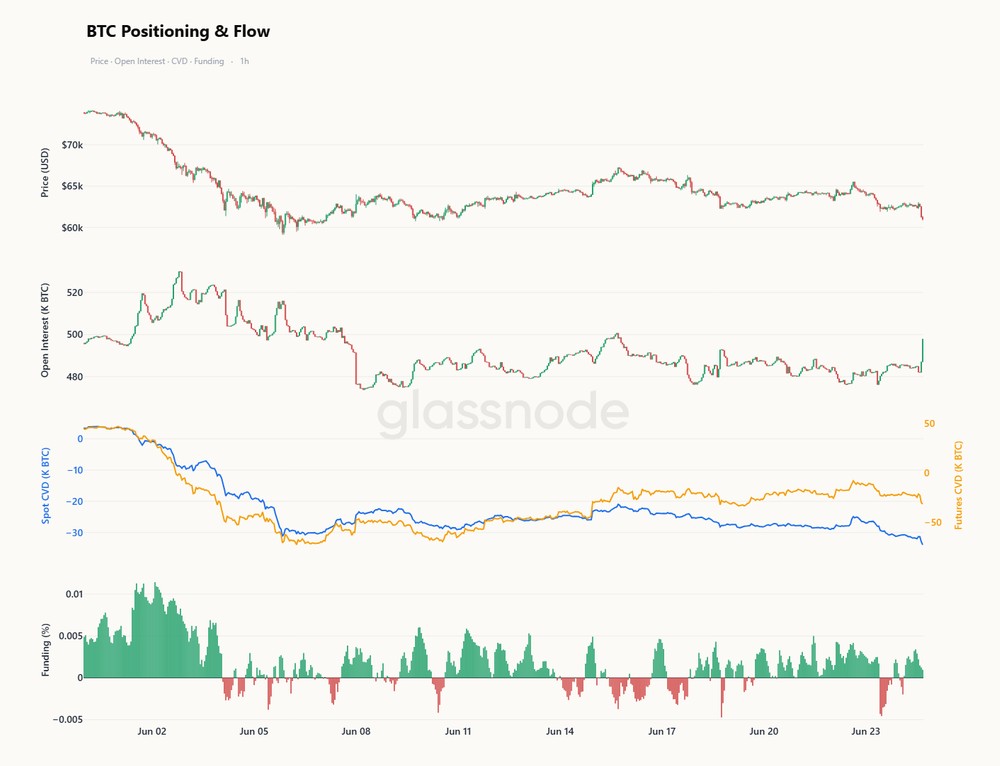
On shorter time frames, the retest of the low $60,000 region was a spot-driven move. Over the past ten days, spot CVD has fallen much faster than futures CVD, indicating that the aggressive selling pressure originated from spot venues rather than leveraged unwinds. Open interest remained subdued for most of this downturn, and funding rates stubbornly stayed positive even as the price declined, showing that perpetual longs were reluctant to capitulate, and the pressure did not come from the derivatives book.
This situation has started to shift. With Bitcoin retesting the low, open interest has surged significantly, and futures CVD has now turned negative in sync with spot, indicating that leveraged participants have finally joined the trend rather than fought it. At the same time, funding rates have fallen from their highs, alleviating the increasingly divergent bullish bias from the price action.
Spot has shouldered the bulk of the downturn, with derivatives now following instead of leading. If open interest continues to rise, accompanied by a drop in futures CVD and softening funding rates, it will confirm that leverage is surrendering to the lows where spot has previously sold off—such widespread participation often signals a more intense and thorough washout phase.
Implied Volatility Stabilizes After Recent Repricing
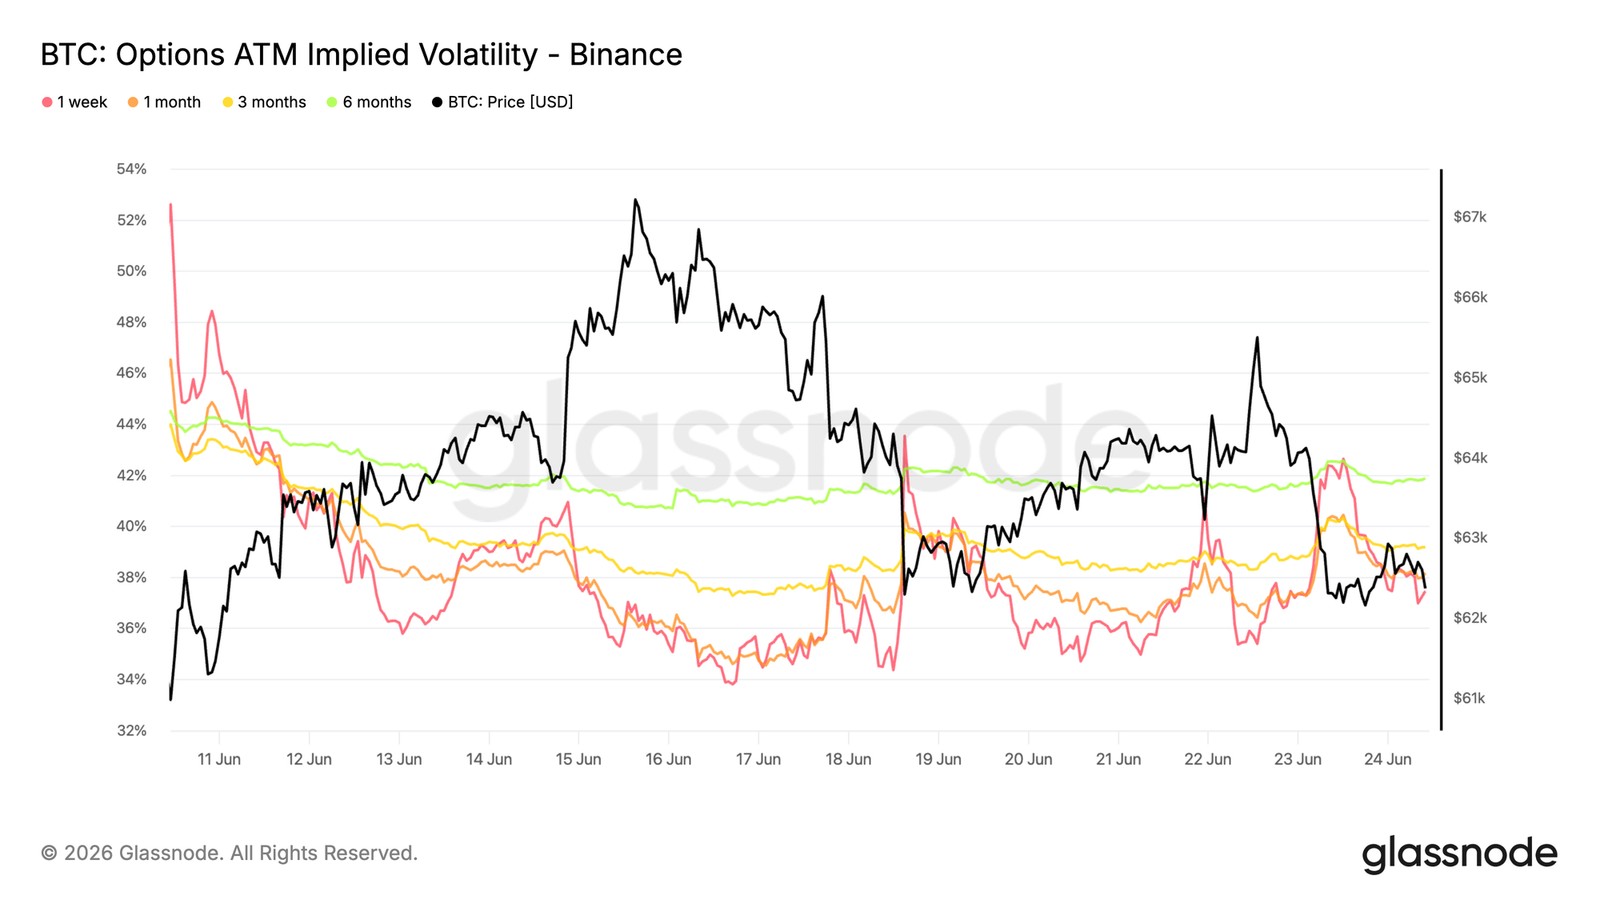
Following the sharp repricing triggered by Bitcoin's drop to June lows, the options market has entered a more subdued range.
The front end of the curve remains the most sensitive part. The one-week ATM implied volatility briefly exceeded 42% during the latest selloff, then fell back to around 37%. The one-month tenor dropped from around 40% to 38%, while longer tenors remained relatively stable, with three-month and six-month implied volatility close to 39% and 42%, respectively.
Despite Bitcoin continuing to trade near the key support of 60K-63K, this stability persists. The lack of sustained volatility buying suggests that traders are no longer aggressively repricing risk, and most of the protection premium from the recent high-pressure period has been removed.
Implied volatility has returned to a stable range, with the options market pricing in less urgency for additional short-term uncertainty.
Volatility Risk Premium Maintains Negative Value
Following the stabilization of implied volatility, the relationship between implied and realized volatility remains inverted, with the volatility risk premium holding a negative value.
The one-month implied volatility is currently around 38%, while the realized volatility has continued to climb to around 42%. Therefore, the volatility risk premium remains negative by about 4 volatility points, extending the recent market sell-off reversal.
A chart indicates that even after the normalization of implied volatility from its peak in early June, realized volatility remains elevated. In other words, the market's actual volatility is higher than the options' current pricing. Although the gap has slightly narrowed from recent extreme levels, the implied volatility has not yet rebuilt enough strength to bring the spread back to a positive value.
As the realized volatility is still higher than the implied volatility, the options market continues to price in a calmer environment than what the recent price action has shown.
25 Delta Skewness Rebuilding Across Maturities
After the volatility risk premium became negative, skewness indicators revealed how downside protection demand evolved as Bitcoin traded near key support levels.
Skewness is calculated as the put option volatility minus the call option volatility, with a positive value indicating a premium for put options over equidistant call options. Over the past week, this premium has risen across the entire curve. The one-week skewness has increased from around 12% to 24%, the one-month maturity from around 14% to 23%. The three-month and six-month maturities have also risen to around 19% and 14%, respectively.
A chart shows that despite the relative stability of implied volatility, there has been a widespread repricing of downside protection. Traders seem to be increasingly willing to pay a premium for downside hedges instead of overall paying more for volatility.
The rebuilding of protection demand across maturities indicates that despite stable volatility levels, traders have renewed their preference for downside hedges.
Gamma Exposure Concentrated Near Current Spot
Aside from pricing and sentiment, gamma exposure helps identify the strike price levels at which market makers' hedging could have the most significant impact on market dynamics.
Recent fund flows show that traders are more comfortable with selling premium. Over the past seven days, put option selling has accounted for the largest share of trading premium, reaching 31.2%. In the last 24 hours, this trend has intensified, with put selling representing 47.2%.
This shift is reflected in the gamma profile. The two largest positive gamma clusters are located at 60K and 64K, with Bitcoin currently trading around 62.8K between the two. Within the positive gamma range, market maker hedging tends to suppress volatility, helping to keep spot prices within the range. In contrast, the recent negative gamma exposure is at 65K and is significantly smaller than the positive gamma cluster at 64K.
Market maker positions still predominantly favor a positive gamma near the current level, creating conditions that could keep volatility in check between 60K and 64K.
Conclusion
Bitcoin continues to trade in a market defined by caution rather than conviction. On-chain metrics indicate that the asset is deeply discounted relative to the average investor's cost basis, and ongoing sell-offs suggest that the bear market remains firmly entrenched. Meanwhile, ETF outflows and defensive positioning in the options market underscore a lack of widespread risk appetite among institutions and derivatives participants.
However, beneath the surface, early signals of stabilization have emerged. Coinbase spot flows are constructive, short-term holder cost basis is trending lower, and recent weakness has been primarily driven by spot sellers rather than excessive leverage. While these developments do not yet signal an imminent trend reversal, they align with early-stage characteristics of a bottoming process.
Currently, the market remains in a tug-of-war between continued distribution and emerging value-driven demand, with the interplay of these forces set to define Bitcoin's next major move.
Original Article Link
Welcome to join the official BlockBeats community:
Telegram Subscription Group: https://t.me/theblockbeats
Telegram Discussion Group: https://t.me/BlockBeats_App
Official Twitter Account: https://twitter.com/BlockBeatsAsia