Is the Predictions Market a Money Tree? A Deep Dive into Its Revenue Model

Original Article Title: "Is the Prediction Market a Money Tree? A Deep Dive into Its Revenue Model"
Original Article Authors: Changan, Amelia, Biteye
When discussing the prediction market in the past, the focus was more on its accuracy, trading volume, and whether it could become a new information market. However, when the prediction market is viewed as a business, the central question changes: What is the revenue model of the prediction market?
In the business world, high trading volume does not necessarily mean the platform is profitable. A market can have a huge volume, and users can trade frequently, but if most of the trading does not generate fees, or if the platform's activity relies solely on subsidies and points, then the trading volume is just superficial data rather than healthy revenue.
For the prediction market, what truly tests the business acumen is not "how many markets are open" or "how popular a certain event is," but whether the platform can seamlessly link three things together:
1. Creating a genuine desire to trade;
2. Maintaining deep order book liquidity;
3. Converting Taker trading demand into Fees.
This is also why the business model of the prediction market is by no means a simple "opening markets and collecting taxes." On the surface, it may just seem like a series of YES/NO gambling games, but what truly underpins the platform's revenue foundation is the underlying trading structure, liquidity mechanisms, fee incentives, and user behavior.
Especially since the leading platform Polymarket has systematically introduced Taker Fees, the narrative of the prediction market has shifted from being an "information tool" to entering a "revenue validation" stage.
This article will take a business perspective and deeply analyze the underlying cards of the prediction market:
· How do prediction market platforms make money?
· Why does the Maker/Taker game structure determine the life or death of a platform?
· What are the essential differences in fee design from mainstream platforms like @Polymarket, Kalshi, @opinionlabsxyz, and @predictdotfun?
· Why is the highest trading volume track not necessarily the most profitable track?
Key Takeaway: Predictive markets sell not the answer but the divergence.
The closer the price is to 50/50, the greater the market divergence, the stronger the trading impulse, and the easier for the platform to convert transaction fees from active trading; the closer the price is to 0 or 100, the more the result tends to be certain, although the informational value remains, the corresponding fee weight will decrease significantly.
Therefore, the real barrier of predictive markets is not turning the "event" into an outcome but turning the "divergence" into trades, then robustly converting trades into revenue.
I. How Predictive Markets Make Money: Turning Divergence into Fees, Not Opening Odds
To break down the cash flow of predictive markets, we first need to clarify the four core revenue drivers. They are intertwined, forming a closed loop from traffic to monetization.
1. Transaction Fees - Direct Revenue Source
Most predictive markets charge the active trading party, the Taker. This is because the Taker consumes liquidity, while the Maker provides liquidity.
This means that not all trades in predictive markets will generate revenue. Those that truly contribute fees to the platform are often users willing to trade actively, willing to pay for speed and certainty.
2. Liquidity - A Continuous Trading Cornerstone
The hardest part of predictive markets is not opening the odds but making the odds deep.
If there are no orders on an outcome, users cannot buy or sell, even if they want to, making it difficult for this market to establish an effective price, despite the topic's relevance.
Therefore, many platforms will lower Maker costs or even incentivize Makers.
This is not a direct "revenue source," but it determines whether transaction fees can exist in the long run.
Without liquidity, there is no sustained trading, and consequently, fee revenue cannot remain stable.
3. Informational Value - Mental Dominance
What sets predictive markets apart from ordinary trading platforms is that they are not just trading tools but also produce information.
When a market has sufficient trading volume and liquidity, its price becomes a form of signaling. The media quotes it, KOLs interpret it, traders watch it, and regular users use it to gauge market sentiment.
This signaling may not directly translate into transaction fees, but it brings attention, user awareness, and external communication to the platform. In the long run, this informational value will, in turn, enhance trading demand.
4. User Operation and Discount System - Monetizing Engagement
In addition to basic transaction fees, different platforms also enhance transaction frequency through discounts, referrals, events, loyalty points, and rebates. These measures may not directly generate revenue, but they impact the platform's long-term monetization ability.
For example, Opinion offers user discounts, transaction discounts, and referral discounts; Predict.fun adopts a simpler basic fee and discount mechanism; Polymarket focuses on differentiated rates for different tracks and Maker rebates. The essence of discounts and incentives is not merely subsidies but exchanging part of the profit for user retention, gradually converting engagement into revenue.
II. Cross-Platform Fee Structure Comparison for Mainstream Prediction Markets
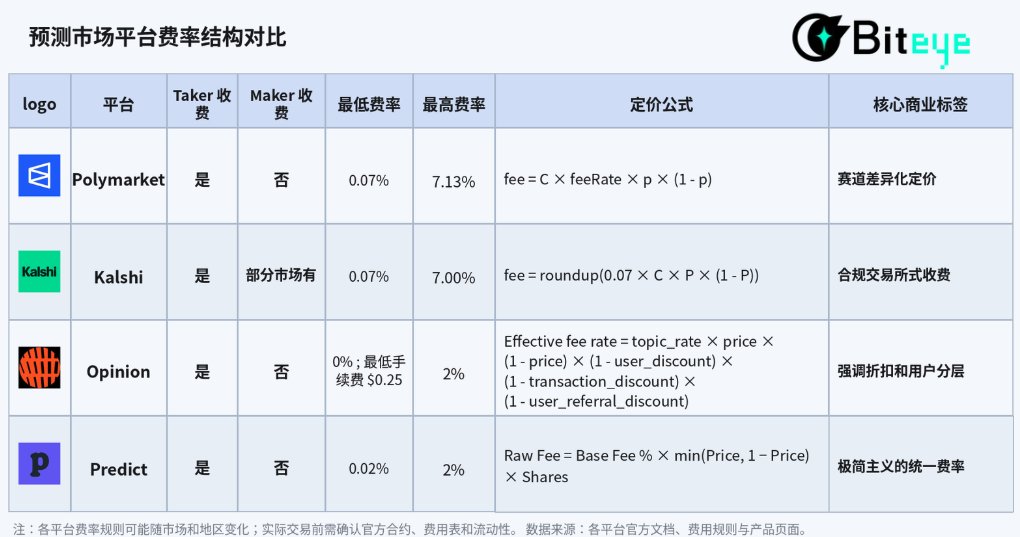
Looking at the fee designs of several mainstream prediction markets, the industry's strategic direction is highly convergent: encouraging order book liquidity provision and converting active trading into revenue. However, in tactical execution, major platforms exhibit clear strategic differentiations due to their distinct positioning.
1. Polymarket: Granular Pricing by Track
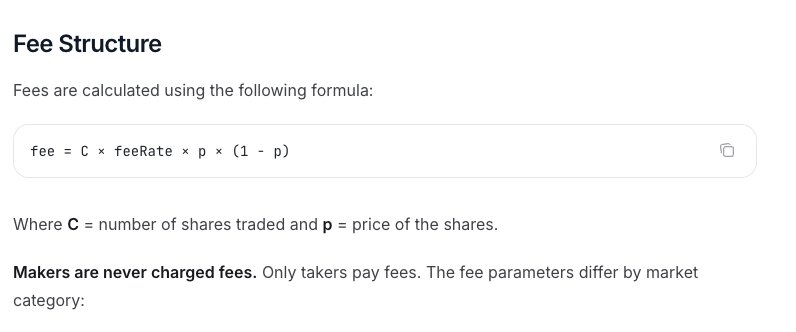
Polymarket's Taker fee logic combines "track differentiation" and "price divergence pricing" to the extreme. Its official core formula is:
fee = C × feeRate × p × (1 - p)
Here, C is the volume of the transaction, p is the transaction price, and feeRate is determined by the market track.
This mechanism includes two core variables:
· Granular Track Pricing: Based on the current validated rate caliber, the feeRate for the Crypto track is 0.07, Sports is 0.03, Politics / Finance / Tech is 0.04, Culture / Weather is 0.05, and some Geopolitics markets are 0.
In other words, Polymarket does not charge a unified fee for all markets, but rather adopts a differentiated fee structure based on the trading frequency, sensitivity, and user willingness to pay across different market categories.
· Divergence-based Pricing: It aligns perfectly with a mathematical curve of p × (1 - p). The closer the price is to 50/50 (maximum market divergence), the higher the fee; the more certain the outcome (approaching 0 or 100), the lower the fee.
2. Kalshi: Closer to a Compliance Trading Platform Model
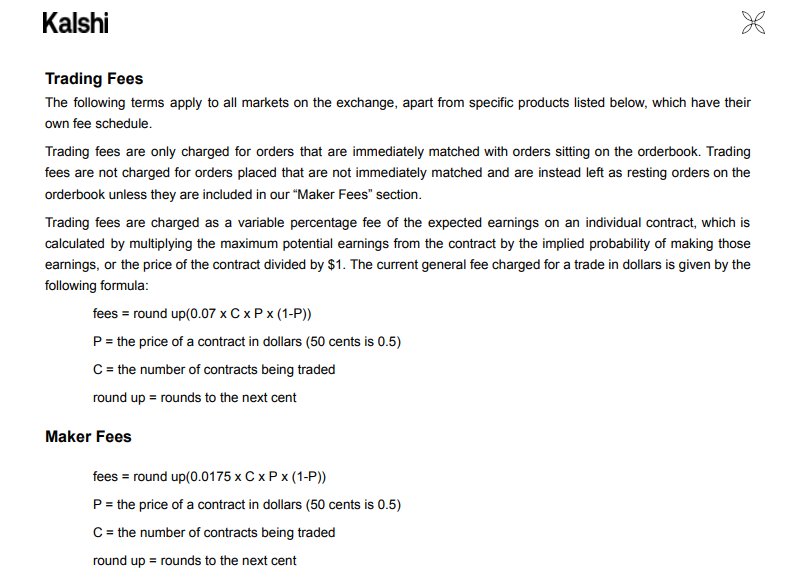
Kalshi's fee structure is designed to be more in line with traditional financial derivatives trading platforms within a compliance framework. The regular Taker fee formula is also linked to price divergence as follows:
fee = round up(0.07 × C × P × (1 - P))
Where C is the contract quantity, P is the contract price, and the fee is rounded up to the nearest cent. This structure is quite similar to Polymarket's C × feeRate × p × (1 - p).
Kalshi's fee structure shares similarities with Polymarket: the trading fee is also related to the contract price, with fees higher the closer it is to 50¢ and lower towards 1¢ / 99¢. Kalshi's fee schedule indicates that the taker fee for 100 contracts ranges roughly between $0.07 and $1.75.
However, a key difference between Kalshi and Polymarket is that Kalshi has Maker fees for some markets, and these fees are only charged when these orders are ultimately executed, with no fee for canceled orders. This indicates that Kalshi's fee structure is more akin to a compliance trading platform: it does not simply offer permanent Maker fee waivers but sets up more complex bilateral fee rules based on different markets.
3. Opinion: Emphasizing Discounts and User Segmentation
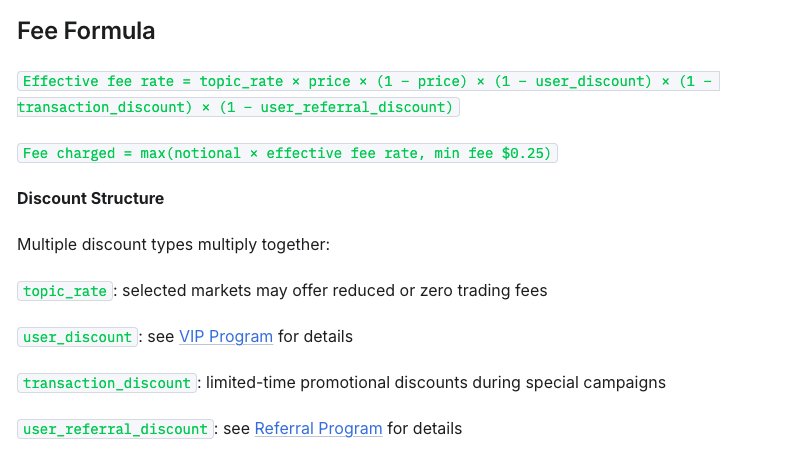
Opinion has introduced an extremely complex "multidimensional discount system," with the effective fee rate formula being:
Effective fee rate = topic_rate × price × (1 − price) × (1 − user_discount) × (1 − transaction_discount) × (1 − user_referral_discount)
In other words, the cost of an Opinion not only depends on the market price and the topic rate, but is also affected by user discounts, transaction discounts, referral discounts, and other factors.
Opinion also has a $5 minimum order size and a $0.25 minimum fee to avoid excessively low fees for small transactions.
This shows that Opinion's fee structure is more focused on user operations:
· The topic rate is used to differentiate between different markets
· The user discount is used for user segmentation
Therefore, compared to Polymarket's "Race Differentiation Pricing," Opinion seems to have turned the fee into an operational tool: on one hand, guiding users through a discount system for trading, retention, and user acquisition, and on the other hand, allowing Makers to place orders for free to maintain market liquidity.
4. Predict.fun: Minimalist Unified Fee Structure
Predict.fun's fee structure is relatively simpler, which helps reduce user comprehension costs.
According to its current public statement, its fee calculation formula is as follows:
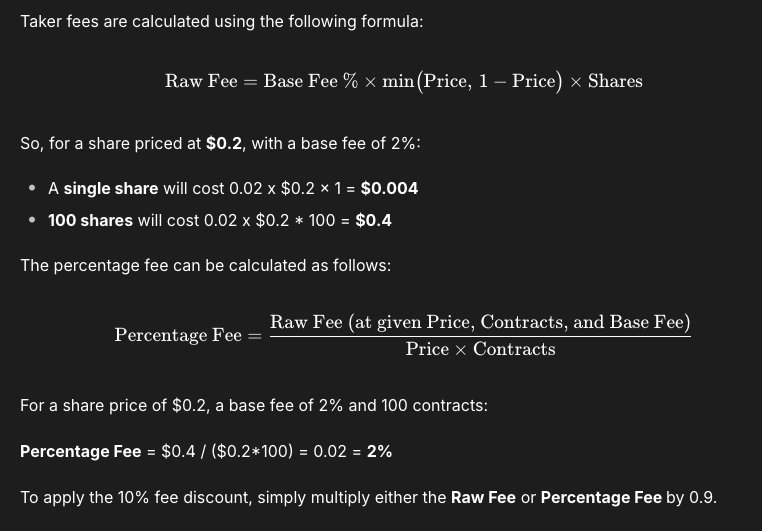
Raw Fee = Base Fee % × min(Price, 1 − Price) × Shares
The Base Fee is currently 2%. The actual fee rate varies with the transaction price: when the price is below 50%, the fee rate is basically fixed at 2%; when it exceeds 50%, as the price approaches 1, the actual fee rate decreases.
In addition, Predict.fun also supports fee discounts, further reducing transaction fees.
This design is more intuitive: users do not need to determine which side of the market order book they are on; they only need to focus on the transaction price itself to understand the fee changes.
You can see that prediction market platforms have a common goal: they are all trying to convert active trading behavior into revenue.
This also indicates that there is not just one path to commercializing prediction markets. Ultimately, they are all answering the same question: are users willing to pay for transactions?
III. In-Depth Breakdown of Polymarket: Trading Volume Does Not Equal True Revenue
While each platform has its own unique features, to assess the true realization efficiency of the prediction market, Polymarket remains the most suitable platform sample to observe.
The main reasons are twofold:
· Its fee structure is the most transparent: from venturing into Crypto, expanding to Sports, and further encompassing almost all categories under a fee structure
· Its data is also more comprehensive: official fee rates, 7-day / 30-day fees can all be used to further dissect the revenue structure
Therefore, next, we will take Polymarket as an example to answer a more specific question: Is the most traded market also the most profitable?
3.1 From Free to Fee: Polymarket's Commercialization Timeline
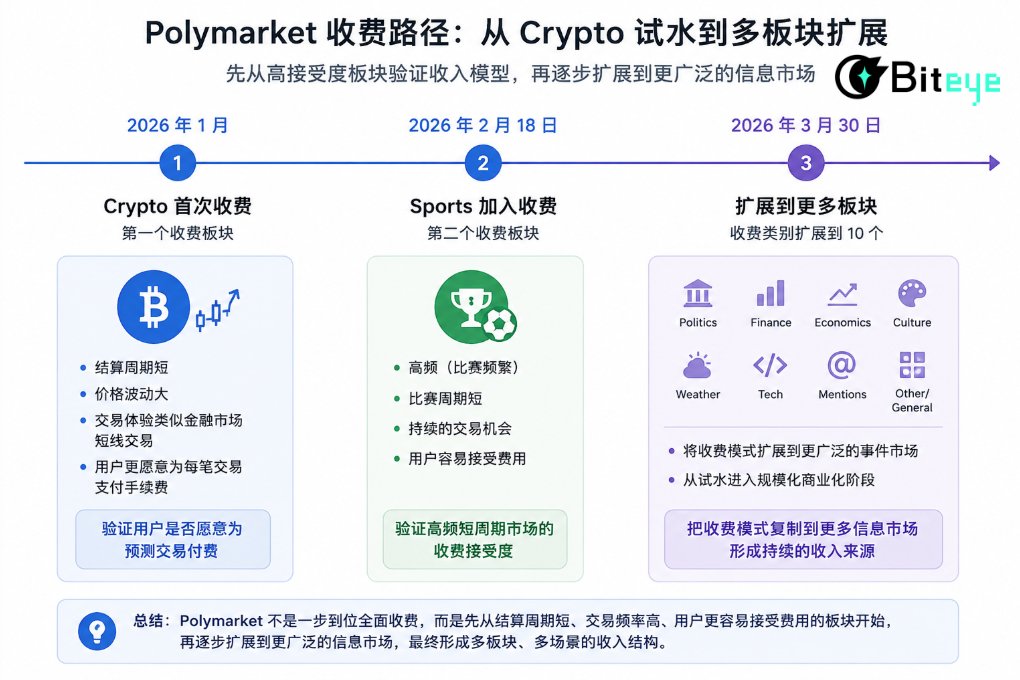
January 2026: Crypto becomes the first fee-charging category
Polymarket re-enters the U.S. market, introducing a Taker Fee in the Crypto category. The short settlement period, high price volatility, and trading behavior resembling quick scalping make the pursuit of liquidity far greater than sensitivity to friction costs, providing an excellent fee experimentation ground.
February 18, 2026: Sports becomes the second fee-charging category
Shortly after, on February 18, 2026, the Sports category became the second fee-charging category. Sports markets exhibit a natural high-frequency, short-term characteristic that can offer continuous trading scenarios. Therefore, Sports is a natural extension for fees.
Therefore, Polymarket first charged fees for Crypto and Sports, actually validating the revenue model by first taking the more widely accepted categories.
March 30, 2026: Fee expansion to more categories
On March 30, 2026, Polymarket expanded the taker fee to categories such as Politics, Finance, Economics, Culture, Weather, Tech, Mentions, Other / General, reaching a total of 10 fee-charging categories.
After implementing full fees, Polymarket did not simply charge the same fees for all markets, but adopted a more granular fee structure. This step can be seen as a key milestone in Polymarket's commercialization, as Polymarket begins to extend the fee model to a wider range of markets.
The impact of full fees has been extremely impressive. According to the latest data, Polymarket has demonstrated significant fee generation capabilities: 7D Fees reached $9.27 million, 30D Fees reached $36.3 million. Its 7-day revenue has surged into the top six of all Crypto projects, officially entering the revenue-generating project echelon.
3.2 Core Market Type and Price Distribution Breakdown
To calculate the true revenue of each market segment on Polymarket as accurately as possible, we estimated the fees for the five main tracks based on Polymarket transaction data from 2021 to February 2026 1.
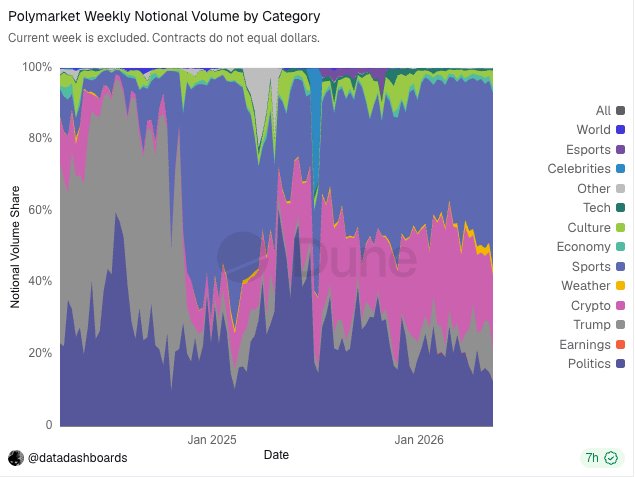
From the market order percentage perspective, there are significant differences among the five tracks:
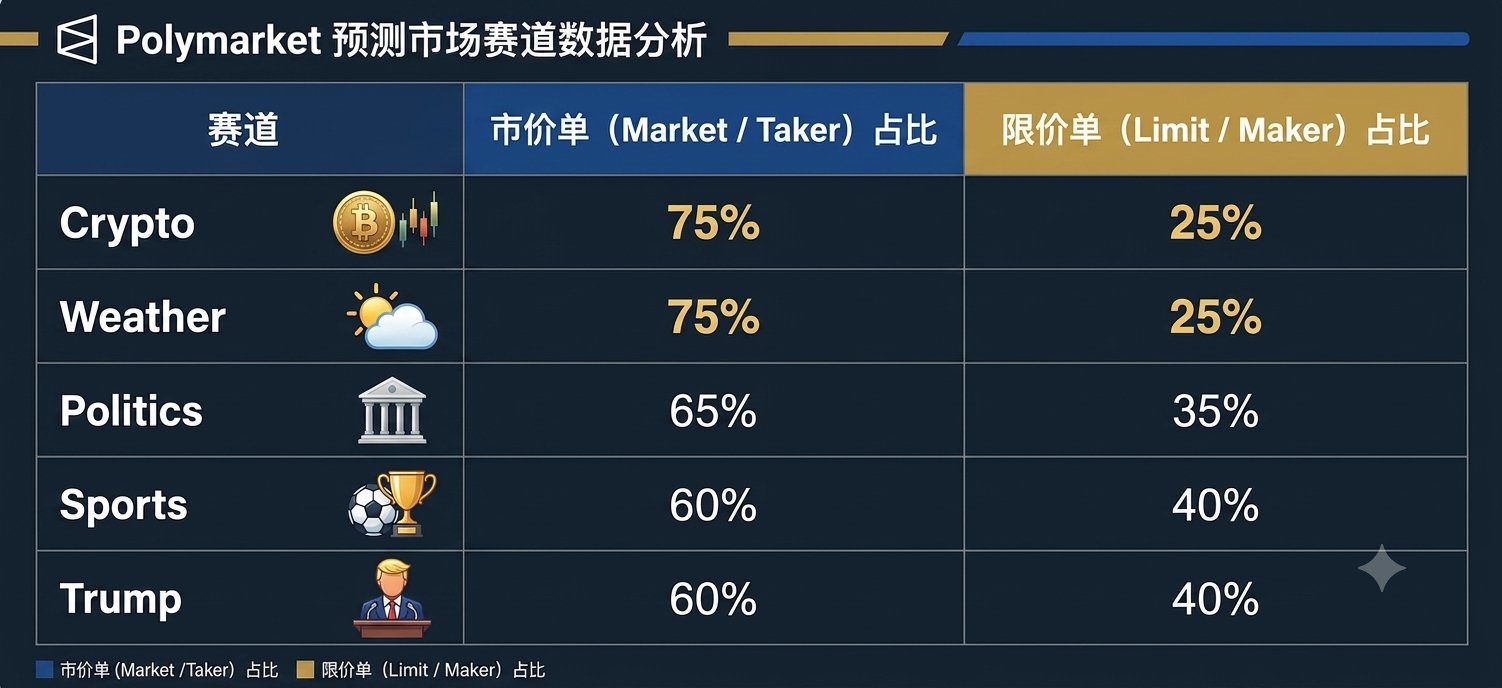
The Market share of Crypto is the highest, reaching 75%, which aligns with the characteristic of crypto assets being "constantly changing," where users prefer to directly lock in gains or losses with market orders; the Weather track, being driven by real-time weather data, also highly values response speed.
Next, the amount of fees heavily depends on the price range of the order book.
This is because trades entering the fee calculation do not generate the same fees. Polymarket's fees are related to p × (1 - p), where the price closer to 50/50, indicating a wider market divergence, results in a higher fee weight; as the price approaches 0% or 100%, becoming more certain, the fee weight decreases.
Looking at the data from the five main tracks, most of the trades are concentrated in the 30-50 range, especially the 40-50 range:
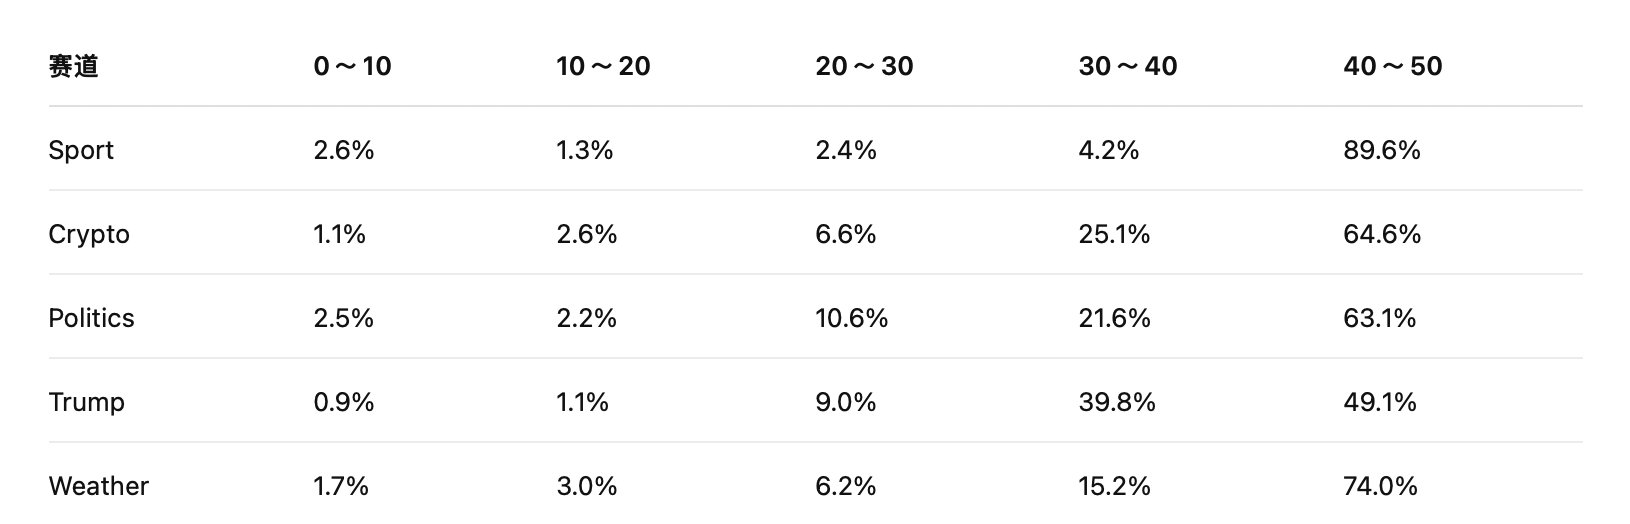
This set of data indicates that Polymarket's main trades do not occur in ranges where the outcome is already close to being certain but are instead concentrated in positions where there is still a clear market discrepancy.
3.3 Revenue Estimation: Who is the Cash Cow?
We calculate Polymarket's fee revenue in the five markets by using the market trading volume for each market, combining it with the corresponding fee rate, and then applying a p × (1 - p) weight for different price ranges. We also take into account that after the fee implementation, some users sensitive to fees will switch from Taker to Limit orders. Particularly, users engaging in end-of-day trading, low-odds arbitrage, or short-term frequent trading will more carefully calculate their return on investment.
Therefore, we can make a more conservative assumption based on the original estimate: assuming that after the fee implementation, the market order trading volume in each market will decrease by 20%.
The adjusted formula becomes:
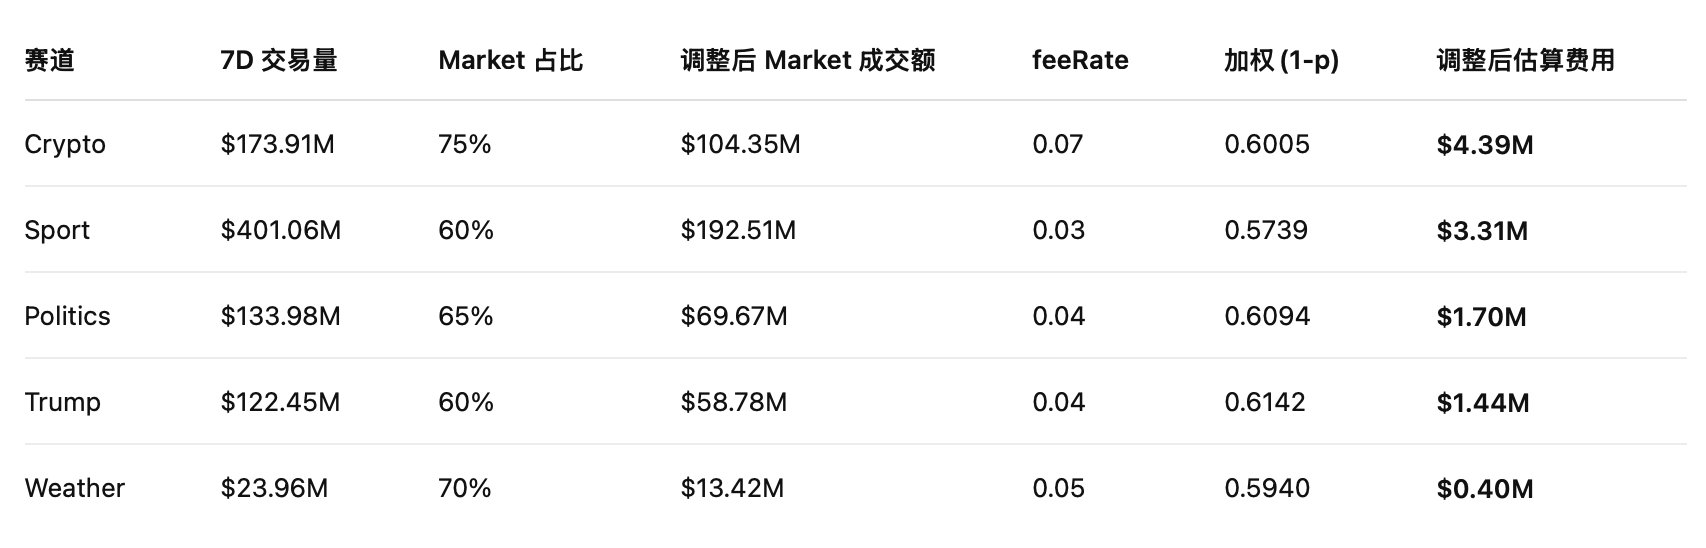
Adjusted Estimated Fee ≈ Market Trading Volume × 80% × feeRate × (1 - p)
Based on the 7-day total trading volume and the percentage of trading volume in each market, we estimate the 7-day market order trading volume for the five main markets.
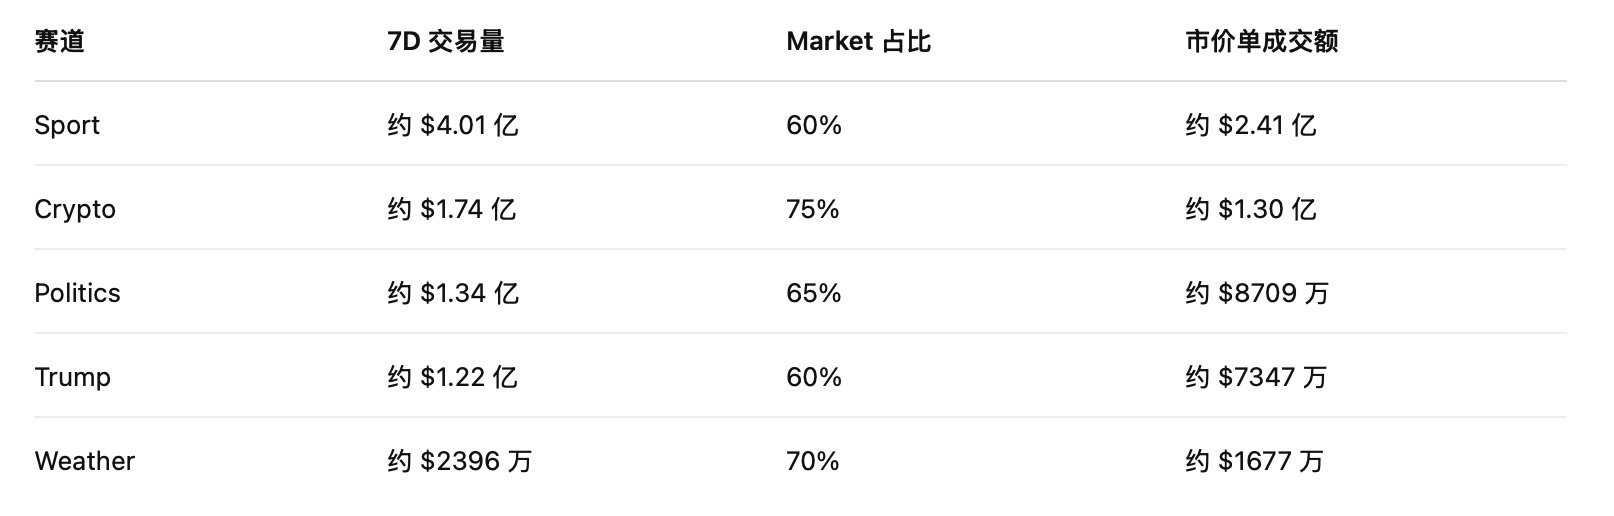
Having already calculated the market order trading volume for each market, we will now estimate the fees by considering the fee rates and price range weights for each market. To ensure a more conservative calculation, we use the median price of each range as an approximate price:
(Note: Due to differences in data sources, lag in historical single type percentages, and market dynamics, this estimation model aims to approximate the contribution of each market, and the sum may have reasonable deviation from the actual system settlement total fees.)
What Do the Data Reveal?
1. Crypto is the most profitable market currently, with an estimated 7-day fee of approximately $4.39 million, making it the "cash cow" of Polymarket.
This may seem counterintuitive because looking at the trading volume distribution, Sport is actually the largest market, with a 7-day trading volume of around $401 million, higher than Crypto's $174 million. However, in terms of fees, Crypto is the top performer, and this is mainly due to two reasons:
· Higher market order percentage: The Market order percentage is around 75%, significantly higher than Sport's 60%. Since Polymarket mainly charges fees on market orders, Crypto sees more transactions subject to fees.
· Highest feeRate: The feeRate is 0.07, while Sport is only 0.03. Even if the market order transaction amount of the two is the same, the fee generated by Crypto's unit transaction amount will be significantly higher.
2. Sport is the second largest source of fees, with an estimated 7-day fee of about $3.31 million, acting as the "Transaction Volume Foundation".
Sport's advantage lies in its significant transaction volume. Its 7-day transaction volume is about $401 million, ranking first among the five tracks. However, its weakness is also apparent: it has the lowest feeRate, only 0.03.
3. If Politics and Trump were merged into a political category, the estimated 7-day fee would be about $3.14 million, very close to the Sport section, serving as a pulse-like traffic funnel.
The characteristic of the political category is its strong event-driven nature. Unlike Sport, which has stable matches every day, or Crypto, which has continuous price fluctuations, political events such as elections, polls, policy changes, and candidate statements can lead to concentrated trading. Therefore, although the trading pace of the political category may not be stable, its fee contribution is significant during hot periods.
4. Weather has an estimated 7-day fee of about $400,000, the lowest among the five tracks.
Therefore, Polymarket's revenue structure can be briefly summarized as follows: Crypto is responsible for platform revenue, Sport is responsible for transaction volume, Politics / Trump is responsible for the outbreak of hot events, attracting users to the platform.
IV. Four Conclusive Judgments on the Prediction Market Track from Polymarket's Perspective
Polymarket's successful closed loop has brought a rethinking to the entire prediction market track:
1. Comprehensive Overhaul of Evaluation Metrics
In the past, when looking at prediction markets, the focus was on transaction volume and popular topics. As we enter the commercialization era, the metrics for determining success or failure will completely shift to: True Fees, Taker Ratio, Order Book Depth, and Buy/Sell Spread. Reliance solely on artificially boosted transaction volume will be difficult to sustain under a fee mechanism.
2. Different Event Types Correspond to Different Revenue Roles
Future prediction market platforms will not rely on a one-size-fits-all approach but will move towards specialized division of labor.
· Crypto markets are more akin to financial trading, with rapid price changes and short feedback cycles. Users are more sensitive to transaction speed, making it easier to achieve high income efficiency.
· Sports markets are more like a steady stream of water, with frequent matches, clear outcomes, and continuous trading scenarios, making them suitable for contributing to daily trading volume.
· Politics/Trump markets lean more towards event-driven scenarios. They may not be stable during normal times, but once they reach key points such as elections, polls, or policy changes, they are prone to high trading volumes.
· Weather markets demonstrate that as long as the event is sufficiently standardized and the outcome is clear, even if the scale is not large at the moment, there is still an opportunity to create a trading scenario.
3. The Fee Mechanism Will Drive Quality of Markets in Reverse
During the free phase, platforms can offer many markets. After implementing fees, users and liquidity providers will become more cautious with their choices. The fee mechanism will in turn filter market quality.
A good prediction market not only requires engaging topics but also needs to meet several conditions simultaneously:
· Clear outcomes for easy settlement
· Frequently updated information to drive price changes
· Significant market divergence to motivate users to trade
· Sufficient liquidity for users to willingly make transactions
· Results that are difficult to manipulate
4. The Barrier of Prediction Markets Lies in "Continuous Pricing Power"
It is not difficult to open a YES/NO market; what's challenging is to ensure there are always bids, asks, price updates, and risk-takers in that market. Only when a market has enough depth and trading frequency does its price become meaningful as a reference, allowing the platform to generate revenue from it.
Therefore, the true barrier of prediction markets is not "who can discover hot topics faster," but rather: turning those hot topics into tradable markets, maintaining market liquidity in the long term, and making the price a signal that the external world is willing to reference.
5. In Conclusion
There are plenty of projects that can tell grand narratives, but turning that narrative into actual revenue is a rare gem.
Polymarket used to be the shining example of traffic in the entire space, and as it completed the transition from the "traffic narrative" to "systematic monetization," it wanted to prove one thing to the entire industry:
The ultimate value of prediction markets lies not only in "how accurate the predictions about the future are," but in its success in transforming the uncertainty of the real world into a super market that can be standardized, traded at high frequency, and sustainably profitable.
In the past, prediction markets proved they could attract massive traffic; now, they are proving to be an unparalleled good business.
Calculation method: Extract the market price order and limit order ratio for each market, then estimate the impact of p × (1 - p) on fees based on different price ranges, finally combine the fee rates corresponding to each market to calculate roughly how much fee each market contributed.
Original Article Link
Welcome to join the official BlockBeats community:
Telegram Subscription Group: https://t.me/theblockbeats
Telegram Discussion Group: https://t.me/BlockBeats_App
Official Twitter Account: https://twitter.com/BlockBeatsAsia